Operations | Monitoring | ITSM | DevOps | Cloud

The Top Paid, Free & Open Source Business intelligence (BI) Tools For 2021

Business Intelligence (BI) tools allow businesses to gather, process and analyse large amounts of data so that they are able to make decisions and see opportunities as well as visualise and report on key metrics for Stakeholders. The range of Business Intelligence tools available to use is an ever-expanding list with newcomers to the market appearing every year.
How to Monitor MongoDB Logs

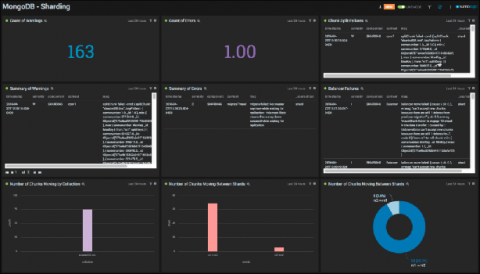
MongoDB is a leading NoSQL database that has proven itself through time as a stable and easy-to-use system of great flexibility. There are numerous tutorials and real-world success stories that show how MongoDB has helped with supporting the database needs of certain organizations and projects. It’s fair to say that using MongoDB proves to be a solid choice for integrating with web-based applications and microservices serving as a database system or even as a monitoring aggregator itself.

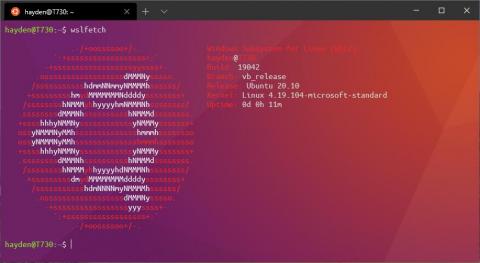
New installation options coming for Ubuntu on WSL

The experience of installing Ubuntu on Windows Subsystem for Linux (WSL) just keeps getting better. Beginning in Windows 10 Insiders Preview build 20246, released today by Microsoft, users can enable a complete WSL experience. This will enable WSL 2, download and install the latest WSL 2 Linux kernel, and then download and install the most recent Ubuntu LTS on WSL.

What Are the Pros and Cons of File Sharing?

File sharing is a method used by some organizations where multiple employees have access to the same files. How the files are accessed does vary depending on the user environment. The files could be shared between two computers, where the files are stored on one computer and another user accesses them from their workstation. The files might be stored on a network file server instead of on a local workstation.

Let's start a revolution: Analytics in Action

At ServiceNow, we define analytics as using data to make better, faster decisions to run the company. We use analytics to not only spotlight every corner of our operations, but we also to spark growth, by giving our employees data-driven decision-making capabilities. That means they can take action every single day by using data and digital workflows. In order to drive data-driven decisions, we created a user-centric analytics program based on five major elements, which are listed below. 1.

Modernization Starts With Infrastructure

Today, every company is a software company and digital business is a core strategy for many organizations. To gain the much-needed agility and efficient scalability, companies in all verticals are modernizing their infrastructure by moving to hybrid, multicloud and cloud-native environments. Realizing that modern applications run on modern infrastructure, IT leaders are prioritizing infrastructure modernization initiatives.

How to download an Azure VM

If you require a way to download your Azure Virtual Machine to either your on premise VMware or Hyper-V environment, perhaps because the cost of running that Azure VM is too high, or even for some compliance reason this blog will show you how to quickly download your Azure VM easily with Carbon. No need to download your Azure VM via powershell, or even downloading the VHD from the Azure portal. Carbon will download and convert your Azure VM to your hypervisor of choice with just a few clicks.

ObservabilityCON Day 2 recap: The latest Grafana Cloud tools for Prometheus to improve alerting, debugging, and scaling. Plus why continuous monitoring matters now

ObservabilityCON 2020 is live! This week Grafana Labs is bringing together the Grafana community for talks dedicated to observability. We hope you’re able to catch the great sessions we have planned. You can find the full schedule on the event page, and for additional information on viewing, participating in Q&As, and more, check out our quick guide to getting the most out of ObservabilityCON. Day 2 was dedicated to all things Prometheus — featuring new solutions and in-depth case studies.

Netdata's dashboard: open by default and secure by design

Let’s talk through a scenario: You have a Linux-based VM running on DigitalOcean (aka a Droplet), and you install Netdata on it using our recommended kickstart script. As the installation process winds down, the Droplet starts up the Netdata Agent’s web server and serves the local Agent web dashboard on port 19999.

Top 10 Log Monitoring Reports You Must Have

Log monitoring can be a tedious process. When you have logs, you generate numerous log files in the log database that you need to track. Though a log file parser can help you search through multiple or large logs easily, it’s typically one of those processes which we only look at once it stops working. The windows system logs contain operating system logs as well as logs from applications such as Internet Information Services (IIS) and SQL server.