Operations | Monitoring | ITSM | DevOps | Cloud

How to filter metrics by label?

It is sometimes easy to get lost in the mountain of metrics and infinite number of dimensions when working with an infrastructure monitoring tool. Being able to filter metrics by label and visualize only what is relevant to the current scope of monitoring & troubleshooting, becomes absolutely crucial to the success of SREs, Sysadmins and DevOps professionals.
Missing indexes in PostgreSQL? How to quickly identify it

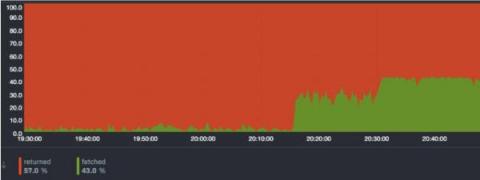
While working on improving the Netdata PostgreSQL collector, we were monitoring our production PostgreSQL instance and something caught our attention immediately. The rows fetched ratio seemed really, really low for one particular database… there were missing indexes in PostgreSQL! Rows fetched ratio is the percentage of rows that contain data needed to execute the query (rows fetched), out of the total number of rows scanned (rows returned).

PostgreSQL Monitoring Upgrade

Netdata for PostgreSQL monitoring just got a huge upgrade, collecting 100+ PostgreSQL metrics and displaying these across 60+ different composite charts. You can check the reference documentation for the full list of metrics, and see them running live in the demo space. If you are using PostgreSQL in production, it is crucial that you monitor it for potential issues. And the more comprehensive the monitoring the better!

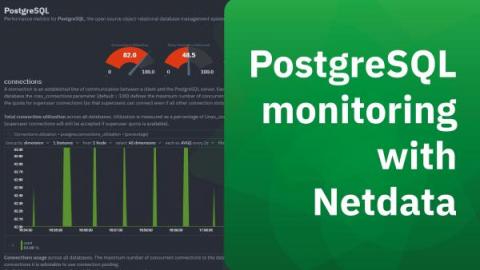
PostgreSQL Monitoring with Netdata

PostgreSQL is a popular open source object-relational database system designed to work for a wide range of workloads from single machines to data warehouses to web services with many concurrent users. PostgreSQL runs on all major operating systems and is used by teams and organizations across the world, including Netdata. If you are using PostgreSQL in production, it is crucial that you monitor it for potential issues. And the more comprehensive the monitoring the better!

Introducing Netdata Source Plugin for Grafana: Enhanced high-fidelity troubleshooting data source for the Open Source community!

The open-source community is about to benefit greatly from Netdata’s new Grafana data source plugin, which makes use of a powerful data collection engine. This new plugin maximizes the troubleshooting capabilities of Netdata in Grafana, making them more widely available. Some of the key capabilities provided to you with this plugin include the following.

Data Collection Strategies for Infrastructure Monitoring - Troubleshooting Specifics

Monitoring and troubleshooting; unfortunately, these terms are still used interchangeably, which can lead to misunderstandings about data collection strategies. In this article we aim to clarify some important definitions, processes, and common data collection strategies for monitoring solutions. We will specify the limitations of the described strategies, as well as key benefits which can potentially be also used for troubleshooting needs.

How Netdata's Machine Learning works

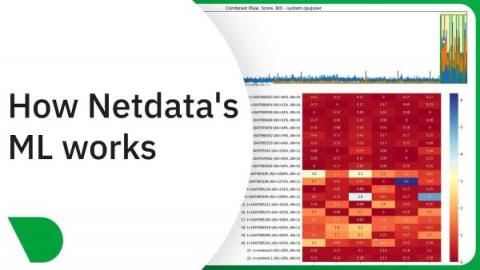
Following on from the recent launch of our Anomaly Advisor feature, and in keeping with our approach to machine learning, here is a detailed Python notebook outlining exactly how the machine learning powering the Anomaly Advisor actually works under the hood. Or if you’d rather watch a video walkthrough of the notebook then check out below. Try it for yourself, get started by signing in to Netdata and connecting a node.

How Netdata's machine learning works

In this video we will walk though the Netdata Anomaly Advisor deepdive python notebook. The aim of this notebook is to explain, in detail, how the unsupervised anomaly detection in the Netdata agent actually works under the hood. No buzzwords, no magic, no mystery :) Try it for yourself, get started by signing in to Netdata and connecting a node. Once initial models have been trained (usually after the agent has about one hour of data, zero configuration needed), you'll be able to start exploring in the Anomaly Advisor tab of Netdata.