Operations | Monitoring | ITSM | DevOps | Cloud
November 2021
3 IT Workflow Automation Use Cases to Turbocharge Your Business
According to a recent survey by Gartner, business leaders anticipate a return to growth for their enterprises and industries in 2022, and a big part of their investment plans involve digital transformation. In fact, 20% of CEOs cited digital transformation as a priority for strategic investment. That is a significant shift from 2012 when Gartner found that only 2% of CEOs surveyed had made digital transformation a priority.
Observability And AIOps: Why Convergence Is The Future To Improving Uptime
On October 4, Facebook and its properties, Instagram and WhatsApp, were down for more than five hours due to configuration changes on routers in Facebook’s data centers. A five-hour outage is an eternity in our always-on digital economy, costing the company an estimated $65 million and 4.8% in stock valuation. The high-profile Facebook outage is emblematic of just how digitally intermediated our economy is becoming, and the incident renews C-level focus on preventing similar service failures.
Simpler Navigation in AppSignal: A Story About Refactoring Design
AppSignal users will immediately notice that we’ve updated our product navigation. The new navigation is simpler, cleaner, and improves usability for (power) users. Let’s dive into these changes, along with some background on our philosophy of designing for developers.
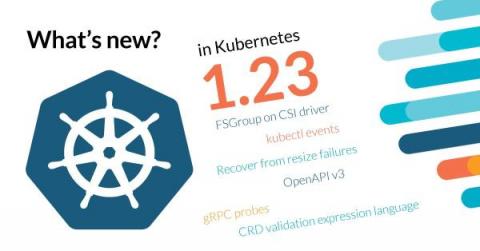
Kubernetes 1.23 - What's new?
Kubernetes 1.23 is about to be released, and it comes packed with novelties! Where do we begin? This release brings 45 enhancements, on par with the 56 in Kubernetes 1.22 and the 50 in Kubernetes 1.21. Of those 45 enhancements, 11 are graduating to Stable, a whopping 15 are existing features that keep improving, and 19 are completely new. The new features included in this version are generally small, but really welcomed. Like the kubectl events command, support for OpenAPI v3, or gRPC probes.
Webinar: Good monitoring in action - a real life example with allpay
3 Reasons Why Microsoft Mesh for Microsoft Teams Makes Performance Monitoring More Important Than Ever
Written by Microsoft MVP Nick Cavalancia. Earlier this month, Microsoft announced the 2022 rollout of Mesh for Microsoft Teams as the next step in online and virtual collaboration. This seemingly bold step forward into a new type of interaction between individuals is more a natural evolution, taking years of augmented reality research and applying it in a way that provides value to organizations wanting to better collaborate.
[Webinar] Solving for multi-cloud visibility in minutes
What is 'Time to Awesome'?!
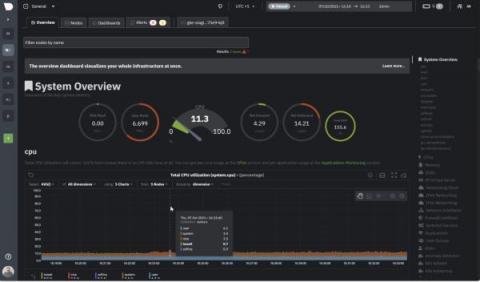
All-new Netdata Cloud Charts 2.0
Netdata excels in collecting, storing, and organizing metrics in out-of-the-box dashboards for powerful troubleshooting. We are now doubling down on this by transforming data into even more effective visualizations, helping you make the most sense out of all your metrics for increased observability. The new Netdata Charts provide a ton of useful information and we invite you to further explore our new charts from a design and development perspective.
AppDynamics is now an AWS Migration and Modernization Competency Partner
The AWS Migration and Modernization Competency identifies industry leaders with proven technical proficiency and customer success. That's AppDynamics.
Real User Monitoring: How to Improve Your Target Audience Reach
How We Launched LogStream Cloud on AWS Graviton2
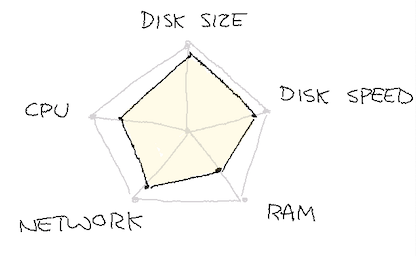
In this post, we’ll walk through our journey of launching Cribl LogStream Cloud on AWS Graviton instances. In order to put our journey into perspective, it is worth spending a few moments to describe the product and its resource requirements.
Microsoft Teams on Citrix: Configuration and Deployment
Since early 2020, there has been a massive growth in the number of active Microsoft Teams users and organizations deploying Teams; now, there are more than 200 million monthly active users across the globe. With an increase in market share, it’s one of those applications that you either expect an organization to be already using or planning to deploy out to their environment sooner rather than later.
Scaling Kafka at Honeycomb
When you send telemetry into Honeycomb, our infrastructure needs to buffer your data before processing it in our “retriever” columnar storage database. For the entirety of Honeycomb’s existence, we have used Apache Kafka to perform this buffering function in our observability pipeline.
Cloud cost management and optimization: How to regain control over your bill
The cloud is today one of the most expensive resources for any modern organization, second only to employee salaries and overhead. According to recent research by Gartner, end-user spending on public cloud services will reach $396 billion in 2021 and grow 21.7% to reach $482 billion in 2022. By 2026, Gartner predicts public cloud spending will exceed 45% of all enterprise IT spending, up from less than 17% in 2021.
The Monitor - October 2021
The OpsRamp Monitor captures the latest buzz around what’s trending in the world of ITOps and related technology, and October saw some significant news, including Facebook’s unprecedented outage. Let’s dig in.
Driving Unified Visibility within Modern Digital Environments
Operational monitoring can be like looking down the wrong end of a telescope. There’s no clear picture of the horizon. Everything is blurred, indistinct, and difficult to trace. If you’re relying on traditional, domain-centric monitoring, you’re faced with a similar problem: you can see the performance of individual elements, but you don’t have any visibility into the broader picture.
Monitor Salesforce's Real-Time Events with Splunk
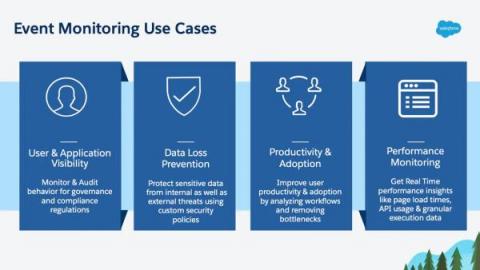
In 2019 Salesforce announced the general availability of Real-Time Event Monitoring (RTEM) which includes 19 different events that help monitor & secure your Salesforce data. Real-Time Event Monitoring stores events for 6 months as Salesforce Big Objects and streams events via Salesforce’s Streaming API in near real-time.
The Kids are Connected: Ensuring Connectivity in Education Networks
User experience is a focus of Sumo Logic Observability innovations
Best Practices to Monitor Node.js Performance
Built on the V8 JavaScript engine of Chrome, Node.js is a very lightweight, open-source framework with minimum modules. And since it is an asynchronous system by default, it is faster than most other frameworks. DevOps still need Node.js monitoring to ensure performance better than other frameworks. In order to understand how relevant Node.js still is, note that PayPal, Reddit, LinkedIn, Amazon, Netflix and other high-use, high-visibility service providers use the framework.
For True Observability, Look Beyond Metrics, Logs & Traces
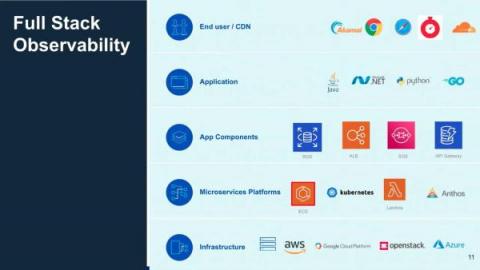
Achieving full, 360-degree observability across your entire IT ecosystem and application components can be thwarted by the disconnect between technical monitoring and business outcomes - running the risk of catastrophic service failures.
NiCE VMware Management Pack 5.4 released
The NiCE VMware Management Pack 5.4 is an enterprise-ready Microsoft SCOM add-on for advanced VMware vSphere and ESXi monitoring. It supports the VMware administrator in centralized vSphere and ESXi health and performance monitoring to improve user experience and business results. The new NiCE VMware Management Pack 5.4 comes with new features, such as extensive vSAN monitoring options, vCenter Service monitoring, Snapshot management, Datastore Provision monitoring, as well as Certificate tracking.
The Essential Components of Digital Transformation
The digital revolution forced every organization to reinvent itself, or at least rethink how it goes about doing business. Most large companies have invested substantial cash in what is generally labelled “digital transformation.” While those investments are projected to top $6.8 trillion by 2023, they’re often made without seeing clear benefits or ROI.
VMware Management Pack Update Release (21.11.2612.0)
Key Takeaways from our digital SCOM Usergroups
What is APM? Overview and Features (The Beginner's Guide)
Application performance monitoring (APM) extends observability beyond system availability, service performance, and response times in current, cloud-native contexts. Organizations can improve user experiences at the scale of modern computing by using automatic and intelligent observability. User experiences in software applications are monitored and managed using APM technologies.
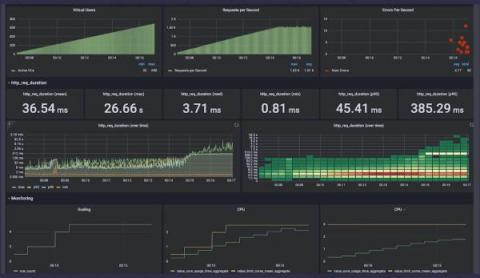
How to build performance tests into your CI pipeline with k6, GitHub Actions, and Grafana
Performance testing is an essential component of building fast and reliable web services. Until recently, this testing typically happened later in the development process and was often performed by a separate team or even a third party. But speed is the competitive advantage for companies, and prioritizing testing during the development process can speed time to market for new applications.
Virtana Optimize | Cloud Cost Management Solution
HTTP/3 is Fast
Introducing LM Concierge
Troubleshoot Javascript (in real-time)
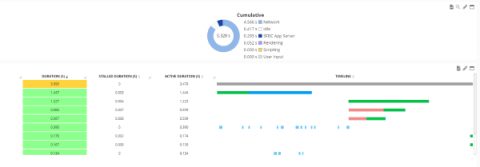
Javascript execution analysis on dev environments is easy—just use Google Developer or some other free tools. However, getting the same level of analysis while your application is being used by a real user is much harder. You can’t possibly ask the end-user to help you troubleshoot. Even if you did, the user probably wouldn’t know what to do and they definitely wouldn’t be impressed by your organization.
MSP Remote Monitoring & Management Tools
eG Innovations is an end-to-end performance monitoring solution provider with a dedicated MSP solution and an MSP partner program to allow MSPs to use our functionality to provide value-added premium services. For example, MSPs use our eG Enterprise solution to provide managed first line helpdesk support or to provide dashboards and portals to enable individual clients to monitor their IT infrastructures and applications.
OpenTelemetry Browser Instrumentation
One of the most common questions we get at Honeycomb is “What insights can you get in the browser?” Browser-based code has become orders of magnitude more complex than it used to be. There are many different patterns, and, with the rise of Single Page App frameworks, a lot of the code that is traditionally done in a backend or middle layer is now being pushed up to the browser. Instead, the questions should be: What insights do frontend engineers want?
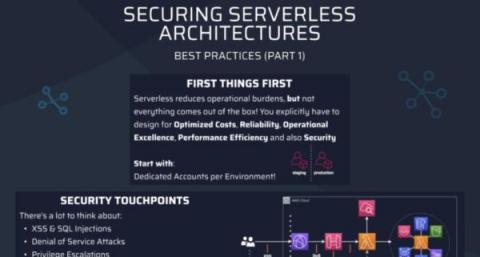
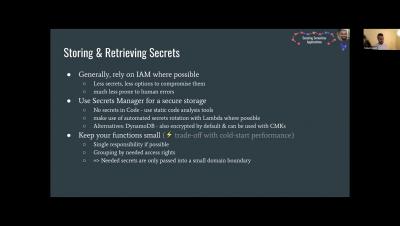
[Infographics] Securing serverless architectures
Serverless reduces a lot of operational burdens, but a ������������ ������������������������ is still your responsibility 🔐 From web threats, over IAM principles to auditing and monitoring.
Tips for a Successful OpenTelemetry Deployment
OpenTelemetry offers vendor-agnostic APIs, software development kits (SDKs), agents, and other tools for collecting telemetry data from cloud-native applications and their supporting infrastructure to understand their performance and health.
Cloud Elasticity: What Happens When You Lose Control
In an on-premises environment, you have to pay for the capacity you have regardless of whether you’re using it, and you can’t exceed that capacity without purchasing and provisioning new hardware. In the cloud, however, you have much more flexibility thanks to cloud elasticity, which is the ability to automatically provision or deprovision resources based on workload changes.
Digital Wellbeing and the Overlapping Roles of HR and IT
Who oversees employee digital wellbeing? Nexthink’s Meg Donovan (Chief People Officer) and Tim Flower (Global Director of Business Transformation) recently sat down to answer this question on the minds of so many business leaders. Of course, Human Resources departments have traditionally shouldered the responsibility of managing employee wellbeing. But a recent Nexthink survey reveals that unreliable IT services and equipment is the third biggest contributor to employee turnover and burnout.
Sensu Go 6.5: Sensu Plus, High-performance Handlers, and Pipeline Resources
Sensu Go 6.5 is another feature-packed release and our first integration with the Sumo Logic Continuous Intelligence Platform. In this post, we’ll review the new features that make Sensu Go 6.5 such a banner release, and give you a sneak peek of what we have planned for future Sensu Go releases.
WFA: Visible - Microsoft Office Dashboard
GCP Integrations for Metrics with Logz.io
Logz.io has dedicated itself to encouraging and supporting cloud-native development. That has meant doubling down on support for AWS and Azure, but also increasing our tie-ins with Google Cloud Platform – GCP. Recently, our team added dozens of new integrations for metrics covering the gamut of products in the GCP ecosystem.
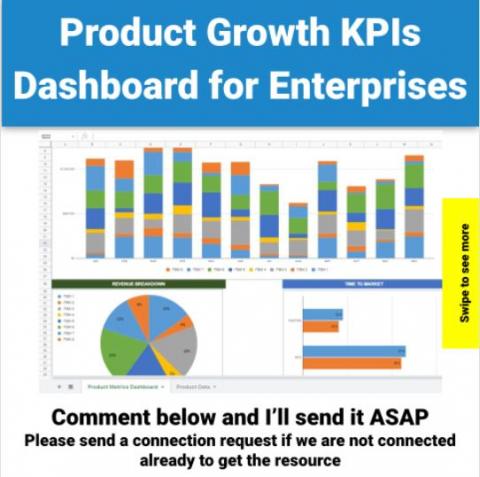
Product Growth KPIs Dashboard for Enterprises
There can be as many as 64 important business metrics for your company to track (according to nTask). That can sound daunting. But if your organization doesn’t have the capacity to track all of them, it should at least track the most important ones according to its business model, stage and focus areas. For example, key product metrics not only provide information to product managers, but also other relevant stakeholders across the organization.
Black Friday Requires Dynamic Integration Infrastructure Management
Life for an IT architect in retail would be so much easier if people would just spread their shopping out across the year. Since 1941 American Thanksgiving has been a holiday on the fourth Thursday of November and most American companies and schools take the following day as a holiday too with major retailers offering price reductions on this day to kick start the Christmas shopping season. Since 2005 it has been the busiest shopping day of the year.
How Kambi migrated from an in-house Graphite solution to Grafana Cloud
When you’re a sports betting technology company and you realize your in-house, on-prem Graphite solution for monitoring metrics is no longer a sure-thing, what do you do? That was the dilemma at Kambi, a quickly growing business – with a passion for using open source technology – that has about 500 different micro services in production and around 200,000 incoming metrics messages per second.
Dashbird explained
Build VS Buy: How to get the most out of your SCOM monitoring
Securing enterprise-level Serverless applications
You can find more resources and articles about serverless on our blog: https://dashbird.io/blog/
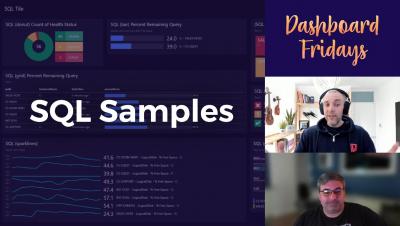
Dashboard Fridays: Example SQL Samples Dashboard
Setting up Alerts on Metrics with SigNoz
Introduction to Alarm Templates in Foglight 6
With the release of Foglight version 6, alarm management has been simplified with the use of alarm templates. You can access Alarm Templates directly from the left-hand panel in the new UI. However, if you've upgraded from a previous version, it helps to start using the familiar alarm configuration workflow. There is a new tab for "Alarm Template Settings." This allows you to do 2 tasks.
Four powerful Alerting workflows with Raygun
Announcing support for Windows containers on AWS Fargate
AWS Fargate is a serverless compute engine that allows you to deploy containerized applications with services such as Amazon ECS without needing to manage the underlying virtual machines. Deploying with Fargate removes operational overhead and lowers costs by enabling your infrastructure to dynamically scale to meet demand. We are proud to partner with AWS for its launch of support for AWS Fargate on Windows containers.
Top 4 pitfalls causing poor monitoring in an IT estate
As we speak, there are likely thousands of organizations running some type of monitoring solution out there, each within unique operational structures, but the difference between those that that are successful and those that are not can be attributed to 4 root causes. Not surprisingly, these 4 root causes apply to any toolset or technology used. That’s largely due to the likelihood that the best tools in the world used poorly will deliver poor results.
How to improve the customer service experience through status pages
With the 2021 holiday season right around the corner and the COVID-19 pandemic still prevalent, businesses are being conducted online now more than ever. The holiday rush also comes with incidents like websites going down, slow load times, and even possible hacking attempts. While planning to tackle the sudden increase in website traffic during the festive season, businesses must have an incident response plan in place to handle unexpected outages and the consequent surge in customer inquiries.
VirtualMetric's Heatmaps
Development workflows and setups for serverless
You can find more resources and articles about serverless on our blog: https://dashbird.io/blog/
Monitoring large scale serverless applications
You can find more resources and articles about serverless on our blog: https://dashbird.io/blog/
k6 introduces browser automation and Prometheus support in k6 OSS
While there is a lot of focus on the three pillars of observability to provide insight into application performance in production, load testing is the other side of the observability story. By using the open source load testing tool k6 — which Grafana Labs acquired earlier this year — developers can simulate real-world traffic to test the reliability and performance of software changes and new features, not to mention flag performance issues before impacting end users.
Bringing Specto into the Sentry Family
We’re delighted to announce that we’ve acquired Specto, a powerful mobile profiling tool from ex-Facebook mobile experts who share our determination for building developer-first performance monitoring products that actually suit the modern dev stack.
Tip of the Month: Measuring Cluster Performance within a Tier
This Month in Datadog: November 2021 (Episode 6)
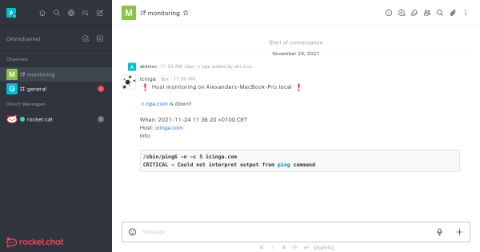
Icinga 2 Rocket.Chat notifications. The complete guide
About one year ago the NETWAYS colleagues showed you how to let Icinga 2 notify users through XMPP/Jabber. Now it’s time to also cover the somewhat more fancy Rocket.Chat.
Monitoring Elastic Enterprise Search performance using Elastic APM
Elastic APM is a free, open and powerful observability tool that provides intelligence into application performance for a myriad of production applications (e.g., throughput, error rates, latency, resource usage, transaction traces). You can now enable Elastic APM integration to gain deep insight into the performance behaviors of your Elastic Enterprise Search deployment!
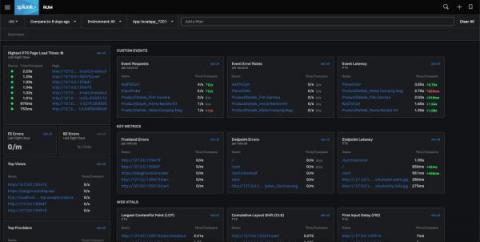
Announcing the General Availability of Splunk RUM Custom Events
With a 70% increase in internet usage, and digital teams adopting cloud-native technologies at a rapid rate, the importance of measuring customer experience on digital properties is not just a technical problem, but a business imperative. Frontend developers and SREs use Real User Monitoring (RUM) to understand critical components of their end-user experience, like how quickly users see content, when a page becomes interactive, and a page's visual stability.
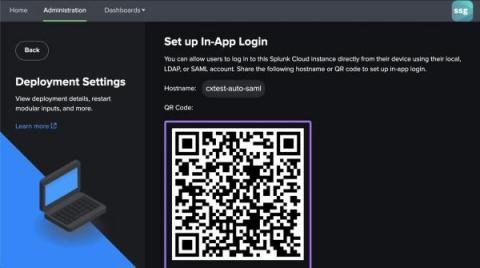
Logging into your Connected Experiences
After checking out the Get Started with Connected Experiences blog, you’ll be an expert on 1) how your Splunk data gets to mobile, (2) how to unlock mobile for your Splunk instance, and (3) how user management works. So, with this blog, I’d say it’s time to talk about the many login methods users can leverage with their Splunk instance on mobile.
Introduction to Time Series Forecasting with Tensorflow and InfluxDB
Wouldn’t it be nice to be able to perfectly predict the future? We are a long way from being able to do that, but that is basically the goal of anybody working in the data science field — take a bunch of historical data and then try to make future predictions based on that data.
Monitoring Distributed Systems
There was a time when standing up a website or application was simple and straightforward and not the complex networks they are today. Web developers or administrators did not have to worry or even consider the complexity of distributed systems of today. The recipe was straightforward. Do you have a database? Check. Do you have a web server? Check. Great, your system was ready to be deployed.
5 Things Developers Need to Know About Kubernetes Management
Kubernetes management can be daunting for developers who don’t have specialized understanding of the orchestration technology. Learning Kubernetes takes practice and time, a precious commodity for devs who are under pressure to deliver new applications. This post provides direction on what you need to know and what you can skip to take advantage of Kubernetes. Let’s start with five things you need to know.
Four powerful Alerting workflows
Announcing support for Graviton2-powered AWS Fargate deployments
AWS Fargate is a serverless compute engine that allows you to deploy containerized applications on services like Amazon ECS without needing to provision or manage compute resources. Now, Datadog is proud to be a launch partner with Amazon for their support of AWS Fargate workloads running on Graviton2, Amazon’s proprietary ARM64 processor.
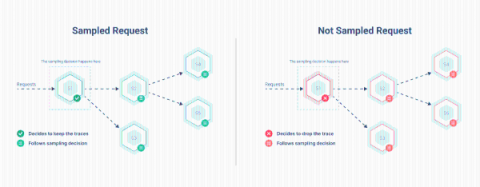
How to Keep Traces for Slow and Failed Requests
Today we are introducing Local Tail-Based sampling in Kamon Telemetry! We are going to tell you all about it in a little bit but before that, let’s take a couple minutes to explore what is sampling, how it is used nowadays, and what motivated us to including local tail sampling in Kamon Telemetry.
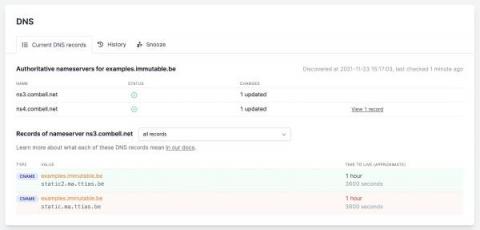
You can now monitor your DNS records using Oh Dear
We can now notify you of changing DNS records and let you know when we've detected a problem with your domain nameservers. Woohoo! 🥳
Monitoring of Video Cameras
Video cameras are gaining more and more applications every year. Besides the security issues, a lot of others, related to house and family care, entertainment, education etc are widely used nowadays.
Datadog vs. Dynatrace vs. Scout
Application Performance Monitoring is undoubtedly the hottest tool to accelerate any product’s growth in the modern market. The term has grown from a simple performance tracking operation to full-fledged infrastructure, network, and application observability. This evolution has only helped bring more and more growth into products. It is essential to choose the best-suited monitoring solution for your apps since observability involves way too many moving pieces.
Monolithic (Legacy) vs. Microservices Application Development
What's new in Sysdig - November 2021
Welcome to a new update of “What’s new in Sysdig.” Happy All Saints’/Souls’ Day! Happy International Pianist Day! Happy Thanksgiving! Happy Diwali! Glad alla helgons dag. The “What’s new in Sysdig” blog has been rotated to a new team, and this month, Peter Andersson is responsible for the publishing. Thanks to Chris Kranz for an excellent job compiling these articles earlier.
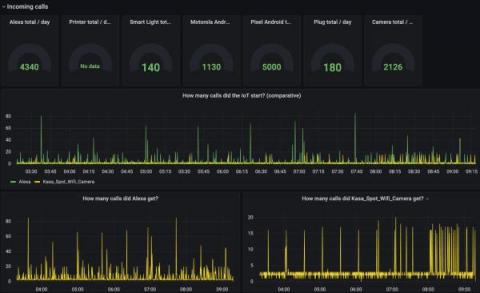
Visualizing IoT security metrics with Grafana at Network to Code
As the number of connected gadgets in our homes, offices, and industrial networks continues to grow exponentially, keeping IoT devices secure has become a vital part of our everyday lives. However, our webcams, printers, and smart plugs often lack security features due to their fast time to market, making them particularly vulnerable to attack. And because security metrics themselves can be tricky to assess, tracking IoT device security is increasingly a challenge.
Save 85% in Time Spent on Root Cause Analysis with Topology-based Observability | StackState demo
Time-traveling topology in observability w/ Mark Bakker and Lodewijk Bogaards | The StackPod EP #1
The Illusive World of Monitoring for Legacy Systems
In the tech industry, we obsess over the latest and greatest. When it comes to observability, we’re always looking at the most advanced hardware, the enthusiasts’ favorite systems, and the tech venture capital trends to get an idea of what to build for next. observIQ is no exception.
Crash Rate Alerts [October Show & Tell]
We're Thrilled To Share - Coralogix has Received AWS DevOps Competency
At Coralogix, we believe in giving companies the best of the best – that’s what we strive for with everything we do. With that, we are happy to share that Coralogix has received AWS DevOps Competency! Coralogix started working with AWS in 2017, and our partnership has grown immensely in the years since. So, what is our new AWS DevOps Competency status, and what does it mean for you?
Mentorship and Shared Languages of Network Engineering with Cat Gurinsky | Network AF Episode 6
What Is an SSIS Package and How Do You Create One?
LogStream Cloud How To: Sending Data to LogStream from Various Agents
Cribl released LogStream Cloud to the world in the Spring of 2021, making it easier than ever to stand up a functional o11y pipeline. The service is free for up to 1TB per day and can be upgraded to unlock all the features and support with paid plans starting at $0.17 per GB so you pay for only exactly what you use. In this blog post, we’ll go over how to quickly get data flowing into LogStream Cloud from a few common log sources.
Rest easy; you won't kill Santa Claus
Slow applications don’t make the season any brighter. For many IT pros, it’s a time of war rooms and swarming. How are you going to sleep this holiday season? “It sems that when people have a less-than-favorable online experience, they fault the company immediately.
Checkly Runtime 2021.10 with faker.js and updated Playwright
Checkly has released a new runtime version 2021.10. This is great news for anyone creating browser checks in Checkly, as we have added some new features and brought everything up to date.
File Server Management: How to and Best Practices
True work revolves around the access and modification of files, and what better way to store and distribute work files than through a file server? The central-access model for storing and managing files brings many benefits to an organization. Most importantly, everyone can access a single, accurate version of any file on the server. Easy as that sounds, this feat is only possible with proper file server management.
Cloud Monitoring Best Practices: 5 to Adopt
An exponential increase in the generation of data led to the rise of the Big Data era. Among other factors, the cost of scaling up businesses to accommodate so much data prompted many businesses to switch to virtual cloud platforms. The cloud can store, organize, and manage all the data and applications for a company in a virtual environment. Monitoring this environment is crucial, because it’s susceptible to cyberthreats, like data breaches.
What Is an AIOps Strategy and How Should You Form One?
IT operations data grows by the year. Some estimates suggest that the average IT operations team watches their operational data volume double or triple every year. The result of this flood is that IT teams are grasping for any method they can find to make sense of all this data. Many teams are landing on AIOps as their solution to parse and categorize all of these events. AIOps isn’t a perfect fit for every organization, but it is a great fit for many.
6 Challenges to Monitoring with Prometheus
If GitHub stars are any indication, Prometheus has been doubling in usage year over year since its inception. While at Moogsoft we love Prometheus as the metrics foundation of our observability platform, there were some challenges to overcome to make it the rock-solid piece of our stack it is today.
Six Lessons From Startups For Product Development Projects
There is no shortage of content and guidance freely available on the web on how to think like a startup, act more like a startup, turn your various business units into innovation factories like startups and become more agile and responsive to customer demands just like startups.
Splunking Your *.conf Files: How to Audit Configuration Changes Like a Boss
For years customers have leveraged the power of Splunk configuration files to customize their environments with flexibility and precision. And for years, we’ve enabled admins to customize things like system settings, deployment configurations, knowledge objects and saved searches to their hearts’ content. Unfortunately a side effect of this was that multiple team members could change underlying.conf files and forget that those changes ever occurred.
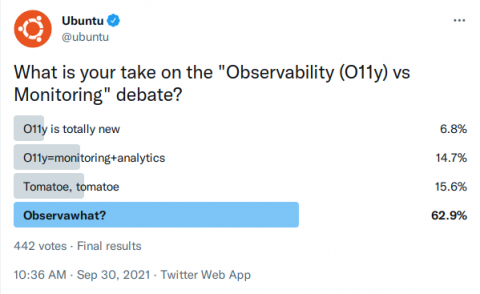
Observability vs. monitoring debate: An irreverent view
In the past few years, the word “observability” has steadily gained traction in the discussions around monitoring, DevOps, and, especially, cloud-native computing. However, there is significant confusion about the overlap or difference between observability and monitoring.
DevOps State of Mind Podcast Episode 2: Giving People the Power to Participate
Sean Tierney is the DevOps lead at Athos, a company that's building better athletes through smart clothing and AI. Sean reinforces a DevOps state of mind across the organization by building empathy between hardware and software teams and putting the systems in place to allow them to move faster as a single unit.
Real User Monitoring (RUM) vs. Synthetic Monitoring Comparison
Three seconds is all it takes before your customer decides to leave. Would you imagine that! The audacity of some people! But, can you really blame them? We live in a fast-paced world. Wasting people’s time is worse than wasting their money. Developers are striving to provide value in as short of time as possible. Just as I am now writing this tutorial. I’m adamant about not wasting your time but providing you with concrete info for you to learn something new.
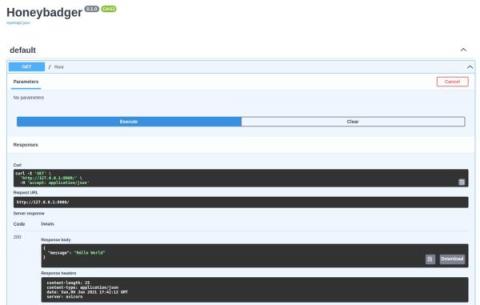
How to Add Exception Monitoring to FastAPI
FastAPI is a high-performance web framework for building APIs with Python that has been growing in popularity. In this article, Stefano Frassetto shows us how to set up error monitoring for a FastAPI app using Honeybadger.
Solving For Multi-Cloud Visibility With OpsRamp
How Snyk, TripAdvisor, and Citibank use Grafana to effectively scale observability
It’s one thing to set up an observability strategy. But what’s it like to introduce and scale observability effectively across an organization? In a wide-ranging conversation at ObservabilityCON 2021, three technical pros from Snyk, TripAdvisor, and Citibank joined Grafana Labs VP Global Solutions Engineering Steve Mayzak and — with more than 75 years experience between them — they shared the triumphs and turbulence in their respective observability journeys.
IoT Monitoring with InfluxDB
What is 'Time to Awesome'?!
Partner Integration - Dynatrace with PagerDuty and Rundeck
How to Make Splunk Run 100x Faster With Cribl LogStream
5 Best Network Inventory Tools and Software
Three Tactics to Boost SaaS Performance (and One that Saves Money)
It’s a digital world—we just work and play in it...Unless, of course, you work in the IT group responsible for digital experience. Then you also have nightmares in it. Here’s why.
The Ultimate Combo: Artificial intelligence and data centers
For artificial intelligence to be devoted to scaring us to death through iconic movies like 2001 or Terminator is a thing of the past, today it has other, much more interesting and practical purposes. For example, crowning itself by playing a fundamental role in data processing and analysis. Yes, that’s her, the futuristic AI, increasingly faster, more efficient and, now, necessary to manage data centers.
Embracing invokedynamic to tame class loaders in Java agents
One of the nicest things about Byte Buddy is that it allows you to write a Java agent without manually having to deal with byte code. To instrument a method, agent authors can simply write the code they want to inject in pure Java. This makes writing Java agents much more accessible and avoids complicated on-boarding requirements.
Is FinOps All Talk and No Walk?
I am a big proponent of cross-functional alignment, as I remnded our ELT at a recent off-site meeting. There’s a lot of buzz about FinOps bringing financial accountability to cloud spend by eliminating procurement siloes and implementing cross-functional best practices. As the CFO of a SaaS company, I fully support this practice. In fact, Virtana recently made some changes to our cloud infrastructure as part of our own evolution.
Sumo Logic extends monitoring for AWS Fargate powered by AWS Graviton2 processors
How to streamline Windows monitoring for better security
Galileo Cloud Compass Makes Calculating Cloud Costs EASY
Overcoming Common Serverless Challenges in Production
Obfuscate user data with Session Replay default privacy settings
Session Replay enables you to replay in a video-like format how users interact with your website to help you understand behavioral patterns and save time troubleshooting. Visibility into user sessions, however, can risk exposing sensitive data and raise privacy concerns. For example, a user session may include typing in a credit card or social security number into an input field.
Monitor Google Workspace with Datadog
Google Workspace (formerly G Suite) is a collection of cloud-based productivity and collaboration tools developed by Google. Today, millions of teams use Google Workspace (e.g., Gmail, Drive, Hangouts) to streamline their workflows. Monitoring Google Workspace activity is an essential part of security monitoring and audits, especially if these applications have become tightly integrated with your organization’s data.
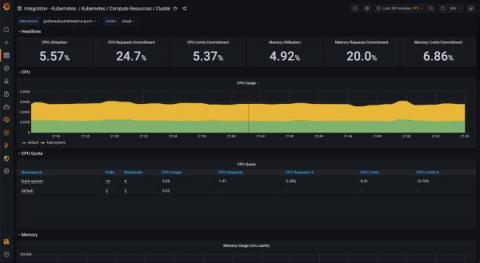
A 3-step guide to troubleshooting and visualizing Kubernetes with Grafana Cloud
Back in May, we announced the Kubernetes integration to help users easily monitor and alert on core Kubernetes cluster metrics using the Grafana Agent, our lightweight observability data collector optimized for sending metric, log, and trace data to Grafana Cloud. Since then, we’ve made some improvements to help our customers go even further.
Top 7 ManageEngine Competitors and Alternatives in 2021
ManageEngine is Zoho Corporation's enterprise IT management software subsidiary. AdventNet Inc. was founded in 1996 and was known as such until 2009. Over 90 tools are included in ManageEngine to assist you in managing all areas of your IT infrastructure, including networks, applications, servers, service desks, security, active directory, desktops, and mobile devices. They've also built products with contextual integration from the ground up to ensure that you can manage your IT together.
Tip of the Month: Experience Journey Map
Tip of the Month: Instrumenting AWS Lambda Functions with AppDynamics
Tip of the Month: Customer Resources
Understanding Apache Logging: How to View, Locate and Analyze Access & Error Logs
Apache – the technology that powers the web. I’m not sure if that is correct, but I think that we wouldn’t see the world wide web in its current shape without it. Launched in 1995 and since April 1996, it has been the most popular web server around the world. Because of handling your users’ requests, Apache serves as the front application. It is crucial to understand what your server is doing, what file users are accessing, from where they came, and much, much more.
Using HTTP Caching: 2022 Guide
SDK Overhead Measurement [October Show & Tell]
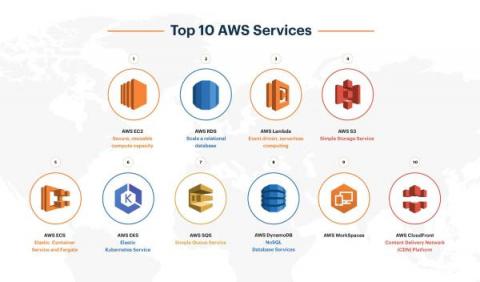
Top 10 AWS Services Explained With Use Cases
Amazon Web Services (AWS) is one of the most comprehensive and broadly adopted cloud service providers in the industry, offering over 200 fully featured services from data centers globally. A large spectrum of clients across verticals uses AWS to lower costs, become more agile and innovate faster. A recent survey estimates that AWS is the largest cloud service provider and accounts for 32% of the worldwide cloud services market.
AWS Lambda Pricing Model Explained With Examples
In this article we’ll go through the ins and outs of AWS Lambda pricing model, how it works, what additional charges you might be looking at and what’s in the fine print. Money makes the wold go round. Unfortunately, it is a necessity in almost all spheres of life. You can live without it or with lesser amounts of it, but it makes it all harder. If you wish to have it, first, you need to give it, as always. Even AWS Lambda is not free.
Getting Started with Go and InfluxDB
Conventional databases such as PostgreSQL or MongoDB are great at safekeeping the state of your system in a tabular or document format, but what about time-dependent data: systems metrics, IoT device measurement or application state change? For those things, you need a more suitable type of database, one designed to manage better semi-structured data with a time characteristic.
7 Things to Check Before Launching a Website
Launching a website is a process that takes numerous essential steps. As the launch date comes closer, the excitement might lead to an oversight here and there. You can prevent this by deploying patience and double-checking every part of your website before it goes live. It all comes down to the type of website you're planning to launch. The more features you're planning to have, the longer the pre-launch inspection is going to take.
NECA delivers 99.9% system uptime using Applications Manager
NECA is an allied association of local telecommunications providers in the United States that was instituted by the Federal Communications Commission. It aims to provide rural consumers across the country with telecommunications and broadband services at affordable prices. Its services also include economic forecasting, trend analysis, industry database management, and rate and tariff analysis.
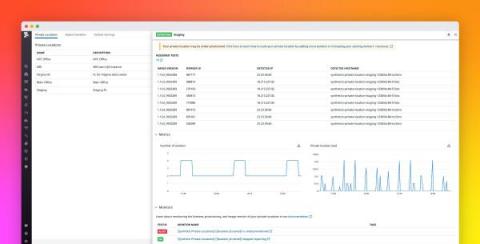
Monitor your Synthetic private locations with Datadog
Datadog Synthetic private locations play a key role in your organization’s test infrastructure by serving as highly customizable points of presence (e.g., data centers, geographic locations) for running synthetic tests on internal services. You can deploy private locations using the orchestrator of your choice, enabling you to seamlessly roll them out and scale them with the rest of your container fleet.
Logz.io Unveils Enhancements to Observability Platform at ScaleUP 2021
Monitor Confluent Cloud with Datadog
Confluent Cloud is a fully managed, cloud-hosted streaming data service. Enterprise customers use Confluent Cloud for real-time event streaming within cloud-scale applications. We’re excited to announce a new integration between Datadog and Confluent Cloud, which enables users to get deep visibility into their Confluent Cloud environment with just a few clicks. In this post, we’ll introduce how to set up the integration and start monitoring key metrics from your clusters.
New R2i MSP Monitoring Agent
Obkio announces a new Monitoring Agent operated by R2i, a leading Canadian provider of Cloud Computing Managed Services, Data Centre Solutions and Artificial Intelligence solutions. Learn how R2i’s new Obkio Monitoring Agent will allow them to offer their customers a complete network and cloud monitoring solution for fast support.
Log Management Guide: Why You Should Track Logs?
IT experts agree that log management and monitoring is one of the most effective ways to keep IT infrastructure performing optimally. Logs play a vital role in improving performance, enhancing security, and detecting issues. But at the same time, a lot of people don’t use logs to the best of their ability. This guide will not only introduce you to log management but also reveal which logs to track and what information they are giving to you.
Windows Event Log Best Practices for Operations Teams
Development Environment Observability with Sentry
At Sentry, we’re always looking for innovative ways to dogfood our product. Over the last year we added Sentry’s error monitoring to our developer environment so that we could better understand the health of it. In this blog post I’m going to touch on how fragile local development environments can be, how we brought observability into what’s happening by introducing Sentry, and what outcomes it has driven for our engineering organization.
Challenges maintaining Prometheus LTS
In this article, we’ll cover the three main challenges you may face when maintaining your own Prometheus LTS solution. In the beginning, Prometheus claimed that it wasn’t a long-term metrics storage, the expected outcome was that somebody would eventually create that long-term storage (LTS) for Prometheus metrics. Currently, there are several open-source projects to provide long-term storage (Prometheus LTS). These community projects are ahead of the rest: Cortex, Thanos, and M3.
Introducing Logz.io Event Management: Accelerating Collaborative Threat Response
In the domain of cyber threat response, there’s a critical resource that every organization is desperately seeking to maximize: time. It’s not like today’s DevOps teams aren’t already ruthlessly focused on optimizing their work to unlock the greater potential of their human talent. Ensuring your organization to identify and address production issues faster – and increase focus on innovation – is the primary reason why Logz.io and its observability platform exist.
How to Measure Packet Loss | Obkio
Dashboard Fridays: Sample Symantec Endpoint Protection (SEP) Dashboard
Video: The new simple, scalable deployment for Grafana Loki and Grafana Enterprise Logs
With the recent release of Loki 2.4 and Grafana Enterprise Logs 1.2, we’re excited to introduce a new deployment architecture. Previously, if you wanted to scale a Loki installation, your options were: 1) run multiple instances of a single binary (not recommended!), or 2) run Loki as microservices. The first option was easy, but it led to brittle environments where a heavy query load could take down data ingestion and problems were often difficult to debug.
Simple, scalable deployment for Grafana Loki and Grafana Enterprise Logs
Streamline Issue Management and Communication at Scale: Power Home Remodeling and Sentry
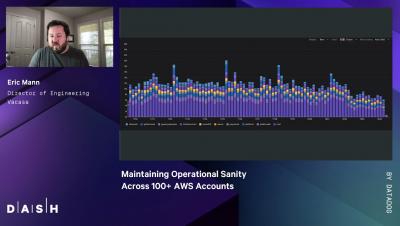
Maintaining Operational Sanity Across 100+ AWS Accounts | Eric Mann / Ryan Tomac (Vacasa)
What is AIOps?
AIOps is an approach to managing the exponential growth of IT operations and the complexity of new technology through the application of artificial intelligence (AI). IT infrastructure increasingly relies on complicated deployments, multi-cloud architectures, and huge amounts of data. Traditionally, the tech industry responds to complexity by applying extra brainpower to the problem, bringing in more engineers, developers, and management.
Istio Log Analysis Guide
Istio has quickly become a cornerstone of most Kubernetes clusters. As your container orchestration platform scales, Istio embeds functionality into the fabric of your cluster that makes monitoring, observability, and flexibility much more straightforward. However, it leaves us with our next question – how do we monitor Istio? This Istio log analysis guide will help you get to the bottom of what your Istio platform is doing.
Detailed Insight, Right on Time: Introducing Scheduled Alerts
Logz.io customers, here’s some big product news that we think you’ll be excited to hear. Scheduled Alerts, an altogether new manner of alerting, is coming your way. That’s right, get ready to utilize a whole new world of alerts that weren’t previously available in the Logz.io platform.
How to Restore Databases From Native SQL Server Backups
Reverse Connect for Azure Virtual Desktops (AVD)
There’s something common between AVD and eG Enterprise. Can you take a wild guess? Listening on open TCP ports is an extremely bad practice for cloud architectures, as it exposes products and services to accepting incoming messages from malicious parties. This is something eG Innovations avoids in our own products (see details). This is also a best practice adopted by Microsoft for Azure Virtual Desktops (AVD).
Incident Review - Google Cloud Outage has Widespread Downstream Impact
Outages on the Internet always catch you by surprise, whether you are the end user or the Head of SRE or DevOps trying to keep a clear mind while you execute your incident playbook. As people in charge of ensuring reliable services for our customers, our normal experience of outages involves surfing a deluge of fire alarms and video calls as we work to solve the problem as quickly as we can. We often forget, therefore, what an outage means to the end user.
Releasing Icinga DB v1.0-RC2
We are super excited to release the second Release Candidate of Icinga DB! This release comes after many hours, days and months of experimenting, re-thinking and rebuilding our own code and marks a huge step towards a new data backend for Icinga.
Ask Miss O11y: Mapping Out Your Observability Journey
Dear Trapped, Thanks for asking the question! Approaching observability as an all-or-nothing problem often leads to the project feeling daunting. But that’s not specific to observability—any project can be overwhelming if you think it needs to be done all at once, perfectly. Such as, erm, writing an entire book on observability! *looks around worriedly*
Tutorial: Build Serverless functions with C#
The world of cloud computing has been revolutionized by a solution called serverless computing. It has been an absolute joy for developers to use. Before this innovation, developers had to worry about the resources powering their code. Since the launch of serverless computing, the developer’s focus on operating-system and hardware architecture is now a thing of the past. It handles all the server management while focusing on what you do well — writing good quality code.
The Leading Datadog Alternatives
Datadog is one of the most highly rated tools for network monitoring, application performance monitoring & log analysis. The platform is highly rated by engineers for its wide range of useful features, high integrability and support of both custom configurations and reporting dashboards.
How Not to Break Your Network With Updates
Extend your DevOps analysis to CircleCI and GitLab data
Managing the Mess of Modern IT: Log Analytics and Operations Engineering
Notebook Sharing
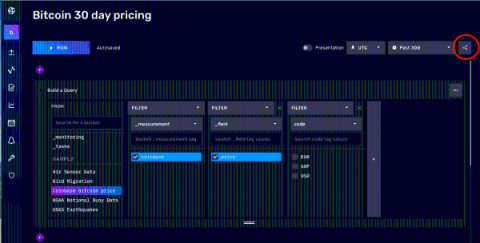
It’s that season of sharing, and in the spirit of sharing, we have a new feature to share with you — notebook sharing. Now you can take your favorite InfluxDB notebooks and share them with whoever you would like. They don’t need to have an InfluxDB Cloud account. They just click on the link you share with them, and they can see the notebook that you shared, for the time range that you selected.
WFA: Visible - Global Summary Dashboard
WFA: Visible - Digital Experience Index (DXI) Dashboard
Top 5 ways OpManager helps streamline network performance by monitoring Windows processes
Forty percent of enterprises say an hourly network outage costs up to $1 million. Evidently, one minor overlook in monitoring the performance and availability of a network can result in costly downtime. This is why firms that heavily rely on network operations should perform dynamic network monitoring to keep their network protected from unexpected downtime.
Monitor Mobile Vitals with Datadog
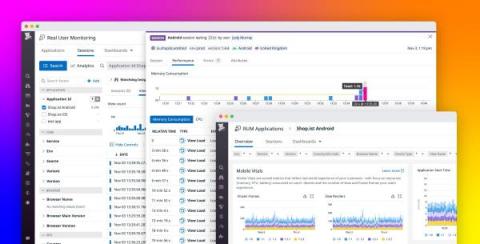
After you release an Android application, you need to ensure a smooth, engaging experience for users. Poor performance and heavy resource consumption can cause your application to rank lower for prospective users in the Google Play Store, and existing users can become frustrated and even uninstall your application. All of this can spell trouble for business-related performance indicators like engagement and discoverability.
Black Friday: How Retailers Can Create an Optimal Online Experience
Enterprises Just Got an Integration Infrastructure Management (i2M) Upgrade, Intelligence from Their Integration
November 2021 is a good month if you’re a Fortune 500 or Global 2000 enterprise. The investments your organization has made in “integration” over the years were necessary as the organization and the IT infrastructure grew, but the Integration Infrastructure (i2) has likely been considered a necessary evil by senior management. That investment can now be leveraged in two important, new ways.
5 lessons from the October 2021 Facebook outage
On October 4, 2021, Facebook services went off the grid gradually, and then suddenly at 15:39 UTC. It took nearly six hours to restore service to normal. With over 3.5 billion users facing a lengthy downtime using one or multiple products from Facebook, Inc. (now known as Meta Platforms, Inc.) conversations flooded the internet about what caused the downtime issues on the American social networking service.
Logz.io Anomaly Detection: Shedding Light on "Unknown Unknowns"
Moving beyond traditional monitoring to embrace full stack observability offers a seemingly endless range of benefits. Beyond unifying logs, metrics, and traces in a single platform, the opportunity to enlist advanced analytics and engage a more predictive approach represents another huge step forward.
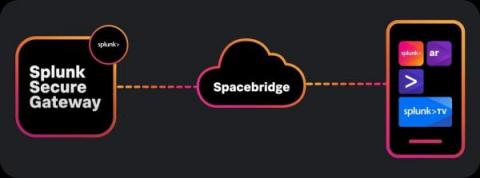
Splunk Mobile & TV - Dashboard Studio in 60s
Best Practices for Cloud Monitoring
Introducing the AWS CloudWatch integration, Grafana Cloud's first fully managed integration
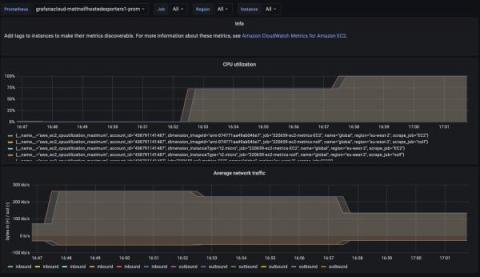
At Grafana Labs, we are continuing to build integrations that make it easier than ever to observe your systems, no matter which tools or software you choose. Today, we’re excited to talk about the latest integration available in Grafana Cloud: the AWS CloudWatch metrics integration, the first of our fully managed integrations that makes it simple to connect and visualize your data in Grafana.
AMA Responses: Icinga for Windows
00:10 Will there be any further Windows development in Icinga 2 except for the Windows agent part?
01:10 Are the Windows plugins considered to be deprecated?
02:12 Is it possible to only have the Icinga agent and the plugins without having the whole Icinga for Windows framework?
03:38 Are there plans to provide the PowerShell plugins as standalone, so one can use the plugins without the framework stuff?
Announcing Service Performance Monitoring in Early Access
Today, we’re thrilled to announce the early access of our Service Performance Monitoring capability. As today’s DevOps teams know all too well, monitoring application requests in modern microservices architectures is extremely difficult. Requests typically travel across a vast ecosystem of microservices and, as a result, it is often a significant challenge to pinpoint a specific failure in one of these underlying services.
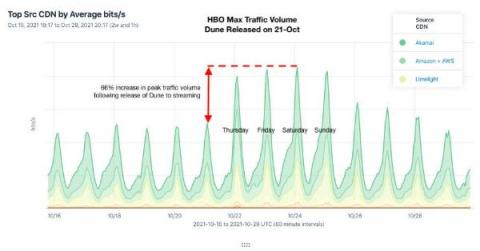
Anatomy of an OTT traffic surge: Dune release on HBO Max
Last month, the long-awaited film adaptation of Frank Herbert’s sci-fi epic Dune was released in theaters and on HBO Max. Directed by Canadian filmmaker Denis Villeneuve, the movie was a hit at the box office as well as via streaming, leading to another OTT traffic surge.
Gain real-time, end-to-end visibility across your containers with the AppDynamics Prometheus Extension
Gain full-stack observability across your containerized applications and services with AppDynamics and Amazon Managed Service for Prometheus (AMP).
Papertrail and Heroku
User-scoped API Keys
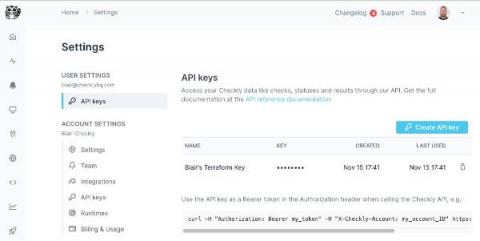
Checkly has released a change to the way API keys are created and managed. In the past, API keys were account-scoped. These account-scoped keys have full access rights to your Checkly account and no accountability to which user is using the key. When we originally built Checkly, we made it a tool to enable individual developers to quickly and easily set up browser and API checks. We help ensure your web applications are up and running and send alerts when something goes wrong.
5 Criteria You Need to Drive Efficient Alarm Management
As a commercial pilot landing at night on an unfamiliar runway, the last thing you want is a cockpit alarm telling you the passenger in 14A wants more ice in their soda. You need to concentrate on the job at hand. At that critical moment in flight, you only want visibility into the alarms that matter. It’s the same with your monitoring environment. Too often, you can be overwhelmed by a tsunami of alarms—thousands of monitoring alerts that all point to the same problem.
Get Started with Connected Experiences
November, the season of post-conf, is upon us. Hopefully all you Splunk admins and sc_admins are craving the release of a ton of new.conf21 Splunk features. Well, good news, because Connected Experiences is here to help you get started with everything Splunk Mobile, Augmented Reality, TV and iPad with this one handy guide. Let’s get started!
Splunk Developer Fall 2021 Update
While it’s cooling down here in California as Fall arrives, we have some really hot and exciting updates from.conf21, including the announcement of Splunk Cloud Developer Edition, the new Splunkbase user experience, detailed guidelines to help you deliver cloud-ready apps for Splunk Cloud Platform, AppInspect updates with new checks, a helpful blog about storing app secrets, updated docs for Modular Inputs and External Lookups, a summary of SDK updates, and more.
23 Minutes Lost: The Real Consequences of Digital Workplace Distractions
We’ve all been there: you’re dialed-in to a specific task, hyper-focused on completing it… and then some minor distraction pulls you away. An email notification chimes, a coworker asks you a simple question, an angry driver wails on his horn outside your window – and when you return to the task at hand, you realize that tunnel-vision focus you just had is now lost.
Monitoring Your Smart Home with InfluxDB and IFTTT
Do you have a bunch of smart home devices, such as IoT devices like smart switches, cameras, doorbells, alarm systems or appliances? Have you ever wanted to monitor and send events from those devices to InfluxDB? And wouldn’t it be amazing if you could do that with zero coding? With IFTTT Webhooks, you can! Let’s dive in.
Why you should have a website monitoring tool ready for Black Friday
It’s that time of year again – no, not Christmas, but the hugely anticipated Black Friday. When discounts hit bigger numbers than the lottery, and customers get into a bargain-hunting frenzy. But it’s not all fun and games as a company owner during the biggest sales season of the year; unfortunately, you’re more likely to suffer website issues than on an average day.
Understanding business and security risk
Even if an organization has developed a governance team, aligning integration decisions with business needs must be incorporated into the zero trust architecture. The company’s business model drives the applications chosen. The senior leadership team needs someone who can translate technology risks and apply them to business risks. For example, security might be an organization’s differentiator.
Percepio Brings Big Debugging Boost for Microsoft Azure RTOS ThreadX Developers
Percepio®, a leader in visual trace diagnostics for embedded systems and the Internet of Things (IoT), today announced improved support for Microsoft Azure and Azure RTOS ThreadX in Tracealyzer, two enhancements that will ease the development and debugging of Azure IoT systems.
Exoprise Announces Consecutive Quarters of Accelerating Double-Digit Growth
A network admin's guide to network diagram software
For organizations growing larger by the day, network management becomes increasingly complex, and scaling to meet this growth can be a major headache. To battle such complexity without a graphic representation of a network is a tiresome task, which is where network diagram software comes in. Network diagram software allows a network admin to portray the network clearly and legibly through detailed graphics.
SolarWinds Expands International Leadership Team in EMEA Market
Get better RUM data with our custom React components
Since its release in 2013, React.js has become one of the most popular solutions for building dynamic, highly interactive web app frontends. React’s declarative nature and component-based architecture make it easier to build and maintain single-page applications.
Deploying your first Serverless REST API within minutes
Monitoring Without Limits - Circonus' Series B led by Baird Capital
This is my fifth company as CEO and I’ve really come to enjoy working in B2B enterprise software – the proverbial “picks and shovels” end of our industry. In particular I enjoy innovating in spaces that may not be immediately obvious and typically overlooked in the mad gold rush of today’s frothy venture capital scene.
Why we created a Prometheus Agent mode from the Grafana Agent
On 2021-10-29, initial support for Prometheus Agent was merged, and it is slated for inclusion in Prometheus v2.32! This feature has a bit of a lengthy history to it: It took a little while to get to where we are today, but I’m thrilled that we were able to use the Grafana Agent code to enable agent-like functionality in the prometheus/prometheus repository.
Windows logevent and regexp modules
Measure, Track, Improve: Streamlined event exploration and increased visibility into team health
For many engineering leaders, measuring their team’s impact can be hard to quantify and a face:palm process, filled with searching through logs and exporting data sets to cobble together a report that most people won’t even look at twice. And let’s be honest, if you wanted to spend time making reports, you wouldn’t have become a developer.
DoD-Worthy Interoperability & Cybersecurity Standards: What Does It Mean to Our Customers?
This is the third in a series of four ScienceLogic blogs on the topic of the Department of Defense Information Network (DoDIN), including what it is, what it means to be approved under DoDIN standards, why it is important to both our federal and private industry customers, and the process for being approved for listing.
Announcing Logz.io Unified Dashboards
In today’s cloud environments, a typical observability stack might include an Elasticsearch cluster for logging, a few Prometheus servers for metrics monitoring, and an AppDynamics deployment for APM. You may run something similar – most observability stacks consist of multiple siloed tools dedicated to collecting and analyzing specific types of monitoring data.
How to Ensure Microsoft Teams Performance when Employees are Returning to their Workplace - Use Case
Let the Orion Platform Do the Heavy Lifting | Orion Platform Automation Made Easy: Session 1
ScaleUP 2021: Taking the Logz.io Observability Platform to the Next Level
Today was a very exciting day for Logz.io, as we held ScaleUP 2021 – our second annual user conference – dedicated to elevating our customers’ success, discussing best practices for modern observability, and unveiling Logz.io’s latest product updates. These product advancements were presented by our Co-Founder and VP of Product Asaf Yigal, and members of the Logz.io software engineering team.
4 Best Tools to Measure and Reduce Network Latency
Risky Business: Implementing a Redundant Networking and Multi-CDN Monitoring Strategy
Last month, we partnered with AWS to put together a webinar on the importance of implementing a comprehensive redundant networking and multi-CDN monitoring strategy. You can replay the event in full here. In this article, we’ll recap the key takeaways covered by the panel of experts who included Leo Vasiliou, Director of Product Marketing at Catchpoint, and Steve Campbell, our Chief Strategy Officer.
Remote Server Management Guide: What Is It and How It Works
Remote server management is a proven strategy used for increasing the uptime and responsiveness of your IT infrastructure. It manages the performance, health, and utilization of remote servers or back-end systems on various networks. After reading this post, you’ll understand what remote server management is, how it works, and how to implement it.
DevOps State of Mind Podcast Episode 1: Trust, tooling, and a no-blame culture with LogDNA
Tucker Callaway is the CEO of LogDNA. He has more than 20 years of experience in enterprise software with an emphasis on developer and DevOps tools. Tucker fosters a DevOps culture at LogDNA by tying technical projects to business outcomes, practicing extreme transparency, and empowering every person in the company to contribute.
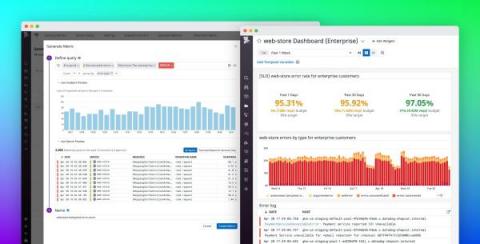
Generate span-based metrics to track historical trends in application performance
Tracing has become essential for monitoring today’s increasingly distributed architectures. But complex production applications produce an extremely high volume of traces, which are prohibitively expensive to store and nearly impossible to sift through in time-sensitive situations. Most traditional tracing solutions address these operational challenges by making sampling decisions before a request even begins its path through your system (i.e., head-based sampling).
Get planet-scale monitoring with Managed Service for Prometheus
Prometheus, the de facto standard for Kubernetes monitoring, works well for many basic deployments, but managing Prometheus infrastructure can become challenging at scale. As Kubernetes deployments continue to play a bigger role in enterprise IT, scaling Prometheus for a large number of metrics across a global footprint has become a pressing need for many organizations.
Logz.io Moves to Embrace OpenSearch at the Core of its Platform
As Logz.io prepares to hold its annual ScaleUP user conference tomorrow, celebrating another amazing year of customer success and continued advancement of our observability platform, we’ve got exciting news to share about our involvement with the OpenSearch project.
How the San Francisco Giants Knocked IT... to the Cloud
Real Time eCommerce Analytics: The Only Solution for the Holiday Season
Digital trade and eCommerce companies are generating transactions in more significant quantities than ever before. In 2020, eCommerce sales made up 19% of all worldwide retail transactions, representing $26.7 trillion in revenue. The cornerstone of any eCommerce company is providing a seamless, reliable experience where customers can log into a clean interface, browse products, and make purchases quickly and on-demand. Increased digitization after the pandemic has only heightened the stakes.
How to Measure and Improve Your Serverless Application's Health
This article will cover how the health of your serverless application can be measured and improved. Technology and its implementation methodology evolve with time very rapidly. Cost efficiency and productivity are the key drivers of technological evolution these days. With the advent of the cloud, infrastructure costs have been brought down significantly. Serverless technology adds icing to the cake!
11 Reasons Why You Should Migrate to Next-Generation DX APM
The current version of DX APM continues a long history of innovation for APM technology. More than two decades ago, the solution was the pioneer in byte code instrumentation. DX APM is now a next-generation solution for today’s complex and hybrid enterprise environments. Figure 1: Broadcom’s DX APM has evolved from Wily Technology’s invention of byte code instrumentation-based APM, which was introduced in 1998.
Introducing DX Unified Infrastructure Management
Today, we are launching the newest feature of Broadcom’s Enterprise Software Academy: DX Unified Infrastructure Management (DX UIM) resource pages. DX UIM is redefining infrastructure management with full-stack observability, an open architecture, modern admin and operator consoles, and zero-touch configuration.
Do it Yourself: Generic REST API-Based Monitoring
DX Unified Infrastructure Management (DX UIM) has more than 150 monitoring probes, which enables IT administrators to monitor everything from traditional mainframe servers to modern hybrid clouds running on a wide range of platforms and operating systems. Traditionally, a separate probe has been required to monitor each specific technology. That’s because the interface that retrieved monitoring metrics was either proprietary or technology specific.
Monitoring Cohesity with DX Unified Infrastructure Management
The Cohesity Data Platform consolidates backups, file shares, object stores, and data on a single web-scale data management platform. As a result, this platform helps reduce data sprawl and mass data fragmentation. The Cohesity platform allows teams to make their backup and unstructured data more productive for a range of efforts, including rapid app development, compliance, security, and analytics.
Full-Stack Infrastructure Observability with DX Unified Infrastructure Management
The IT infrastructure landscape has seen tremendous changes over last few years due to evolving technologies, newer business models, and ever-changing market demands. Business, market, and consumer demands are pushing such IT advancements as cloud, mobility, and IoT.
How Using Annotations with OpenTelemetry Can Lower Your MTTR
When it comes to gaining control over complex distributed systems, there are many indicators of performance that we must understand. One of the secrets to understanding complicated systems is the use of additional cardinality within our metrics, which provides further information about our distributed systems’ overall health and performance. Developers rely on the telemetry captured from these distributed workloads to determine what really went wrong and place it in context.
The Importance of Application Performance Monitoring.
In this digital era, applications are used on a daily basis to make our life easier. A lot of software applications are launched every day, continuously increasing competition in the market. There are thousands of applications available for a task. But, the success of any application highly depends on its performance. A good-performing application provides a flawless user experience to the customers.
Nastel Releases i2-aware AIOps, Analytics & Tracking Platform for Complex Enterprises
Digitalization Challenge the future with Pandora FMS
Dashboard Fridays: Sample UptimeRobot Dashboard
Endpoint Troubleshooting
Monitoring & Observability for Sales, Marketing and Business ops teams with StackMoxie and PagerDuty
How to set up Stanza as the log agent for your GCP?
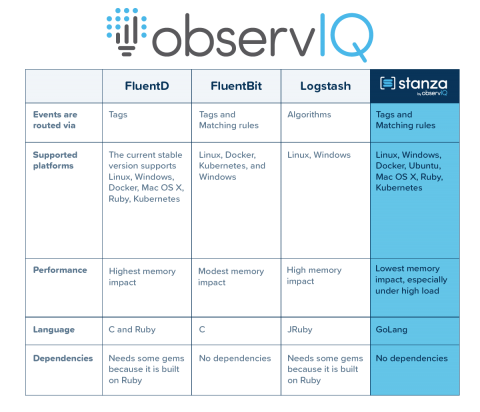
Stanza is a robust log agent. GCP users can use Stanza for ingesting large volumes of log data. Before we dive into the configuration steps, here’s a matrix detailing the functional differences between all the common log agents used by GCP users. Stanza was built as a modernized version of FluentD, Fluentbit, and Logstash. GCP users now have the ability to install Stanza to their VMs/ GKE clusters to ingest logs and route them to GCP log explorer.
Implementing SLAs, SLIs, and SLOs in an observability suite
#AlwaysAvailable with OpsRamp and SiliconANGLE
Ask Miss O11y: I Don't Want to Be On Call Anymore. Am I a Monster?
First, I’d like to say that pager duty isn’t something we should treat like chronic pain or diabetes, where you just constantly manage symptoms and tend to flare-ups day and night. Being paged out of hours is as serious as a fucking heart attack. It should be RARE and taken SERIOUSLY. Resources should be mustered, product cycles should be reassigned, until the problem is fixed.
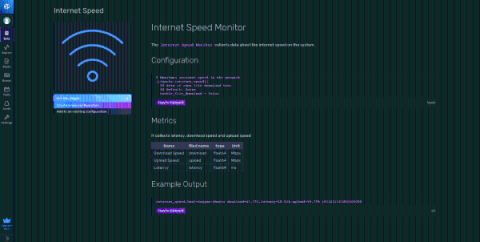
How to Monitor Your Internet Speed with Telegraf & InfluxDB Cloud
Complaining about your crappy internet speed is a tale as old as time. Given the rapid shift for so many of us to work from home, our internet speed now affects us on a daily basis. Where in my house should I avoid taking Zoom meetings because of low download speed? Does my internet speed actually get worse in the evenings, or am I just paranoid? How far away from the microwave do I really need to be to ensure that my wifi isn’t impacted?
Why Google SSO is so important
We’ve all become more security conscious online with password protection being one of the biggest problems when it comes to potential malicious threats to our personal data. As we start using more and more websites and applications, the need to have unique passwords for each one becomes a goliath task.
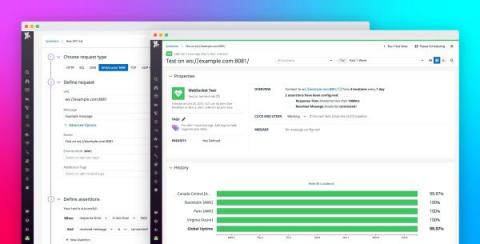
Run UDP and WebSocket API tests to monitor latency-critical applications
Datadog Synthetic Monitoring allows you to proactively monitor your applications so that you can detect, troubleshoot, and resolve any availability or performance issues before they impact your end users. With our API test suite, you can send simulated HTTP requests to your API endpoints, check the validity of SSL certificates, verify the performance and correctness of DNS resolutions, test TCP connections, and ping endpoints to detect server connectivity issues.
Infrastructure Integration Management (i2M) Drives Gains for Complex Enterprises
Seconds Matter: Why Monitoring Website Uptime Alone isn't Enough
It takes 50 milliseconds for visitors to decide whether to bounce from your website, that’s.05 seconds, or about half the time it takes you to blink. In website monitoring we talk a lot about uptime, and while making sure your site returns 200 OK is important, if your load time isn’t instant you’ll lose traffic regardless.
Stay Alert! Building the Coralogix-Nagios Connector
Ask any DevOps engineer, and they will tell you about all the alerts they enable so they can stay informed about their code. These alerts are the first line of defense in the fight for Perfect Uptime SLA. With every good solution out there, you can find plenty of methods for alerting and monitoring events in the code. Each method has its own reasons and logic for how it works and why it’s the best option. But what can you do when you need to connect two opposing methodologies? You innovate!
Sysdig & SUSE: Security & Visibility for SUSE Rancher
Securing a cloud-native environment, such as SUSE Rancher, requires unique considerations. New abstractions like containers, plus the dynamic nature of a Kubernetes orchestrated environment can hamper visibility, especially for legacy tools that aren’t designed for containers and cloud. To help, Sysdig and SUSE have launched a SUSE One Partner Solution Stack designed to not only showcase our joint solution, but also to provide easy ways for you to get started.
Observability into Your FinOps: Taking Distributed Tracing Beyond Monitoring
Distributed tracing has been growing in popularity as a primary tool for investigating performance issues in microservices systems. Our recent DevOps Pulse survey shows a 38% increase year-over-year in organizations’ tracing use. Furthermore, 64% of those respondents who are not yet using tracing indicated plans to adopt it in the next two years. However, many organizations have yet to realize just how much potential distributed tracing holds.
Proactive Business Line Support for Microsoft Teams PSTN Calls
With Microsoft Teams usage continuing to increase, it was only a matter of time until we also saw the rise of Teams voice through PSTN. Even though this requires more expensive Microsoft 365 licenses, the return on investment can be significant purely based on the pricing structure but sizable savings can be realized when it comes to management overhead costs. However, it can be a challenge to ensure PSTN call quality for all your business lines and users.
Help your business, learn everything about the log and event correlator
6 Rollbar Alternatives to Consider in 2021
Error-free apps are envied by all software teams today. But building and maintaining such an app is not as easy as it looks. You need to constantly keep a check on your app to see when it faces exceptions or errors. This is why we have so many error tracking tools in the current market. Rollbar is a popular error monitoring tool used for tracking and fixing all types of bugs and errors in modern applications. However, it has shortcomings too.
Observability - An Ultimate Guide
A developers perspective is different. While managing various sectors in a software, sometimes it would be difficult to monitor the activities and identify the bug that is disrupting the functions. What if you can spot the error beforehand, and resolve it at the earliest? The strategies that we focus on, and implement are the ones that help us effectively manage our tasks. That is possible by knowing about Observability. Let's learn in detail about it through this blog. TABLE OF CONTENTS.
OpsRamp at the AWS Startup Showcase
Prometheus Metrics setup with SigNoz
Logs and tracing: not just for production, local development too
We're a small team of engineers right now, but each engineer has experience working at companies who invested heavily in observability. While we can't afford months of time dedicated to our tooling, we want to come as close as possible to what we know is good, while running as little as we can- ideally buying, not building. Even with these constraints, we've been surprised at just how good we've managed to get our setup.
Incident Review - Rolling Comcast Outage Disrupts Work from Home for Millions of Users Across the U.S.
The rolling Comcast outage on Monday, November 8th and Tuesday, November 9th affected customers across the U.S., knocking users offline around the country. The first wave took place Monday evening in the San Francisco Bay area. The second, which had a wider geographic impact, occurred Tuesday morning, primarily affecting broad swathes of the Midwest, Southeast, and East Coast.
Serverless Observability: It's easier than you think!
Observability is a measure of how well the internal state of a system can be inferred from its external outputs. It helps us understand what is happening in our application and troubleshoot problems when they arise. It’s an essential part of running production workloads and providing a reliable service that attracts and retains satisfied customers.
Why and how to monitor AWS EKS
Website Performance Monitoring and Optimization Best Practices
Websites are a must-have for any business that wants to survive in a highly competitive environment. Many people mistakenly think that only e-commerce projects need a website, but this is not the case. Absolutely every company needs website performance monitoring and virtually every initiative should be armed with its own webpage. But this article is not about why you need a website, but about how to track and manage its performance.
InfluxDB and GeoData - Emergency Generators
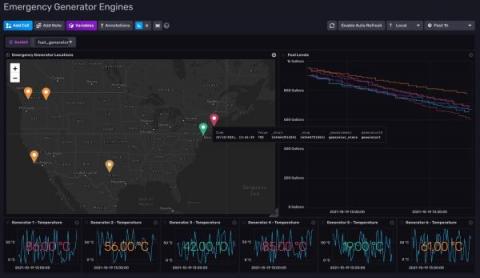
With the widespread use of LTE (Long Term Evolution), we are seeing more IoT devices come online in remote regions of our planet. Picture this scenario: A country is currently experiencing a national emergency due to an electrical grid failure. To mitigate the power shortage the government has deployed generators in the remote regions of their country to power the most remote villages. The problem? The villages are still reporting outages due to the emergency generators running out of fuel.
Discover VirtualMetric's Dashboard Playlists
Monitor Azure Government with Datadog
Azure Government is a dedicated cloud for public sector organizations that want to leverage Azure’s suite of services in their highly regulated environments. As these organizations migrate their applications to Azure Government, they need to ensure that they can maintain visibility into the status and health of their entire infrastructure.
Exoprise Digital Experience Monitoring Solution Featured in Redmond Magazine
Microsoft 365 Outage Detection, Crowd-Sourced Analytics, and Advanced Network Telemetry Differentiate the Exoprise Monitoring Solution.
An overview of key .NET 6 features
Building a unified analytics platform for ServiceDesk Plus, Desktop Central and OpManager
Micro Lesson: Basic Search Mode
Monitoring RabbitMQ with Bleemeo
This article will cover. how to configure RabbitMQ with Bleemeo to automatically collect metrics, and how to configure a dashboard to better understand your server and what's going on with Custom dashboards.
Synthetic Testing and Real User Monitoring
Loki 2.4 is easier to run with a new simplified deployment model
Loki 2.4 is here! It comes with a very long list of cool new features, but there are a couple things I really want to focus on here. Be sure to check out the full release notes and of course the upgrade guide to get all the latest info about upgrading Loki. Also check out our ObservabilityCON 2021 session Why Loki is easier to use and operate than ever before.
Grafana Tempo 1.2 released: New features make monitoring traces 2x more efficient
Grafana Tempo 1.2 has been released! Among other things, we are proud to present both our first version to support search and the most performant version of Tempo ever released. There are also some minor breaking changes so make sure to check those out below. If you want ALL the details you can always check out the v1.2 changelog, but if that’s too much, this post will cover all the big ticket items.
Enabling SRE best practices: new contextual traces in Cloud Logging
The need for relevant and contextual telemetry data to support online services has grown in the last decade as businesses undergo digital transformation. These data are typically the difference between proactively remediating application performance issues or costly service downtime. Distributed tracing is a key capability for improving application performance and reliability, as noted in SRE best practices.
The Impossible Dream: Easy-to-Use, Super Fast Software and Simple Implementation
OTel me about Observability
Network AF, Episode 5: Building relationships as an internet analyst with Doug Madory
Network AF welcomes Doug Madory to the podcast. Doug is a veteran, a researcher, a writer and Kentik’s director of internet analysis. With his start in the U.S. Air Force within its Information War Center, Doug has now been working in the networking industry for 12 years. After the Air Force, Doug went on to work for Renesys, which was acquired by Dyn, which was later acquired by Oracle.
Icinga Customer Story: Deutsche Telekom IT
We are proud of our many customers and users around the globe that trust Icinga for critical IT infrastructure monitoring. That´s why we’re now showcasing some of these enterprises with their Success stories. It´s stories from companies or organizations just like yours, of any size and different kinds of industries. Some of them are our long-standing customers, others have just recently profited from migrating from another solution to Icinga.
Epsagon-to-Lumigo: a step-by-step migration guide
At Lumigo. we believe in serverless technology, and our mission is to make serverless development easy and fast. For the past few months, we’ve been extending our observability and debugging capabilities, making it a breeze for developers to understand the end-to-end story of every request that goes through the system, find the root causes of issues and be able to easily address them.
What's New Pandora FMS 758
Let’s check out together the features and improvements related to the new Pandora FMS release: Pandora FMS 758. Remember this is an LTS version, we only have two of them a year, in April and November and they are stable.
Incident Resolution: Do You Remember, the Twenty Fires of September?
From September to early October, Honeycomb declared five public incidents. Internally, the whole month was part of a broader operational burden, where over 20 different issues interrupted normal work. A fraction of them had noticeable public impact, but most of the operational work was invisible. Because we’re all about helping everyone learn from our experiences, we decided to share the behind-the-scenes look of what happened.
Smarter IT Operations Through Actionable Insight
Business leaders talk excitedly about "digital transformation" and "innovative customer experience," but it falls on the shoulders of IT operations to make sure everything actually works. As transformation takes hold, IT teams manage increasingly complex, hybrid, and distributed environments – often comprising traditional on-premises systems and modern infrastructures made up of containers, multiple clouds, and virtualized networks.
Unlock Value from Your Data Anywhere: Connected Experiences .conf21 Highlights
Are you ready to unlock value from your Splunk data, anywhere at any time? You might be itching to do this after seeing the amazing announcements made by the Splunk Connected Experiences team at.conf21. For those that might have missed it — or those that are hoping to learn more — we’ve rounded up the highlights below. Across each of the products, the takeaway is clear: we’re continuing to make it easier than ever to access your Splunk data in new and innovative ways.
The Top 60 Log Management Tools
When it comes to comparing all of the best solutions for log management and analysis it can be incredibly difficult to compare key features and pricing per annum side by side to see what solutions you should consider trialling.
Cloud Infrastructure Without the Headaches
Cloud infrastructures have introduced increasing levels of complexity—you have to manage workloads across on-premises, private, and multiple public cloud environments. This requires you to migrate efficiently, optimize effectively, and stay rightsized on an ongoing basis, all while meeting evolving business requirements. With so many moving parts, it can be a massive challenge with lots of pitfalls that can cost you time and money and even put your business results in jeopardy.
TL;DR InfluxDB Tech Tips: API Invokable Scripts in InfluxDB Cloud
If you’re familiar with InfluxDB Cloud, then you’re probably familiar with Flux already. Flux enables you to transform your data in any way you need and write custom tasks, checks, and notification rules. But what you might not know is that InfluxDB Cloud now supports API Invokable Scripts in Flux.
What Is Server Monitoring?
Your IT infrastructure runs on servers, which makes them vital to the performance of your entire IT environment. therefore, it is essential to monitor your servers to ensure there isn’t any disruption in performance and uptime. Servers are devices or applications that can store, process and deploy resources to other devices, applications or users. Now that you know how important servers are to an IT environment, what happens if a server stops working?
Introducing Grafana Enterprise Traces, joining metrics and logs in the Grafana Enterprise Stack observability solution
Today, we are launching a new Grafana Labs product, Grafana Enterprise Traces. Powered by Grafana Tempo, our open source distributed tracing backend,.and built by the maintainers of the project, this offering is an exciting addition to our growing self-managed observability stack tailored for enterprises.
Announcing Grafana OnCall, the easiest way to do on-call management
A critical part of managing modern software development is setting up and running an on-call rotation. But that often involves significant toil, in part because many of the existing tools are cumbersome and not developer-friendly. That’s why we’re excited to announce Grafana OnCall, an easy-to-use on-call management tool that will help reduce toil in on-call management through simpler workflows and interfaces tailored for devs.
ObservabilityCON 2021: Your guide to the newest announcements from Grafana Labs
This morning during the ObservabilityCON keynote, we announced some of the exciting projects and feature enhancements we’ve been working on for our customers and community. And it doesn’t end there. Throughout the week, we’ll continue to unveil new features, go deeper with live demos, and share our plans to shape the future of observability. With so many new announcements and features to check out, we want to make sure you know where to get more details about these developments.
Goliath Technologies Announces Enhancements to Goliath Performance Monitor
Philadelphia – November 9, 2021 – Goliath Technologies, a leader in end-user experience monitoring and troubleshooting software for hybrid cloud environments, announced today the release of Goliath Performance Monitor 11.9.2. New features include a Citrix NetScaler Module and industry-only VMware Horizon End-User Experience Scorecard.
SL1 Duomo Release: Fueling Your Flight to AIOps with Workflow Automations
Introducing SL1 Duomo. Designed to turbocharge your digital transformation journey to business growth—with the final destination of automated operations.
New Relic vs. Sentry vs. Scout
In the digital economy, software applications have become a primary product for a large number of companies. On top of that, customers expect a flawless user experience from the applications as it evolves. To provide such a great experience, companies need to have powerful performance monitoring across their applications. We will discuss APM tools that are popular in the market right now and compare them in different aspects. Feel free to use these links to navigate the guide.
Limit Coralogix usage per account using Azure Functions
At Payoneer, we use Coralogix to collect logs from all our environments from QA to PROD. Each environment has its own account in Coralogix and thus its own limit. Coralogix price modules are calculated per account. We as a company have our budget per account and we know how much we pay per each one. In case you exceed the number of logs assigned per account you will pay for the “extra” logs. You can see the exact calculation in this link.
What's Wrong With Observability Pricing?
There’s something wrong with the pricing of observability services. Not just because it costs a lot – it certainly does – but also because it’s almost impossible to discern, in many cases, exactly how the costs are calculated. The service itself, the number of users, the number of sources, the analytics, the retention period, and extended data retention, and the engineers on staff who maintain the whole system are all relevant factors that feed into the final expense.
Building Relationships as an Internet Analyst With Doug Madory | Network AF Episode 5
Full-stack observability is within your grasp in the revamped Cisco Enterprise Agreement (EA)
With Cisco’s revamped Enterprise Agreement (EA) buying program, it’s easier than ever for your business to achieve full-stack observability.
Web Performance of the Top 50 E-commerce/Retail Sites in 2021
AWS Database Types - Aurora vs DynamoDB vs RDS - How do they compare?
In this blog, we describe the different types of AWS’ managed databases and their various features and merits. By the end of the blog, you should have better information to choose the right AWS database that would match your application’s needs.
How to choose between AWS RDS and EC2 Hosted Database?
You’ve decided to migrate your applications from on-premises to AWS and are considering what cloud services are available that suit your needs the best. When you are migrating an application that uses a relational database backend (RDBMS) such as Oracle, MySQL or SQL Server to the cloud, the question of RDS vs EC2 will inevitably surface.
Icinga for Windows Releasing v1.7.0 - Start your contribution
Today we are happy to announce, that Icinga for Windows v1.7.0 has been released! While this release includes lots of bugfixes for the Framework itself including the basic plugins, our main goal was to increase usability and make access for developers a lot easier.
Microsoft Office 365, Azure, and How to Use Them Together
Office 365 and Azure are two important cloud services with many features and functions. Although Microsoft mainly designed them to work separately, when used in combination, they offer an excellent way to increase efficiency in the workplace with minimal IT administration. This post will focus on the several ways organizations can benefit by using Office 365 and Azure together. It will also discuss critical considerations for administration, best practices, and pitfalls while using them together.
Network Management Services: An Intro Guide With Examples
Connectivity is more valuable to today’s businesses than ever. Partly, this is because many business-critical operations are happening online. Employees are connecting using collaborative software. Customers are seeking support and placing orders online. At the same time, suppliers and partners are transmitting data online. All their success depends on network capacity and reliability.
Game Launches Should Be Exciting for Your Players, Not for Your LiveOps Team
The moment of launching something new at a game studio (titles, experiences, features, subscriptions) is a blockbuster moment that hangs in the balance. The architecture—distributed and complex, designed by a multitude of teams, to be played across a variety of devices in every corner of the world—is about to meet a frenzy of audience anticipation, along with the sky-high expectations of players, executives, and investors.
Anodot Acquires Pileus to Transform the Cloud Cost Optimization Space
We couldn’t be more excited here at Anodot at the announcement of the acquisition of Pileus. Acquiring a company is a very special event, a moment that is the culmination of months of thought and deliberation. Is there a strong synergy between the two entities? Do we share the same DNA and culture? Is the additional product aligned with our long-term vision?
How Sumo Logic monitors unit economics to improve cloud cost-efficiency
Introducing Log Data Restoration on LogDNA
If you’re reading this, I’m pretty sure I don’t need to do much to convince you of the importance of logs. They are the core atomic unit for understanding your environments and provide the insights required to troubleshoot, debug, and more. The fact of the matter is that everyone in your organization needs logs to perform critical functions of their job.
NiCE Linux PowerPC Management Pack 1.20 released
The NiCE Linux PowerPC Management Pack 1.20 is an enterprise-ready Microsoft SCOM add-on for advanced IBM PowerPC on Linux monitoring. It supports Linux PowerPC administrators in centralized health and performance monitoring to improve user experience and business results. The Management Pack provides clear and precise performance indicators and timely alerts enriched by pinpointing problem identification and troubleshooting information.
SolarWinds to Attend ITSM Conferences SupportWorld Live and itSMF UK
SCOM 2022: What to expect and what you need to know
A Guide To Error & Uptime Monitoring In Laravel Using Honeybadger
Every application has errors. It's how you respond to them that makes the difference. In this article, Ashley Allen shows us how to use Honeybadger to make sure your Laravel apps are performing as they should.
7 Tips for Hyper-V Monitoring that Will Boost Your VM Performance
Hyper-V is one of the most popular virtualization software, especially for Windows systems and servers. However, no software or tool can be optimized to your advantage without proper monitoring. Now, you’re probably already monitoring your Hyper-V environments, but are you doing it the best way? This post will reveal seven important tips that can help reinforce your efforts to Hyper-V monitoring, especially cluster monitoring, which is a hard task.
Levelling up your Microsoft Managed Services
The 18 most popular data source plugins for Grafana in 2021
As a composable solution, Grafana allows you to bring your data into dashboards natively without having to extract it, load it, or transform it. We believe in a “big tent” philosophy, which allows you to choose the tools that best suit your observability strategy, and with our plugins, Grafana is interoperable with more than 100 data sources.
Catchpoint Guided Tours
New Apps for PagerDuty's Datadog Integration
Vue.JS Live 2021 Workshop: A Different Vue into Web Performance
React Advanced 2021 Workshop: "Building a Sentry: 7 years of open-source React"
What is Kubernetes Lens?
As a DevOps Engineer, one day you’re performing magic in the terminal, settling clusters, and feeling like a god. On some other days, you feel like a total fraud and scam. Errors and bugs appear from everywhere, you don’t know where to start, and you don’t know where to look. Sadly, days like this come far too often. To be more specific, what often causes these bad days is none other than Kubernetes itself.
A Comprehensive Guide Of Website Navigation: How You Can Improve Your Site?
Do you want to give your visitors excellent navigation so they can land on their desired page correctly? Easy navigation around a website is of the up-most importance when it comes to website performance. In this guide we will share a detailed guide for you to make organized website navigations on your site.
How to determine the source of SaaS latency
One of the positive things that came out of events in 2020 was that many of us started working from home. At first, it was kind of weird. But once we realized that what we needed was available online, it became easier. All we had to do was figure out a few new apps, like Slack, Asana and Google Docs. Then, after a couple of weeks of working from home, many of us started having thoughts like, “I wonder if I could wear shorts and my favorite slippers?
Proximity Bias is a Serious Concern for Young Workers - How Can You Avoid It?
We’ve all experienced a bit of FOMO at one time or another, whether we stayed home sick the night of a party or failed to score tickets to a big concert. It stings to miss out on the fun, but we get over it. In the era of remote work, however, ‘fear of missing out’ has taken on a more consequential meaning – one that is troubling the minds of many young professionals.
How to Optimize Your Cyber Security and Performance Monitoring Tools Using Load Balancing
The capacity to scale and process high data traffic by monitoring appliances is a critical requirement for organizations aiming to enhance or improve their security and protection from external threats. Excessive incoming traffic demands high-monitoring capabilities as it overwhelms the monitoring tools and places computational bounds that increase exponentially.
Observability in Practice
After years of helping developers monitor and debug their production systems, we couldn’t help but notice a pattern across many of them: they roughly know that metrics and traces should help them get the answers they need, but they are unfamiliar with how metrics and traces work, and how they fit into the bigger observability world. This post is an introduction to how we see observability in practice, and a loose roadmap for exploring observability concepts in the posts to come.
Seven Critical Capabilities to Look for in an AIOps Tool
In 2017, McAfee found that an average enterprise uses 464 custom applications. A large enterprise — a company with over 50,000 employees — uses 788 custom apps! The more applications you have, the more complex your application environment is. This means that you are more susceptible to outages. So, the tolerance for downtime is impossibly low. Mission-critical applications must be available at all times.
The Persistent Threat of Downtime in Banking and How to Solve it
At 8:54 pm on November 1, 2020, a customer of HDFC bank complained on Twitter that the bank’s services like internet banking and ATMs were down. More customers started raising similar issues over the next couple of hours, saying that UPI, credit card, and debit card transactions weren’t working either. Finally, at 11:55 pm, the bank confirmed that one of their data centers faced an outage. “Restoration shouldn’t take long,” they promised.
Strengthen Your Cloud Ops with Preventive Healing
The cloud is driving enterprise digital transformation. Gartner predicts that by 2026, public cloud spending will exceed 45% of all enterprise IT spending, a 2.5x growth from 2021. Enterprises globally are accelerating application modernization, embracing the cloud. This is giving rise to a few key trends. Software-as-a-Service (SaaS) adoption is on the rise. So, organizations are using applications whose implementation/infrastructure they have little or no control over.
LogStream Infrastructure Sizing
Monitoring network security with Aruba Clearpass, Grafana and Graphite
In this article, we will explore why it is imperative to constantly monitor network security metrics, what Aruba Clearpass is, and how it helps us manage network security. Then we will look at what Graphite and Grafana are and how to analyze metrics with their help. Finally, we will learn how MetricFire can make it easier for us to work with Graphite and Grafana.
Dashboard Fridays: Sample JIRA Health dashboard
Azure Thames Valley: A journey into DevOps
Prove User Behavior is Root Cause of Citrix Performance Issues
AWS CloudWatch Alarms - A Startup Guide
While more businesses are moving their apps to the cloud, they must also ensure that cloud-based services such as Amazon Web Services (AWS) and other resources remain available. So, how can you make sure these cloud services aren't turned off? You can accomplish this using a tool like Amazon CloudWatch, which monitors applications. What is AWS CloudWatch will be the subject of this article.
AMA Responses: Icinga Web and Modules
00:10 Why are there some issues and PRs that have not been looked at for some time?
01:34 Are there plans to increase the number of people working on the Director?
01:51 Why is there such a discrepancy between the HA functionality in Icinga 2 versus Icinga Web 2 and its modules? And will this improve in the future?
03:17 Will it be possible to tunnel module traffic with the Icinga traffic? Is something planned for managing for example x509 in a distributed setup?
3 Ways Ops Teams Benefit From LM Logs
Innovations in cloud network security
The eCommerce Holiday Calendar for DevOps
Seasonal spikes in consumer activity are expected, if not depended on, by online retailers throughout the calendar year. However, as shoppers rush to compete over door-buster deals and order holiday must-haves, web traffic escalates to levels standard resource allocation cannot easily sustain. This spike in traffic can lead to unresponsive checkouts, lost or abandoned carts, and slow-loading pages, ultimately resulting in thousands of dollars in lost revenue.
Updated ELK Stack Guide For 2022 (Installation, Tutorials & More)
The ELK Stack has millions of users globally due to its effectiveness for log management, SIEM, alerting, data analytics, e-commerce site search and data visualisation. In this extensive guide (updated for 2021) we cover all of the essential basics you need to know to get started with installing ELK, exploring its most popular use cases and the leading integrations you’ll want to start ingesting your logs and metrics data from.
AWS Fargate Monitoring
How do you perform AWS Fargate monitoring? Today, we’ll discuss the background of AWS Fargate and using Retrace to monitor your code. As companies evolve from a monolithic architecture to microservice architectures, some common challenges often surface that companies must address during the journey. In this post, we’ll discuss one of these challenges: observability and how to do it in AWS Fargate.
Mario vs. Steve: What Video Games Can Teach Us about Monitoring vs. Observability
Credit: Unsplash What is monitoring? What is observability? Monitoring shows you how a Kubernetes environment and all of its layers are operating. Observability, on the other hand, is a measure of how well internal states of a system can be inferred from knowledge of its external outputs.
We've been named a Customers' Choice for the third year in a row!
The market has spoken! ManageEngine has been named a Customers’ Choice in the 2021 Gartner Peer Insights ‘Voice of Customer’: Application Performance Monitoring report for the third time in a row. It’s an honor to be trusted and loved by customers all around the globe.
Datadog acquires Ozcode
At Datadog, we believe that having visibility into production is crucial to building better software, especially as modern environments become more and more complex. Bugs that occur in production are often difficult to reproduce locally, which leaves developers guessing about what went wrong. To solve this problem, teams need the same depth of visibility into their production environments as they do into their local environments.
Top key metrics for monitoring MySQL
Monitoring MySQL with Prometheus is easy to do thanks to the MySQL Prometheus Exporter. MySQL doesn’t need an introduction – it’s one of the most used relational databases in the world, and it’s also open-source! Being such a popular database means that the community behind it is also huge. So don’t worry: you won’t be alone.
Meet VirutalMetric Dashboard
A Look at the 10 Best Error Monitoring Tools in 2021
Due to the growing usage of online methods for almost everything globally, technology has become a part of our daily lives. Most people around the world are using mobile apps and websites. Most of the companies are already adopting brand-new tech stacks faster. They are trying hard to implement all the features and make their system robust and powerful. But it is not easy to make an application error-free. It is impossible to track all the issues, reproduce them, and fix them before shipping code.
Agent deployment on linux |Pandora FMS|
Moogsoft & Dynatrace
Corporate vs Remote SaaS Performance
Sensitive Data Management - Working With Sensitive Data in Regulated Industries
Icinga DB Housekeeping
We all know that the history data is important in monitoring. But this history data becomes obsolete over time and those records become garbage which would only fill up space. So it is important to remove obsolete history records to free up space. We call this process housekeeping. This needs to be performed periodically to cleanup the history records whenever they exceed their maximum age and become obsolete.
Observability vs. Monitoring
Observability vs monitoring, what is the difference? Monitoring is the what to observability’s why. Here we dig into the differences.
Eight Reasons Enterprise Automation is Vital to Cloud Strategy Success
The cloud and Electric Vehicles (EVs) have a lot in common. Both are modern, fast, and agile. Both are also in great demand. Every street seems to have an EV parked somewhere. It’s the same with the cloud, which is fast becoming the platform of choice to power enterprise applications. Whether it is public, private, or hybrid, the cloud offers flexibility, security, and low total cost of ownership.
Announcing New Splunk Infrastructure Monitoring Capabilities
This year at.conf21, we announced exciting new features in Splunk Infrastructure Monitoring, our real-time streaming metrics-based monitoring platform. Our innovations help SRE and cloud operations teams detect and resolve performance issues even more quickly and efficiently while maintaining enterprise-grade security and compliance posture. In this roundup blog, we cover, in detail, all the product features we unveiled at.conf21.
The Lights Never Go Out For Financial Services
Build a modern data compliance strategy with Datadog's Sensitive Data Scanner
Within distributed applications, data moves across many loosely connected endpoints, microservices, and teams, making it difficult to know when services are storing—or inadvertently leaking—sensitive data. This is especially true for governance, risk management, and compliance (GRC) or other security teams working for enterprises in highly regulated industries, such as healthcare, banking, insurance, and financial services.
Ecommerce monitoring strategy for Black Friday and Cyber Monday 2021
It’s nearly here. The annual mad rush at the wee hours of the morning. The stampede into retail stores to claim really deep discounts on the latest toys, electronics, and gadgets makes headline news every year. It begins the day after Thanksgiving and is usually two of the biggest shopping days of the year. Yes, we’re talking about Black Friday and Cyber Monday.
What can you learn from IoT with i2M - Part 3
In the last 2 installments (Part 1 & Part 2), we discussed the basics of IoT and an example of how the components can be connected and used to provide basic automation and alerting. These seemingly simple steps can build up to provide very advanced controls of all aspects of the physical world. The challenge can become managing situations that were not expected.
Top 5 Challenges of Monitoring Complex IT Infrastructures
When monitoring a large IT infrastructure, there are multiple aspects you need to keep under control. Doing things manually and relying on people to ensure the infrastructure reliability can be a wrong decision and mislead you when resolving issues or troubleshooting problems. All these complexities faced while managing a large ecosystem can seem hard to overcome, but in reality, they can be handled.
Best practices for Cloud Operations in the enterprise
NGINX Monitoring: Best Tools and Key Metrics You Should Know About
NGINX is a popular web server featuring a wide range of capabilities, including reverse proxy, mail proxy, HTTP cache, and load balancing. It offers TLS offloading and a health check of the backends and supports gRPC, WebSocket, and HTTP/2. In short, NGINX is a one-stop solution for most of your web server needs. When using NGINX, monitoring its metrics is crucial for tackling issues.
What are network monitoring tools?
Network monitoring tools gather and analyze network data to provide network administrators with information related to the status of network appliances, link saturation, the most active devices, the structure of network traffic or the sources of network problems and traffic anomalies.
Rollbar Pro Tips: Slack Best Practices
Rollbar Pro Tips: UUIDs
Crossed 5000+ GitHub stars, metrics generation from spans - SigNal 06
Evolving from Splunk IT Essentials to Predictive IT Management with Splunk IT Service Intelligence
How sparse histograms can improve efficiency, precision, and mergeability in Prometheus TSDB
Grafana Labs recently hosted its first company-wide hackathon, and we joined forces with Björn “Beorn” Rabenstein to bring sparse high-resolution histograms in Prometheus TSDB into a working prototype. The Prometheus TSDB has gained experimental support to store and retrieve these new sparse high-resolution histograms. At PromCon 2021, we presented our exciting, fresh-off-the-presses results from the ongoing project.
What's New in OpenTelemetry: Community, Distributions, and Roadmap
I am honored to be able to talk about Splunk’s investment and commitment to the OpenTelemetry project. I would like to take this opportunity to talk about the latest in the OpenTelemetry community, as well as the instrumentation and data collection distributions available from Splunk. Be sure to read through the whole post, as you will find some roadmap information too!
Who needs CMMC certification (Resource Guide for 2022)
If your company works with the US Department of Defense (DoD) as a contractor or subcontractor, you will need to prepare to meet CMMC requirements in order to successfully bid on and win contracts. This recent development has been a significant adjustment for small organisations who wish to work with or continue working with the DoD.
How to Get Started with JavaScript and InfluxDB
This article was written by Nicolas Bohorquez and was originally published in The New Stack. Scroll below for the author’s picture and bio. Telegraf is the preferred way to collect data for InfluxDB. Though in some use cases, client libraries are better, such as when parsing a stream of server-side events. In this tutorial, you’ll learn how to read a data stream, store it as a time series into InfluxDB and run queries over the data using InfluxDB’s JavaScript client library.
Docker: Run Telegraf as non-root
The Telegraf 1.20.3 release changed the official Telegraf DockerHub image to no longer run the Telegraf service as root. With this change, the Telegraf service runs with the least amount of privileges in the container to enhance security given the wide extensibility and array of plugins available in Telegraf.
A Study in Graylog's Versatility
Recently, I explored the case for Graylog as an outstanding means of aggregating the specialized training data needed to build a successful, customized artificial intelligence (AI) project. Well, that’s true, of course. My larger point, though, was that Graylog is a powerful and flexible solution applicable to a very broad range of use cases (of which AI development is just one).
Understanding why businesses require network topology software
It is crucial for network admins to fully understand their network topology. Even basic troubleshooting can be needlessly complicated without a network topology diagram which is vital for building and maintaining a network. A network topology diagram shows how the various components work together; it shows the devices, connections and pathways of a network visually so you can figure out how devices interact and communicate with one another.
Hybrid Multi-Cloud Demands Holistic Observability
As I said before, Speed is King. Business requirements for applications and architecture change all the time, driven by changes in customer needs, competition, and innovation and this only seems to be accelerating. Application developers must not be the blocker to business. We need business changes at the speed of life, not at the speed of software development.
Alerting has landed: Never miss another mission-critical issue again
Time is of the essence when identifying and resolving issues in your software. The longer it takes for a fix to be deployed, the greater the consequences for your customers. Visibility and speed are core to what makes Raygun powerful and is why today we're excited to continue this journey with our latest feature - Alerting.
Africa: DNS Provider Performance Checkup
In our last blog, we spotlighted the Oceania region and showed you how you can use DNSPerf and PerfOps to compare providers. Today, we’ll be focusing on Africa, the top providers there, and how you can use this data to make better DNS business decisions for your domain. This will give you greater insight into your current or potential provider’s performance. You should have the fastest, highest-quality DNS for regions you cater to most.
Introducing Log Observability for Microservices
Two popular deployment architectures exist in software: the out-of-favor monolithic architecture and the newly popular microservices architecture. Monolithic architectures were quite popular in the past, with almost all companies adopting them. As time went on, the drawbacks of these systems drove companies to rework entire systems to use microservices instead.
Live Demo with Q&A: Webinar recording
6 Bugsnag Alternatives to Consider in 2021
Modern customers demand that their applications are as seamless and error-free as possible. However, building such apps is a herculean task in itself. You need to constantly look out for incoming exceptions and warnings in your app in production. Effective error monitoring is key to resolving such issues before they are discovered by your users and cause a disruption in the quality of your services.
REST vs CRUD
Introducing Google Cloud Managed Service for Prometheus
Open Source for Better Observability
Monitoring cloud-native systems is hard. You’ve got highly distributed apps spanning tens and hundreds of nodes, services and instances. You’ve got additional layers and dimensions—not just bare metal and OS, but also node, pod, namespace, deployment version, Kubernetes’ control plane and more. To make things more interesting, any typical system these days uses many third-party frameworks, whether open source or cloud services.
Perfect Your Cloud's Deployment with Logz.io & AWS CloudFormation Public Registry
AWS CloudFormation is a service that enables you to create and provision AWS infrastructure deployments predictably and repeatedly. This helps you leverage AWS products such as EC2 instances, Amazon Elastic Block Store, Amazon SNS, Elastic Load Balancing, and Auto Scaling to build highly reliable, highly scalable, cost-effective applications in the cloud – without worrying about creating and configuring the underlying AWS infrastructure.
Introducing new integrations to make it easier to monitor Vault with Grafana
HashiCorp Vault is an increasingly popular multi-cloud security tool that allows users to authenticate and access different clouds, systems, and endpoints, and centrally store, access, and deploy secrets. At Grafana Labs, we’re always looking for ways to make it easy for our community to get started monitoring important parts of their systems. So we’re happy to share some new integrations that will help our users get the most out of Grafana + Vault.
8 Months of OnlineOrNot: From 7 Day MVP to Stable Product
September and October were relatively quiet, so I thought I would write a single article for both months. While I'd normally try to write at least one useful article per month for OnlineOrNot's audience (as well as an update on how the business is going), I wrote no articles, and no code, actually. Instead, I packed up my life in Sydney, Australia, escaped lockdown, and relocated to France with my wife, and just enjoyed living for a while.
Change Happens - Get Alerted
To give you enough notice to fix an issue before it escalates, we’re evolving our alerts and making them more proactive with Change and Crash Rate Alerts. So when your application experiences a change from the norm or a dip in crash-free sessions, Sentry will (smartly) alert you via Slack, Teams, PagerDuty, or old-fashioned email.
What can you learn from IoT with i2M - Part 2
In the first part, I outlined some of the terms associated with the delivery of IoT. Next, let’s look at how this gets complex. You will need to read the state of each sensor (through their appropriate API and through their appropriate vendor-supplied hub), create logic to determine what actions must be taken when certain conditions are met, and then deliver these as a workflow to each responder, and confirm through data collected from sensors that the requested change was implemented.
Elevate your call center experiences with AppDynamics in Cisco Unified Contact Center Enterprise (UCCE)
Full-stack observability has entered the call center world. Raise the experience bar with AppDynamics in Cisco Unified Contact Center Enterprise (UCCE).
How Data Types and Query Tuning Can Improve Application Performance
We raised $29 million in new funding. Here's what we're going to do with it
Today we are announcing an additional $29 million in funding to help Lumigo grow and provide the same powerful observability capabilities we brought to serverless to other cloud-native technologies, including containers and Kubernetes. Lumigo was founded by Aviad Mor and me a few years ago because we believed the world would be rapidly moving to cloud-native architectures and that these technologies are transformative. Our goal was to create the tools that help developers realize this vision.
What Is Observability in DevOps? A Practical Guide
Software development firms need to develop and deploy software solutions and changes quickly, safely, and as demanded by the client. DevOps can help! There’s a major subset of DevOps you can’t overlook: observability.
Office 365 Monitoring: An Introductory Guide
The cloud has transformed the IT world. It’s cost-efficient, scalable, secure, and provides many other benefits. According to techjury, 81% of organizations have at least one application running on the cloud. With such a high number of organizations using the cloud and more joining this list every day, the cloud has become an integral part of many organizations. Cloud typically provides three types of services.
How Secure Tenancy Keeps Your Secrets Secret
The best way to be sure that you keep a secret is not to know it in the first place. Managing secrets is a notoriously difficult engineering problem. Across our industry, secrets are stored in a bewildering variety of secure (and sometimes notoriously insecure) systems of varying complexity. Engineers are often trying to balance the least worst set of tradeoffs. At Honeycomb, we asked: What if we didn’t need to know your secrets to begin with?
New: Optimize Slow Queries with Enhanced Database Visibility in Splunk Observability
Databases have always been the backbone of applications – both web and enterprise. Now, more than ever before, you need to know not just overall statistics about your database, but you must identify how database performance interacts with the network, operating system, servers, configuration, and even third party dependencies.
Dashboard Studio: New Features Highlighted At .conf21
I am very excited that this year’s.conf21was the first.conf where we got to showcase Dashboard Studio, which has come built-in with every Splunk Enterprise and Splunk Cloud Platform release, since 8.2 and 8.1.2103, respectively. I am even more excited to share a packed list of new features in the 8.2.2109 release, which coincides with.conf21! This blog post will highlight a few capability areas we've been heavily focused on that will help you do even more with your dashboards.
Datadog Cloudsmith Integration
Cloudsmith is happy to announce an integration with Datadog to help our customers monitor their Cloudsmith account. Datadog is an observability service for cloud-scale apps, providing monitoring of servers, databases, tools, and services through a SaaS based data analytics platform. At Cloudsmith we are big fans of Datadog and use it to monitor and visualize how our system is performing across a range of services and tools.
The World After Covid-19: How Jobs, Bosses, & Firms May Improve
In 1993 the management guru Peter Drucker argued that “commuting to office work is obsolete.” As of last year, his vision hadn’t quite come true: nearly half of global companies in one survey still prohibited remote working. Then the pandemic hit. Suddenly millions of people started doing their jobs from home. Work will never be the same.
5 Sustainable IT Practices for Your SaaS Applications
With web browser-accessed applications reaching record levels, employees are now spending most of their productive work time inside a cavern of business web applications. These may be custom applications built by a company for specific business purposes, or commercial SaaS applications for important functions such as collaboration, workflow management, scheduling, communication, transactional business, single sign-on, development, service desk, CRM, HR, and others.
How to Parse JSON with Telegraf into InfluxDB Cloud
In Telegraf 1.19 we released a new JSON parser (json_v2). The original parser suffered from an inflexible configuration, and there were a handful of pretty common cases where data could not be parsed. While a lot of edge cases for parsing can be resolved using the Starlark processor, it is still a more advanced approach that requires writing scripts. We have made a lot of enhancements to the new JSON parser that can help you easily read in your JSON data into InfluxDB.
Wi-Fi monitor: 5 ways it helps you get wireless network management right
The increasing need for mobility has accelerated many organizations’ shift towards wireless networks, commonly known as Wi-Fi networks. The high bit rate and bandwidth offered by wireless networks enable a better networking experience than their wired counterparts. In an ideal network, once you set up your Wi-Fi components, your end users should be able to connect and access your network with ease.
6 Reasons You Need a Digital Experience Monitoring Strategy
A Digital Experience Monitoring (DEM) strategy unlocks the key to understanding how end-users interact with web and desktop applications. If you have landed at this post, perhaps you are looking for a Digital Experience Monitoring solution. Correct? But before that, let's take a step back in understanding why it's critical to invest in a DEM tool. To provide a better technology experience, operation teams need modern tools to monitor and collect remote worker application insights. And because of that, businesses are adapting their digital transformation strategy to grow, survive, and respond to disruptions caused by the pandemic.
Goliath Technologies Achieves Record First-Half 2021 Growth
Philadelphia, PA – November 1, 2021 – Goliath Technologies, a leader in end-user experience monitoring and troubleshooting software for hybrid cloud environments, announced today that they achieved record revenue and customer growth during the first half of 2021.
My goals as a newly elected OpenTelemetry Governance Committee member
I joined Grafana Labs as a software engineer in October to help build out a team focused on OpenTelemetry, and within a few weeks, I was promptly encouraged to run for a seat on the OpenTelemetry board. Every year, the OpenTelemetry community holds elections for a few seats on the Governance Committee board, which oversees the project at large. The results of this year’s elections are now available, and I am glad to share that I have been elected to serve on the board!
Department of Defense Information Network (DoDIN) Approved Products List (APL): What is it and Why it Matters
This is the second of a four-part security blog series covering why ScienceLogic is listed in the DoDIN APL catalog, what this means for monitoring critical IT infrastructure, and why APL certification is relevant for all organizations. Part two is about what the DoDIN APL is and why it matters to both government and non-government organizations.
Observable Web Applications
Splunk RUM troubleshoots customer-facing issues faster to deliver better user experiences
Activating Connected Experiences in 60s
New Integrations from Logz.io: November 2021
It’s been a busy couple of months at Logz.io. We’ve added new features, made critical updates, and added a slew of integrations. Those integrations run the gamut from observability and security services, to cloud tools and container orchestration. Let’s take a quick look at what’s new and what’s coming up at Logz.io.
Datadog on Building Responsive UX
Moogsoft and DataDog
Getting Started with ITSI Part 2
Getting Started with ITSI Part 1
What can you learn from IoT with i2M - Part 1
The Internet of Things (IoT) is a wonderful marketing term given to devices that are connected to the internet. Today everything from light switches, air conditioners to door locks have the option of being internet-connected. Now that multiple companies have created “tags” that you can add to anything from keys to cars and packages, anything can be tracked. Across the business, industry, and retail almost every physical component has the option of being internet-connected.
How Freshly is Scaling Business Metrics Observability with AI
Anodot recently took part in the 2021 Data Agility Day, an event dedicated to examining how organizations are extracting value from data. CEO and Co-Founder David Drai was joined by David Ashirov, VP of Data at Freshly, where he has worked to build a data stack that departments across the company could leverage to drive business. Ashirov is a senior executive with two decades of experience in data engineering, business intelligence, and marketing.
Why Use OpenTelemetry Processors to Change Collected Backend Data
When managing distributed environments, we find ourselves challenged with looking for different ways to understand performance better. Telemetry data is critical for solving such a challenge and helping DevOps and IT groups understand these systems’ behavior and performance. To get the most from telemetry data, it has to be captured and analyzed, then tagged to add relevant context, all while being sure to maintain the security and efficiency of user and business data.
More Clouds, More Tools, More Problems
Organizations need tools to manage their infrastructure, which today is expanding beyond the data center to include multiple public clouds. In fact, in a recent survey of hybrid cloud decision makers, we found that the vast majority of respondents (88%) have placed more than one-quarter of their workloads in the public cloud, and 44% indicated that they’re running more than half of their workloads in the public cloud.
Time Zones in Flux
As a language for processing time series data, Flux has an important role in how we understand that data. As we create and process data, we do it for ourselves and others. The concept of time and how we as people interact with time isn’t always simple.


