Apica Announces New Platform Name and Features to Help Organizations Look Toward a Web 3.0 World
Apica Ascent Platform Reduces Friction for Enterprises that Need to Consume Data Anytime and Anywhere.


Microsoft 365 services help companies worldwide improve business and revenue by providing best in class digital workspace experience. The NiCE Active 365 Management Pack complements this by advanced M365 monitoring such as full Teams Call analysis integrated into Microsoft SCOM. Advanced monitoring and analytics help you reveal unwanted micro-events influencing the health and performance of the system and its users.
Many organizations use Kubernetes to orchestrate their containerized applications. But because Kubernetes is complex, application developers may take some time to ramp up on the intricacies of monitoring a Kubernetes environment. This means that teams often need to create internal documentation and offer hands-on training to bridge the knowledge gap.
A wide variety of industrial processes rely on water, and before it can be used, it needs to be treated to remove dissolved substances. Minerals have to be filtered out so they don’t form scales on equipment as water is heated and cooled, and bacteria needs to be removed in cases involving human health. Ekopak is a Belgian company working to make water treatment more sustainable by using less water and energy where possible.
Application teams must understand what their customer experience is like. This is true not only from a general perspective (in terms of usability and responsiveness) but also on a day-to-day, minute-by-minute basis. In particular, when you work with distributed systems, errors are inevitable. Site traffic fluctuates throughout the day, and any one of a system’s dependencies could also encounter an issue at any time.
Machine learning has infiltrated the world of security tooling over the last five years. That’s part of a broader shift in the overall software market, where seemingly every product is claiming to have some level of machine learning. You almost have to if you want your product to be considered a modern software solution. This is particularly true in the security industry, where snake oil salesmen are very pervasive and vendors typically aren’t asked to vigorously defend their claims.
In Part 1 of this series, we talked about the origins of observability and why you need it. In this blog (Part 2), we will cover exactly what observability is, what it isn’t, and how to get started. Before we can dive into how to approach observability, let’s get one thing clear: You can’t buy a one-size-fits-all observability solution.
Service virtualization is not new. In fact, the concept and technology were established 20 years ago. At its core, service virtualization offers the ability to simulate behavior, data, and performance characteristics of applications and services. Through service virtualization, teams can ensure they have an on-demand environment to support their testing needs.
Redis is an open-sourced, BSD 3 licensed, highly efficient in-memory data store that can be easily used as a distributed, in-memory key-value store, cache, or message broker. It is known for being extremely fast, reliable, and supporting a wide variety of data structures, making it a very versatile tool widely adopted across the industry. Redis was architectured with speed in mind and is designed in a way that it keeps all the data in memory.
In this tutorial we’ll learn how to use Python to get time series data from the OpenWeatherMap API and convert it to a Pandas DataFrame. Next we’ll write that data to InfluxDB, a time-series data platform, with the InfluxDB Python Client. We’ll convert the JSON response from our API call to a Pandas DataFrame because I find that that’s the easiest way to write data to InfluxDB.
For the past 25 years, I’ve been monitoring networks, applications, services, basically anything digital on a quest to understand “when is it safe to cross the road”! We all know, just blindly crossing a road is EXTREMELY dangerous!
Companies must effectively monitor their assets and networks in today's competitive setting, get the most significant result, and react swiftly to problems. However, such a situation is unusual with companies that continue to run in a traditional, isolated setting. These companies frequently don't have precise asset performance tracking procedures.
We’ve got a lot of OpenTelemetry-flavored honey to send your way, ranging from OpenTelemetry SDK distribution updates to protocol support. We now support OpenTelemetry logs, released a new SDK distribution for OpenTelemetry Go, and have some updates around OpenTelemetry + Honeycomb to share. Let’s see what all the buzz is about this time! 🐝🐝
Hello, I’m Callum. I work on Grafana Loki, including the hosted Grafana Cloud Logs offering. Grafana Loki is a distributed multi-tenant system for storing log data — ingestion, querying, all that fun stuff. It also powers Grafana Cloud Logs.
In this technical deep-dive, we'll show you how to leverage AppDynamics to observe the state of the Amazon AWS Elastic Container Service.
Microservices have grown to become one of the most optimal alternatives to monoliths. However, just building your app and releasing it to the public isn’t everything. Monitoring microservices is as important as building and releasing them. You need to maintain it to resolve issues that may occur and also introduce new features from time to time.
We’re excited to share new Splunk capabilities to help measure how code performance impacts your services. Splunk APM’s AlwaysOn Profiling now supports.NET and Node.js applications for CPU profiling, and Java applications for memory profiling. AlwaysOn Profiling gives app developers and service owners code level visibility into resource bottlenecks by continuously profiling service performance, at minimal overhead.
Achieving cost savings is one of the main drivers for cloud adoption. But for most companies, controlling cloud spend is much more challenging than anticipated. In a recent survey, 94% of IT decision makers report they are overspending in the cloud. Our own survey on cloud costs revealed 90% of executives say better cloud cost management and cost reduction is a top priority.
As in any high-growth environment, expanding your suite of products and capabilities can contribute to a growing backlog of errors, and challenges prioritizing them… a scenario not lost on the team at Airtable, a connected apps platform that more than 300k organizations, including 80% of the Fortune 100, rely on to connect their teams, data, and workflows. To support organizations like Amazon and IBM, Airtable ships new features and updates through multiple deployments a week.
The leap to remote work happened nearly overnight with the pandemic, and it’s clear that hybrid work and digital dexterity is the way of the future. As a result of this shift in the way we work, companies have invested in new technologies to adapt to the growing remote world, with 69% of companies planning to increase their investment in digital tools even more in 2022. Additionally, over 90% of businesses strive to implement hybrid work environments.
You typically don't and shouldn't need to know where a web app is deployed. At least not from within the code of the web app itself. I keep seeing questions related to this, though. There are a range of reasons why this can still be relevant like if you want to generate and output an absolute URL in an MVC controller or Razor page. Here's a blog post about how to get the base URL in ASP.NET Core. Let's rewind a bit before we start looking into the code. All websites are deployed somewhere.
After some drawbacks we are very happy today to finally release Icinga for Windows v1.10.0! The past weeks we have spent a lot of time to polish this release, test many different aspects and optimize the user experience in general. Please make sure to read the upgrading docs carefully, before upgrading to v1.10.0. Otherwise, your installation might not work as expected, or Icinga for Windows might not load anymore.
Let’s admit it: end-to-end testing is a technical challenge. How do you make features testable? What testing framework should you use? When should you run your test suite? There are so many things to learn and consider. At Checkly, we want to ease end-to-end monitoring so that you can focus on shipping excellent software instead of figuring out how you monitor and test it. But before getting into our latest feature addition, let me answer the above questions.
Employees are returning from vacation, the weather is (finally) cooling down and summer is coming to a close. It can feel a bit overwhelming returning to work and getting back into the swing of things. When it comes to website monitoring, there are simple steps you can take to make sure your transition is as smooth as possible. Take advantage of a few ounces of pre-vacation prevention to save on pounds of post-holiday cure.
At VMware, we are on a mission to build a comprehensive, extensible, and intelligent monitoring and observability platform to help businesses run seamlessly. Over the past few years, we have evolved our platform to deliver invaluable end-to-end observability across applications and infrastructure.
Whether you’re using InfluxDB to record massive amounts of historical stock market data to analyze the current economic trends or simply to monitor the number of times the lights in your smart home turn on and off to cut down on wasted electricity, a sudden shock or delay in the flow of incoming data can be detrimental to your operation in the majority of scenarios.
In this blog, we examine how anomaly detection helps by setting up healthy alerts and providing efficient root cause analysis. Anomaly detection, part of AIOps, guides your attention to the places and times where remarkable things occurred. It reduces information overload, thereby speeding up RCA investigation.
Cloud services are the number one source of unexpected overspending for companies today. As a result, cloud financial management is a major focus for most organizations. But how do you track the success of cloud efficiency? Full allocation of multicloud costs is a critical component for understanding your actual cloud services usage, establishing cloud cost management ownership, and creating accurate budgets and forecasts at the line of business, project, application and even team levels.
FSLogix is a profile management solution used to apply personalization to user sessions for application and desktop virtualization technologies such as Citrix and Microsoft Azure AVD (Azure Virtual Desktop) and enable “roaming profiles”. It used to be common to copy a profile to and from the network when a user signs in and out of a remote environment. Because user profiles can often be large, sign in and sign out times often became unacceptable.
In this post, we’ll discuss two functions in the Cribl Stream arsenal: The Aggregations function, which allows you to perform stats and metrics collection in flight, and the Chain function allows you to call one Pipeline from within another. The event flow will continue when the Chained Pipeline returns. To demonstrate their use, we’ll answer this question: How long did it take for Cribl to process events using your pipeline?
As a principal engineer on the Splunk Real User Monitoring (RUM) team who is responsible for measuring and monitoring our service-level agreements (SLAs) and service-level objectives (SLOs), I depend on observability to measure, visualize and troubleshoot our services. Our key SLA is to guarantee that our services are available and accessible 99.9% of the time.
A product roadmap helps you say goodbye to scattered information across emails, meetings, and messages. And a typical roadmap includes.
In need of expert-tested, easy-to-use business templates to help you save time and improve productivity? Well, here’s a bundle of templates for business planning, financial planning and budgeting, inventory management, and more. For example.
In computer science, systems are typically divided into two categories: software and hardware. However, there is an additional layer in between, referred to as middleware, which is a software pipeline—an operation, a process, or an application between the operating system and the end user. This article aims to define middleware and reflect on its necessity, as well as address controversies about when and where it applies.
As organizations continue to expand their cloud footprint, managing costs without risking application performance is a priority. Because of this, Arm processors have become popular for their efficient, cost-effective processing power. Microsoft Azure’s new series of Azure Virtual Machines are powered by Ampere Altra Arm-based processors, which provide excellent price performance for scale-out and cloud-native workloads.
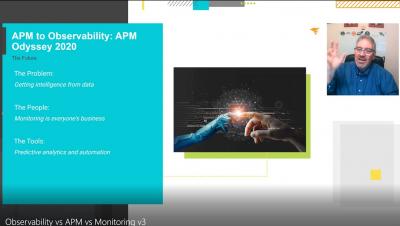
With its market size reaching more than $2 billion in 2020, you’d think that a universal definition of the term observability would have emerged by now. But it turns out that a clear definition of a term or industry isn’t necessarily a prerequisite for the rapid growth of its market size — just ask everyone at your next dinner party to define blockchain for you and see how many different answers you get!
Managing on-call schedules and escalation chains, especially across many teams, can get cumbersome and error prone. This can be especially difficult without as-code workflows. Here on the Grafana OnCall team, we’re focused on making Grafana OnCall as easy to use as possible. We want to make it easier to reduce errors with your on-call schedules, create schedule and escalation templates quickly, and fit on-call management into your existing as-code patterns.
Someone once described dashboards to me as “expensive TV for software engineers.” At first, I stood there quietly shocked—dashboards had informed many root cause analyses (RCAs) in my life as a developer.
Your liveness and readiness HTTP endpoints can generate a bunch of useless Spans and can mess with your latency metrics. On this post we’ll learn how to configure Kamon Telemetry to completely ignore these enpoints for good.
Microsoft Azure’s recently launched new Azure Virtual Machines (VMs) feature the Ampere Altra Arm-based processor. These new VMs are engineered to efficiently run horizontally scalable workloads such as web servers, application servers, and open source databases. They deliver excellent price-performance and represent an important addition to Microsoft Azure's portfolio of instance types.
You’ve probably heard something like this before: “It’s a managed service! We don’t need to worry about anything!” But when it comes to your production workloads, database monitoring is imperative. With the new Snowflake Dashboards and Detectors in the Splunk Observability Content Contributors repository you can start seeing the details of individual Snowflakes.
Food retailers reduce the workload accumulated by their IT areas by almost 30% thanks to monitoring. Controlling data and extensive information from the whole company, by controlling, supervising and ordering everything through the same system, allows to reduce the times of action in the face of possible errors and failures, improves resource management and organization and increases the effectiveness of the business activity. In addition, monitoring saves costs.
LogSnag is the new kid on the block, but we bet that it will become relevant in this space soon. Today we will show you how to monitor outages and get alerts for your third-party services within LogSnag. What is LogSnag? Here's the intro, but you can learn more at LogSnag official website.
Logs are key to monitoring the performance of your applications. Kubernetes offers a command line tool for interacting with the control plane of a Kubernetes cluster called Kubectl. This tool allows debugging, monitoring, and, most importantly, logging capabilities. There are many great tools for SREs. However, Kubernetes supports Site Reliability Engineering principles through its capacity to standardize the definition, architecture, and orchestration of containerized applications.
Akamai is one of the world’s largest CDN solution providers, helping companies greatly accelerate the secure delivery of content to their users all across the globe. Akamai provides this content delivery through its Intelligent Edge Platform, which is made up of hundreds of thousands of edge servers distributed around the planet.
As distributed environments become more complex, users often use distributed tracing tools to improve the visibility of issues evident within their traces. Throughout this post, we will examine some of the best open-source and other generally popular distributed tracing tools available today.
Given the global health crises the world has faced over the last few years, the need for expeditious but accurate medical trials has never been more important. The faster clinical trial data is validated, the faster medicines get approved and treatments become available. Pinnacle 21’s customers are driving forces behind creating life-saving treatments.
If you’re in the market for a new SAP HyperScaler, you may have been wondering what exactly you should look for. Maybe you’re wondering which model is best for your needs. Don’t worry, we’ve got you covered. We’ve done all the research and found the best SAP HyperScaler on the market. You’ll also find a buying guide to help you navigate the process and find the right SAP HyperScale server for your needs.
ManageEngine OpManager MSP is a reliable solution solely developed to help managed service providers with monitoring client networks and servers exhaustively. It has a wide range of out-of-the box features to help MSPs in their multi-client network monitoring journey. The ManageEngine team works hard to make products that cater to the needs of MSPs, which is why OpManager MSP undergoes regular improvements, because even the most feature-rich tools need tune-ups every now and then.
So, you have launched a website intending to reach a worldwide audience? If you're running a business, this could be the first step to growing your brand. But is your website really ready to go global? After all, just because your website works for a user in the United States doesn't mean it will be accessible to a user in Japan. For one, not everyone speaks the same language. Does your website offer translation for users visiting from different global locations?
CrashLoopBackOff is a Kubernetes state representing a restart loop that is happening in a Pod: a container in the Pod is started, but crashes and is then restarted, over and over again. Kubernetes will wait an increasing back-off time between restarts to give you a chance to fix the error. As such, CrashLoopBackOff is not an error on itself, but indicates that there’s an error happening that prevents a Pod from starting properly.
PromQL is a flexible language designed to make it easy for users to perform ad-hoc queries against their data. By default, Prometheus indexes all of the fields in each metric except for source and target, which are not indexed by default. Prometheus is an open-source tool that lets you monitor Kubernetes clusters and applications. It collects data from monitoring targets by scraping metrics HTTP endpoints.
We are happy to announce that file provisioning for Grafana Alerting has arrived in Grafana 9.1. This feature enables you to configure your whole alerting stack using files on disk, as you may already do with data sources or dashboards. The Terraform Grafana provider has also been updated to allow the provisioning of Grafana Alerting resources.
Efficient manufacturing is important for saving companies time, money, and energy. Making decisions based on data can improve efficiency, but there’s a lot of data to sort through. Manufacturing equipment contains many sensors, especially in the IIoT space. Overall Equipment Effectiveness (OEE) was first described by Seiichi Nakajima in the mid-twentieth century as part of his Total Productive Maintenance (TPM) method.
Software applications have become crucial for business growth and success in today's world. However, as businesses become increasingly competitive, the necessity to provide top-notch software applications is also increasing. Additionally, as organisations gravitate towards developing extensive, feature-rich applications, they are witnessing an increase in software complexity – that can often cause things to get out of hand very quickly.
When evaluating a monitoring product, it is essential you fully understand its alerting capabilities. Alerting is a responsive action triggered by a change in conditions within the system being monitored. Typically, an alert can be defined by a condition to trigger the alert and an action defining what that alert should do when the trigger condition occurs.
Recent events have changed the world forever. For network operations (NetOps) teams, it means there’s no going back to the way things used to be. Virtually overnight, teams had to adapt to work-from-anywhere (WFA) models. The move to SaaS, cloud, and SD-WAN continue to accelerate—and in the process fundamentally alter the nature of network environments.
Edgecast is a global network platform that provides a content delivery network (CDN) and other solutions for edge computing, application security, and over-the-top video streaming. Using Edgecast’s JavaScript-based CDN, teams can improve web performance by caching static and dynamic content with low latency and minimal overhead.
Earlier this year, Job Snijders and I published an analysis that estimated the proportion of internet traffic destined for BGP routes with ROAs. The conclusion was that the majority of internet traffic goes to routes covered by ROAs and are thus eligible for the protection that RPKI ROV offers. However, ROAs alone are useless if only a few networks are rejecting invalid routes.
Distributed tracing is a method of tracking requests as they propagate through a distributed system. A trace is built from spans. Each span represents an interaction, like an HTTP request, a DB query, a serverless function invocation, etc. A trace is essentially a tree of spans. Based on the collected span data, a distributed tracing platform can capture all the interactions between the different architectural components and tie them together with a trace ID.
With the Grafana 8.5 release, we introduced the concept of service accounts. Now with the Grafana 9.1 release, we’re making service accounts generally available. This is a project that came out of technical necessity, but it has given us the opportunity to reflect on API tokens and machine-to-machine interaction across Grafana Labs.
Telegraf is a very powerful open source plugin-based agent that gathers data from stacks, sensors, and systems and sends it to a database. It collects data from an input and sends it to an output, and gives you the option to transform data with aggregators and processors before it reaches its endpoint.
SLOs—or Service Level Objectives—can be pretty powerful. They provide a safety net that helps teams identify and fix issues before they reach unacceptable levels and degrade the user experience. But SLOs can also be intimidating. Here’s how a lot of teams feel about them: We know we want SLOs, we’re not sure how to really use them, and we don’t know how to debug SLO-based alerts. Don’t worry, we’ve got your answer—observability!
Do you want to learn more about the IPAM management tool? Visit the first part of the video https://youtu.be/-ByuHaNnrDs
Do you want to test the power of all-in-one monitoring? Request a free trial of the Enterprise version on our website: https://bit.ly/2O9hoRf
As organizations increasingly adopt cloud-first strategies, it’s important to have data stores that have internet-level scalability to power these cloud native applications. For applications running on Azure, the logical choice is Azure Cosmos DB.
At Broadcom Software, we strive to build the most scalable operational software in the market. We work to ensure that our network monitoring software can track how constant network changes affect user experiences. As a global provider of networking equipment, we understand that there will always be changes happening on today’s enterprise networks, especially the internet. That’s why we build and refine our monitoring software to align with constant change.
Site reliability engineering (SRE) is what you get when you treat operations as if it’s a software problem. The mission of an SRE practice is to protect, provide for and progress the software and systems offered and managed by an organization with an ever-watchful eye on their availability, latency, performance and capacity.1.
When troubleshooting an incident, DevOps teams often get bogged down searching for errors and unexpected events in an ever-increasing volume of logs. The painstaking nature of this work can result in teams struggling to resolve issues before new incidents appear, potentially leading to an incident backlog, longer MTTR, and a degraded end-user experience.
The financial services industry has been under increasing pressure during the past several years to view operational resilience and their risk management postures as being symbiotic in the wake of rising operational incidents and increasingly frequent security threats.
The best part of my job is talking with prospects and customers about their logging and data practices while explaining how Cribl focuses on getting more value from observability data. I love to talk about everything they are doing and hope to accomplish so I can get a sense of the end state. That is vital to developing solutions that provide overall value across the enterprise and not just a narrow tactical win with limited impact.
You’ve probably seen Rush Hour, a logic puzzle where you have to slide cars and trucks out of the way to steer the red car towards the exit. In real life, when your customers are responsible for tracking hundreds or thousands of data points from dozens of valuable, mission-critical sensors, you’re tracking engine speed, network signal level, distance from the RF, and more—and not just through traffic but across continents.
Azure Advisor analyzes your configurations and usage telemetry and offers personalized, actionable recommendations to help you optimize your Azure resources for reliability, security, operational excellence, performance, and cost. Azure Advisor is a free service and can be accessed via the GUI on the Azure portal where recommendations are collated and can be manually examined. Azure Advisor makes recommendations for potential improvements in several areas, including.
Welcome to another month of What’s New in Sysdig in 2022! I’m Joshua Ma, a Customer Solutions Engineer based out of sunny Los Angeles. I joined the Customer Success team at Sysdig five months ago. After having my first taste of K8s, containers, and Falco at the North America KubeCon/CloudNativeCon in 2019, I haven’t looked back since!
In the quest for business transformation and digital modernization, organizations have rapidly adopted devops frameworks, microservice architectures, serverless technologies, and containerized infrastructures. However, they have realized that legacy tools cannot adequately address the newer security and monitoring challenges associated with modernization. Sysdig’s mission is to make every cloud platform secure and reliable from source to run.
Streaming time series data from brokers and services that are on-premises or in the cloud to a cloud-based database is a resource-intensive process requiring third-party software and heavy customizations. Today we’re announcing InfluxDB Native Collectors to make it easy for developers to collect, process, and analyze data by subscribing directly to supported message brokers.
SAN FRANCISCO — August 23, 2022 – InfluxData, creator of the leading time series platform InfluxDB, today announced new serverless capabilities to expedite time series data collection, processing, and storage in InfluxDB Cloud. InfluxDB Native Collectors enable developers building with InfluxDB Cloud to subscribe to, process, transform, and store real-time data from messaging and other public and private brokers and queues with a click of a button.
The way organizations process logs have changed over the past decade. From random files, scattered amongst a handful of virtual machines, to JSON documents effortlessly streamed into platforms. Metrics, too, have seen great strides, as providers expose detailed measurements of every aspect of their system. Traces, too, have become increasingly sophisticated and can now highlight even the most precise details about interactions between our services. But alerts have remained stationary.
In the monitoring industry there’s a complicated and frustrating conversation that persisted over the years: how do you deal with the enormous volume of data generated by instrumentation? On one side of the aisle, you will find a cohort of vendors and developers telling you that you have to sample data, followed immediately by another group telling you that sampling will ruin the accuracy of incident analysis. They’re both right.
Kubernetes is the most popular container orchestration tool for cloud-based web development. According to Statista, more than 50% of organizations used Kubernetes in 2021. This may not surprise you, as the orchestration tool provides some fantastic features to attract developers. DaemonSet is one of the highlighted features of Kubernetes, and it helps developers to improve cluster performance and reliability.
gRPC is an open-source Remote Procedure Call (RPC) framework developed by Google and released in 2016. Although gRPC is still relatively new, large organizations are adopting it in increasing numbers to build APIs that connect complex microservice meshes that use disparate languages and frameworks. gRPC-based APIs can perform requests up to seven times faster than REST APIs and enable customers to easily implement SSL authentication, load balancing, and tracing via plug-in libraries.
Roaming in the world of cloud technology not only helps you take a glance at the realm of cutting-edge technology but also helps you get familiar with concepts such as monitoring and observability. This article will cover an introduction to monitoring and the need for monitoring applications. From here, we will look at how you can utilize the data received when monitoring an application. This will allow us to understand how the concept of observability fits in with monitoring.
When it comes to a website’s performance, we all know the universal rule: speed matters… a lot. Beyond a good user experience, it’s a key factor in what Google is specifically looking—and testing—for. If you need a refresher, here it is, straight from Google: And what exactly does Google consider fast?
In this post, we’ll look at how you can use OpenTelemetry to monitor your unit tests and send that data to Honeycomb to visualize. It’s important to note that you don’t need to adopt Honeycomb, or even OpenTelemetry, in your production application to get the benefit of tracing. This example uses OpenTelemetry purely in the test project and provides great insights into our customer’s code. We’re going to use xUnit as the runner and framework for our tests.
When we say “logs” we really mean any kind of time-series data: events, social media, you name it. See Jordan Sissel’s definition of time + data. And when we talk about autoscaling, what we really want is a hands-off approach at handling Elasticsearch/OpenSearch clusters. In this post, we’ll show you how to use a Kubernetes Operator to autoscale Elasticsearch clusters, going through the following with just a few commands.
Grafana Tempo 1.5 has been released with a number of new features. In particular, we are excited that this is the first release with experimental support for the new Parquet-based columnar store. Read on to get a high-level overview of all the new changes in Grafana Tempo! If you’re a glutton for punishment, you can also dig into the hairy details of the changelog.
Today we are happy to officially announce that InfluxData has donated a generic object store implementation to the Apache Arrow project. Using this crate, the same code can easily interact with AWS S3, Azure Blob Storage, Google Cloud Storage, local files, memory, and more by a simple runtime configuration change. You can find the latest release on crates.io. We expect this will accelerate the pace of innovation within the Rust ecosystem.
There have been amazing articles on the subjects of migrating from a monolith to a microservice architecture e.g. this is probably one of the better examples. The benefits and drawbacks of the architectures should be pretty clear. I want to talk about something else though: the strategy. We build monoliths since they are easier to get started with. Microservices usually rise out of necessity when our system is already in production.
When building systems that need to scale above a certain number of users, we usually can’t stay on one machine. This is where cloud providers like AWS usually come into play. They allow us to rent VMs or containers for small intervals. This way, we can start a few different machines when more traffic hits, and when it goes down later, we can simply turn off our extra capacity and save money. The question is, how does all this traffic get to our new machines? AWS Elastic Load Balancing!
Your company has a product/service that needs to be up and running 24/7 or serving customers worldwide? Heads up, you might need an on-call team. In this article, we’ll start with the basics of what is on-call and why it is important.
For most businesses, effective digital transformation is a key strategic objective, and as computing infrastructure grows in complexity, end-to-end observability has never been more important to this cause. However, the amount of data and dynamic technologies required to keep up with demand only continues to increase, and current tools are not equipped to handle it- with any discrepancies resulting in rising costs and reduced competitiveness.
OpenTracing was an open-source project developed to provide vendor-neutral APIs and instrumentation for distributed tracing across a variety of environments. As it is often extremely difficult for engineers to see the behaviour of requests when they are working across services in a distributed environment, OpenTracing aimed to provide a solution to heighten observability.
InfluxDB is an open-source time series database. Built to handle enormous volumes of time-stamped data produced from IoT devices to enterprise applications. As data sources for InfluxDB can exist in many different situations and scenarios, providing different ways to get data into InfluxDB is essential. The InfluxDB client libraries are language-specific packages that integrate with the InfluxDB v2 API. These libraries give users a powerful method of sending, querying, and managing InfluxDB.
We love to write and ship code to help developers bring their ideas and projects to life. That’s why we’re constantly working on improving our product to meet developers where they are, to ensure their happiness, and accelerate Time to Awesome. This week, we are covering a featured product release that we think will save you time and effort when onboarding to time series and InfluxDB.
OpenTelemetry is a free and open-source software initiative with the objective of supplying software developers with the means to create distributed systems. OpenTelemetry was developed by engineers at Google, and developers have the ability to utilize it to create a standard foundation for the construction of distributed systems. The goal is to enable developers to write code once and then deploy it in any location of their choosing.
If an energy cable running through the waters surrounding Denmark gets damaged by a passing vessel, does it make a sound? Yes. . . and it’s the ping of a Grafana alert at the offices of Energinet, an independent public enterprise owned by the Danish Ministry of Climate, Energy, and Utilities.
OpenTelemetry is a collection of tools and APIs for collecting, processing, and exporting telemetry data from software. It is used to instrument applications for performance monitoring, logging, tracking, tracing, and other observability purposes. What is Telemetry? The word is derived from the Greek “tele” meaning “remote,” and metron meaning “measure.” So, it’s the collection of metrics and their automatic to a receiver for monitoring.
In 2018, Honeycomb co-founder & CTO Charity Majors wrote a blog post titled, “An Engineer’s Bill of Rights (and Responsibilities).” We’ve recently updated and reposted it.
Virtual desktop infrastructure (VDI) is a technology that refers to the use of virtual machines to provide and manage virtual desktops. Users access virtual desktops from their laptops, desktops, thin clients, or mobile devices from anywhere. Virtual desktops are hosted in a data center, on servers, and all the necessary processing is done on the server that hosts the virtual desktops.
Inc. is shining a light on Mezmo as one of the fastest growing companies in the nation. We are truly honored to be featured alongside innovative brands like Sentry and Calendly, who are building the future of tech. Our position on the list at number 695 reflects our 900% growth in revenue and 300% growth in the size of our team from 2018 to 2021.
On July 8 of 2022, the Canadian telecom company Rogers Communications suffered a major outage that impacted most of Canada for almost two days. This wasn’t completely unprecedented (they’d had an outage in 2021 that impacted their wireless servers for several hours) but the breadth and severity of this one is going to end up costing them far, far more than it seems at first glance.
Earlier this year, we announced that one of our goals for this year is to bring the UI of Oh Dear to the next level. Behind the scenes, our team is working hard on a complete rewrite of our marketing website and app. We're currently targeting the end of September timeframe to launch our redesign. In this blog post, we'd like to give you a preview of the redesign.
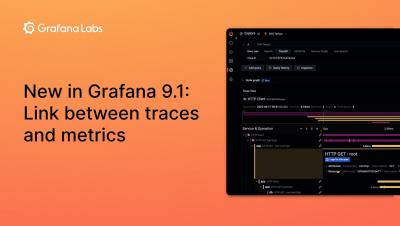
Traces, logs, and metrics provide inherently different views into a system, which is why correlating between them is important. With features like exemplar support, trace to logs, and span references, you can quickly jump between most telemetry signals in Grafana. With the release of Grafana 9.1, we’re improving Grafana’s ability to correlate different signals by adding the functionality to link between traces and metrics.
I’m a recent entrant to the Website Monitoring game, but there is one thing I realized straight away: A Monitoring tool is only as good as it’s configured to be. Website monitoring is at its best when it’s reliable, informative, and efficient. When it gives you the information you need, when you need it, and the peace of mind to say “if I’m not being alerted, I know it’s still working.”
While it is fair to say that in recent years we’ve seen a shift to servers being deployed in the cloud through Microsoft Azure or AWS, I’m sure if you’re reading this today you still have a large percentage of physical servers under your management, including Hyper-V and ESXi hosts. N-central’s ESXi monitoring should automatically detect and monitor the hardware in these boxes, but what about the rest?
The scenario: you want to see distributed traces, maybe for your web app. You’ve set up an OpenTelemetry collector to receive OTLP traces in JSON over HTTP, and send those to Honeycomb (how to do that is another post, and we’ll link it here when it’s up).
The combination of SNS to SQS to Lambda is a common sight in serverless applications on AWS. Perhaps triggered by messages from an API function. This architecture is great for improving UX by offloading slow, asynchronous tasks so the API can stay responsive. It presents an interesting challenge for observability, however. Because observability tools are not able to trace invocations through this combination end-to-end. In X-Ray, for example, the trace would stop at SNS.
Philadelphia, PA – August 10, 2022 – Goliath Technologies, a leader in end-user experience monitoring and troubleshooting software for hybrid cloud environments, announced today that they achieved record revenue growth during the first half of the calendar year 2022, up more than 45% YOY 2021.
Successful IT operations management (ITOM) of today’s complex enterprise infrastructure requires collecting a lot of data and making informed, automated decisions based on the insights contained in that data.
While many people know us from our semiconductor and infrastructure software solutions, few have visibility into what goes on behind the scenes to support Broadcom’s global business. Within the Broadcom Software division, the Broadcom Global Technology Organization (GTO) is responsible for managing an extensive IT infrastructure, one that spans 18 data centers, 100 sites, and 400 R&D labs.
Ransomware is the gift that keeps on giving. Old as it is (33 years) ransomware is constantly morphing into new exploits. The reason is simple. Ransomware works and too often cybercriminals walk away with bags of money (or piles of Bitcoin, anyway). “Following the World Health Organization's AIDS conference in 1989, Joseph L. Popp, a Harvard-educated biologist, mailed 20,000 floppy disks to event attendees.
Dealing with an intermittent Internet connection is very frustrating. Does your Internet connection keep disconnecting and reconnecting when you’re watching your favourite Netflix show or chatting with your colleagues on Zoom? In this article, we’re teaching you how to troubleshoot intermittent Internet issues with Network Monitoring.
In 2018 we launched the Sentry Unity SDK, but at the time, we couldn’t crack how to display stack trace line numbers for C# exceptions with IL2CPP scripting backend. And until a recent release of Unity, we thought it wasn’t possible. But here at Sentry we often do the impossible… or at least the improbable. Like adding features to our JavaScript SDK while making it smaller at the same time.
Dataflow is a fully managed stream and batch processing service from Google Cloud that offers fast and simplified development for data-processing pipelines written using Apache Beam. Dataflow’s serverless approach removes the need to provision or manage the servers that run your applications, letting you focus on programming instead of managing server clusters. Dataflow also has a number of features that enable you to connect to different services.
This time I want to show a feature that’s not obvious at first sight, but can save a lot of time, when you’re intending to create UI mockups with realistic data.
Testing web applications from the user interface (UI) is a must for every customer-facing product, from e-commerce portals to cyber security dashboards. Often, a broken or inefficient UI experience can make or break whether end users adopt a product quickly and trouble-free. This is why developers have embraced UI testing as a critical part of their development process.
Google announced a new set of metrics known as “Core Web Vitals” which will be used as ranking factors in 2021. The announcement is part of Google’s ongoing effort to make the web more user-friendly and to help site owners improve the experience for their visitors. This is big news for site owners and SEO's who are always looking for ways to improve their site’s ranking on Google.
Honeycomb Play is an interactive sandbox that lets users explore Honeycomb’s data-enriched UI through a guided scenario. The hands-on experience takes a deep dive into how Honeycomb enables you to identify issues, assess their impact, and diagnose their causes for remediation. There is no requirement to sign up—simply dive in and get started right away!
The current trend to move to Zero Trust security architectures using the mantra “Never Trust, Always Verify” is a move that Teneo has long supported. The simple fact is that the traditional castle and moat approach to security built on VPNs is not fit for purpose in the modern world with hybrid users and infrastructures.
In the race to create more sophisticated apps, microservices and scalable cloud environments, monitoring is not enough. As environments gain complexity, an observability mindset is paramount in transforming data into mission-critical insights.
We’re excited to announce the launch of a new feature we’ve been working on in Grafana 9.1: public dashboards 🎉. The public dashboards feature will allow you to share your Grafana dashboard with anyone, even if they’re not part of your Grafana organization. Historically, the only way that someone could share a dashboard externally was taking a one-time snapshot 📸, or disabling all authorization for their Grafana instance 😬.
DX NetOps 22.2 optimizes network operations with industry-leading visibility, scale and modern network coverage beyond the network edge to quickly and easily isolate end-user experience impact of network performance issues. Recent research revealed that 67% of companies cite internet and cloud network paths as monitoring blind spots. Furthermore, 71% of companies say that adoption of new network technologies is delayed by inadequate network monitoring software.
Among the 200+ fully features services that Amazon Web Services (AWS) offers, Elastic Compute Cloud (EC2) is the most popular. In the recent eG Innovations and DevOps Institute survey of 900+ IT professionals, cloud instances were the most commonly used cloud service, with 63% usage among respondents.
This article was originally published in The New Stack and is reposted here with permission. You may be familiar with live examples of machine learning (ML) and deep learning (DL) technologies, like face recognition, optical character recognition OCR, the Python language translator, and natural language search (NLS). But now, DL and ML are working toward predicting things like the stock market, weather and credit fraud with astounding accuracy.
This article was written by Shane from Infosys. Infosys is a global IT Leader, headquartered in India, with over 200,000 employees and a focus on digital transformation, AI/ML, and Analytics. Our organization faces challenges when working with data to assist with proactive anomaly detection, triaging incidents to accommodate for data and volume growth, and maintaining high availability and SLA’s for a near 100% uptime.
If you asked your engineering team how well they can handle all of the security and observability data they’re managing, would you get a resounding “Yeah boss, we’re good to go!” in response? Possible, but unlikely. Chances are they feel like they’re stuck on a boat that’s taking on water, spending their day using tiny buckets to scoop some of it out, with no way to plug any of the leaks.
What is AIOps? How does an AIOps platform help your observability practice? AIOps platforms analyze telemetry and events, and identify meaningful patterns that provide insights to support proactive responses. AIOps platforms have five characteristics:1 The above is Gartner’s definition and is part of the Gartner® “Market Guide for AIOps Platforms.” The Gartner definition is also aligned with our view.
According to a new study, the hybrid work model reduces attrition by a third. As the pandemic shifted work to remote, with some companies going fully remote work for over two years, many organizations are looking to continue to allow hybrid work environments. In 2022, more than 90% of midsize companies plan to implement a hybrid work structure. One of our customers practices this model and is always interested to know what new features can enhance the digital experience of their distributed workforce.
Are multiple IT operators accessing, utilizing, or managing your network address space? If so, then you might have noticed that one of the time-consuming network management tasks you are undertaking regularly, is allocating IP addresses to the IT operators. This is an inevitable task since, as your network scales with new physical components or technology implementations, your operators require new IPs to enable network connectivity.
We love exceptions. Not in the oh-no-my-website-crashed kind of way, but all of the possibilities provided by exceptions and a good exception handling strategy. In this post, I'll introduce you to three different NuGet packages that will help you when dealing with exceptions in C#. .NET comes with a set of exceptions as part of the C# language. You've probably tried creating your own exceptions too by extending System.ApplicationException or similar.
Grafana 9.1 is here! Get Grafana 9.1 We’ve made a number of improvements to Grafana’s usability, data visualization, and security. For a full list of new features and capabilities, check out our What’s New in Grafana 9.1 documentation. You can get started with Grafana in minutes with Grafana Cloud. We have a generous free forever tier as well as plans to suit every use case — sign up for free now. Here are some of the highlights in Grafana 9.1.
The complexity of today’s workplace technology means that all of our environments are incredibly unique. Two organizations may use the same platforms and applications, but the tactics we use to implement these tools are all unique to our own goals and business needs. But all of us who work in IT and engineering can agree: our companies’ success hinges on our ability to keep our environments running smoothly. I’m a senior engineer at the pharmaceutical company AbbVie.
Building and utilizing modern applications now essentially requires APIs. They are a crucial component of every company's automated workflow, and as more customers depend on your APIs to power their applications, the demand for them to be trustworthy is growing. Your business will suffer if its performance, availability, or health degrades, thus proactive API monitoring is essential to ensure its dependability. We'll go through the most important API metrics in this article.
Kubernetes 1.25 is about to be released, and it comes packed with novelties! Where do we begin? This release brings 40 enhancements, on par with the 46 in Kubernetes 1.24 and 45 in Kubernetes 1.23. Of those 46 enhancements, 13 are graduating to Stable, 10 are existing features that keep improving, 15 are completely new, and two are deprecated features.
In the last 2 parts of this series around improving performance in your Django applications, we focused on database and code optimizations. In part 3, we will focus on ways to improve the frontend speed of our Django applications by using the following.
Debugging is a frequently performed task not just for general software developers but also for game developers. During a debugging process of a game, most issues can be identified by simulating a code walkthrough.
As companies evolve and grow, so do the number of applications, databases, devices, cloud locations, and users. Often, this comes from teams adding tools instead of replacing them. As security teams solve individual problems, this tool adoption leads to disorganization, digital chaos, data silos, and information overload. Even worse, it means organizations have no way to correlate data confidently. By centralizing log data, you can overcome the data silos that tool proliferation creates.
Serverless backends have different monitoring challenges when compared with traditional applications, mostly due to the distributed and proprietary nature of serverless. Making monitoring and debugging efficient for serverless requires a unique set of tools and techniques. In this article, we’ll discuss the challenges of debugging serverless backends and how to utilize third party tools to improve the monitoring process.
Alerting has been a fundamental part of operations strategy for the past decade. An entire industry is built around delivering valuable, actionable alerts to engineers and customers as quickly as possible. We will explore what’s missing from your alerts and how Coralogix Flow Alerts solve a fundamental problem in the observability industry.
As a Middleware Administrator, you may need to monitor the status of SAP due to a potential exception that you cannot predict. In order to do this, you may need to connect to the SAP system somehow. In this blog post, we’re going to show you how to monitor SAP through to Oracle WebLogic and Java aspects. You are able to connect to the SAP system using the WebLogic SAP Resource Adapter.
Ever discovered an IP issue only after an end user reported it? If yes, you are not alone! Many network admins without a proactive monitoring solution in place have to constantly deal with recurring IP issues such as IP conflicts and subnet overutilization. As simple as it sounds, IP address management can be a tricky endeavor without the right strategy and management tools. Managing hundreds of IPs across multiple subnets and supernets can be tedious.
The Datadog Service Catalog helps you centralize knowledge about your organization’s services, giving you a single source of truth to improve collaboration, service governance, and incident response. Datadog automatically detects your APM-instrumented services and writes their metadata to a service definition before adding them to the catalog.
Veterans United Home Loans is the top VA lender for home buyers in the United States and has been making the dream of homeownership a reality for veterans and military families for more than two decades. A big part of making that dream come true is keeping their services – including both internal applications and a robust digital experience for their borrowers – highly performant.
We’ve reached the point in the DevOps transformation where efficiency and automation are no longer the highest objectives. The next step is engineering past automation and towards fully autonomous, self-healing systems. If you aren’t conversing about building this type of resilience into your systems and applications, there’s never been a better time than now to start.
IT roles have never been more in demand and IT salaries have never been higher, according to recent reports and data sources. Whether you are hiring, looking for a career change, or simply work in tech, it’s important to stay up-to-date on the state of employment in the industry. This blog post will review, roundup, and summarize some of the latest trends for IT salaries and demand by role and location (among other variables) to help you get a clear view of the landscape.
Cloud migration efforts continue to grow today as organizations move into a post-pandemic work environment. According to McKinsey & Company, by 2024, most enterprises aspire to have $8 out of every $10 for IT hosting go toward the cloud. In a survey by Morgan Stanley, CIOs say cloud computing will see the highest rate of IT spending growth in 2022.
As someone who has seen the devastating effects of poor performance monitoring firsthand, I can attest to the importance of doing it right from the start. If your users are experiencing latency issues and you’re not aware of them, that’s a big problem. At one of my previous jobs, we ended up paying out millions of dollars in SLA violation fees because we didn’t have proper monitoring.
Thanks to Vinay Kumar for being a key contributor to this article. We love to write and ship code to help developers bring their ideas and projects to life. That’s why we’re constantly working on improving our product to meet developers where they are, to ensure their happiness, and accelerate Time to Awesome. This week, we are covering a featured product release that we think will save you time and effort when building with time series, InfluxDB – and specifically – Tasks.
This is how the developer story used to go: You do your coding work once, then you ship it to production—only to find out the code (or its dependencies) has security or other vulnerabilities. So, you go back and repeat your work to fix all those issues. But what if that all changed? What if observability were applied before everything was on fire? After all, observability is about understanding systems, which means more than just production.
Prometheus is among the leading open-source metric-gathering and alerting platforms for managing metrics from microservices architectures. As Prometheus is such a popular choice in the cloud computing landscape today, we will explain how Prometheus metrics can be leveraged for observability.
At GrafanaCONline 2022, Theia Scientific President, Managing Member, and Lead Developer Chris Field and Volkov Labs founder and CEO Mikhail Volkov — a Grafana expert — delivered a presentation about using Grafana and machine learning for real-time microscopy image analysis. Real-time microscopy image analysis involves capturing images on a microscope using a digital device such as a PC, iPad, or camera.
Check out our free trial, no credit card required: https://uptime.com/go/home
#monitoring, #saas, #downtime, #uptime, #nomore404, #outage, #enterprisesbusiness
The complexity of modern information technology (IT) infrastructures has grown exponentially and changed the way software companies operate and deliver products and services. The days of a single application server and a simple delivery path are long gone. Today’s application development and delivery process can encompass multiple platforms, cloud vendors, code libraries and customer bases.
The modern standards of the web demand that user-facing applications be highly usable and satisfying. When deploying frontends, it’s important to implement a comprehensive testing strategy to ensure your customers are getting the best possible user experience. It can be difficult, however, to gauge the effectiveness of your test suite. For instance, all of your tests may be passing, but they might not cover a specific UI element that is crucial to a critical workflow.
I remember just about three years ago sitting in a companywide meeting in a conference room at the Museum of Modern and Contemporary Art in Lisbon, Portugal (Museu Coleção Berardo, Lisboa). Our CTO, Bernd Engist, was giving us a presentation about some new features we had recently developed on automating the start/stop process of an SAP system.
The Spanish tourism sector is preparing for a record summer in which they hope to emulate the summer periods prior to the coronavirus pandemic. The government has already advanced that 90% of the foreign tourism that visited the country in 2019 will be recovered. That year, 84 million foreigners were received, a figure that is expected to be reached this year, taking advantage of the high temperatures and the national tourist offer.
Citrix monitoring refers to the ability to monitor Citrix services end-to-end. It includes the ability to monitor user experience – from logon time to application launch time to screen refresh latency so administrators can easily monitor and track if they are meeting their service levels (SLAs).
Serverless technologies let us do more with less effort, time and energy. They let us focus on creating user value and let the cloud handle undifferentiated heavy-lifting like scaling and securing the underlying infrastructure that runs our code. Serverless technologies have allowed me to accomplish tasks as a solo engineer that used to take a whole team of engineers to accomplish, and I’m able to complete these tasks in a fraction of the time and cost to my customers.
If you are in a room with 20 engineers and you ask, “explain what an API is to a non-technical person”, you will get 20 different analogies. An API is like the on button to your TV connecting you to a variety of shows and systems, or an API is like a waiter taking your order and serving you from the kitchen. An API is like a library card catalog, or it’s simply a tool that connects you to other tools.
Does your development team want to snooze alerts during non-business hours? Or proactively prevent the creation of expected alerts for an upcoming expected maintenance window? Cloud Alerting in Google's Cloud operations suite now supports the ability to snooze alert policies for a given period of time. You can create a Snooze by providing specific alert policies and a time period. During this window, if the alert policy is violated, no incidents or notifications are created.
Learn how Obkio works with technology agency & major hosted VoIP Service Provider, bravad TI, to create a streamlined network monitoring and troubleshooting process to optimize VoIP performance & improve the end user experience.
One of our goals here at Checkly is to make it easier for developers to ship excellent software. But let’s face it, getting features out is only a tiny fraction of the story. Fast-moving development teams also break things. And the more things you build, the more things can go wrong. And trust me, they will. This is where API and end-to-end monitoring helps. Define automated test suites that check all your properties constantly and guarantee that everything’s up and running. All the time.
We are happy to announce the release of the Grafana usage groups feature in Grafana Cloud. This new feature — which is available in the Grafana Cloud Advanced plan — helps centralized observability teams and administrators track and attribute metrics usage back to groups that exist within a single shared Grafana stack. Ultimately, Grafana usage groups can help with governance and cost control.
In the sea that is the SaaS market, there is an abundance of software for employee monitoring. This software, as the name suggests, is used for time tracking, monitoring, project management, and implementing safety measures. Widely used by companies that want to ensure that their employees are actually getting work done while on the clock, but that’s not where the benefits of using these tools end.
The objective of Network Operator Confidential is to share our global internet market insights from recent months. Kentik, and our customers, have access to views and analysis of global internet traffic that no one else can match. In our first Network Operator Confidential webinar, I was joined by Doug Madory, Kentik’s director of internet analysis, and Grant Kirkwood, founder and CTO at Unitas Global.
It is arguably the most important 3-letter acronym on the digital marketing landscape. No, it’s not ROI. It’s SEO. Consider that: Clearly, effective SEO is extremely important. And for many businesses — especially smaller companies that are competing against big, established enterprises — it’s a matter of survival. However, for some decision-makers outside of the digital marketing world, the link between SEO and site uptime is less clear. Let’s fix that.
A rising number of businesses are adopting and utilizing cloud services and capabilities with remarkable success. But embracing cloud tools and services often brings unexpected changes for business leaders and IT teams, especially because of the way in which cloud adoption has altered how networks are monitored and managed.
In today’s digital world, users expect to have a seamless experience in their day-to-day applications. To achieve such reliability and stability in our application, information about the health and performance of an application has become necessary for developers to gain insights and fix bottlenecks to provide a seamless user experience. One of the best ways to gain such insights into an application is to use a monitoring system.
If you ask the experts, they will tell you that companies have too many IT tools for monitoring their environments. Monitoring tools for network, infrastructure, application, wireless, endpoint, cloud, etc. proliferate all organizations. According to research by Gartner, more than a third of organizations surveyed have more than 30 monitoring tools. More than half of organizations surveyed have at least 11 tools. Sounds like a good argument for IT tool rationalization. But is this really the case?
The use of a Real-Time Operating System (RTOS) is increasingly common in embedded software designs. An RTOS makes it easy to divide your code into smaller blocks, tasks, which execute seemingly in parallel and independent of each other, as described in the first article in the RTOS 101 series.
Systems and applications alike have become progressively distributed as microservices, open-source tools, and containerisation have gained traction. In order to actively monitor and respond quickly to issues that arise in our environment, distributed tracing has proven to be vital for businesses such as Uber, Postmates, Hello Fresh and TransferWise. It is, however, important to clarify what distributed tracing actually means.
Today’s blog post will give an insight into one of the many things that improved with Icinga DB: how host and service history is written to the database, both by the old IDO feature, as well as what has changed with Icinga DB and how this leads to more reliable results.
Power has a way of flowing towards people managers over time, no matter how many times you repeat “management is not a promotion, it’s a career change.” It’s natural, like water flowing downhill. Managers are privy to performance reviews and other personal information that they need to do their jobs, and they tend to be more practiced communicators.
Our latest webinar shows how you can put IT process automation to work for your enterprise.
Businesses today need to react instantly to changes or alerts that impact the digital experience. Full-stack visibility can help.
Website uptime is one of the most crucial metrics to monitor, particularly if your website is essential for generating revenue. If no one can access a website, all the work and effort you put into getting a website up and running can be gone. With website uptime monitoring, you can keep track of when and how long your website is unavailable. Website uptime monitoring is a crucial component of website management.
More than 17 million developers use Docker to build, ship, and run applications separate from their infrastructure in order to deliver software faster and more efficiently. With the rising popularity of containerized applications, however, it has become increasingly more complex and difficult to observe and monitor applications running across multiple containers.
Kentik brings real-world business context to the telemetry we collect and the analytics we provide. That’s the overarching theme I got from Networking Field Day: Service Provider 2. As I watched and listened to each presentation, it was pretty obvious to me that Avi, Steve, Doug, and Nina, all technical powerhouses, were a little less focused on packets and a little more focused on how we can improve network operations and a service provider’s ability to make smart business decisions.
Cloud native and microservice architectures bring many advantages in terms of performance, scalability, and reliability, but one thing they can also bring is complexity. Having requests move between services can make debugging much more challenging and many of the past rules for monitoring applications don’t work well. This is made even more difficult by the fact that cloud services are inherently ephemeral, with containers constantly being spun up and spun down.
Link to Postgre SQL Plugin: https://pandorafms.com/library/postgresql-plugin/
Want to test the power of all-in-one monitoring? Request a free trial of the Enterprise version on our website: https://bit.ly/2O9hoRf
Performance monitoring is an essential part of development. It’s usually one of the first things you’d want to do after setting up an existing project or getting started with a new one. Without monitoring performance, it will be challenging to detect post-development (production issues) issues in your application or how to resolve them. You may end up wasting time attempting to fix something that was never broken.
It’s time for the Black Hat conference in the United States, so we’re onsite meeting with customers and prospects looking to untangle their data from the grip of vendors holding their data hostage. We aim to start a rebellion against this lock-in and encourage customers to focus on radical choice and control with their observability data. Pushing back against “The Empire” is challenging, but you can achieve it with Cribl Stream and Edge.
Editor’s note: This post was updated on August 9, 2022, to include a demonstration of how to enable highly available support for HPA. It was also updated on November 12, 2020, to include a demonstration of how to autoscale Kubernetes workloads based on custom Datadog queries using the new DatadogMetric CRD.
Rails is a Ruby framework for developing web applications. It favors the Model-View-Controller (MVC) architecture and includes generators that create the files needed for each MVC component. Rails applications consist of a database, an application server for running application code, and a web server for processing requests. Rails provides multiple integrations for its supporting database (e.g., MySQL and PostgreSQL) and web server (e.g., Apache and NGINX).
Machine learning has crossed the chasm. In 2020, McKinsey found that out of 2,395 companies surveyed, 50% had an ongoing investment in machine learning. By 2030, machine learning is predicted to deliver around $13 trillion. Before long, a good understanding of machine learning (ML) will be a central requirement in any technical strategy. The question is — what role is artificial intelligence (AI) going to play in engineering?
Telemetry data is a powerful tool for understanding the behavior of complex systems. OpenTelemetry provides a platform-agnostic, open-source way to collect, process, and store telemetry data. This post explores the OpenTelemetry collector architecture, specifically focusing on the Collectors component. We'll look at how collectors work and how they can be used to process telemetry data from any system or application. We'll also discuss some benefits of using OpenTelemetry for your telemetry needs.
Since the beginning of June this year, internet connectivity in the Russian-held Ukrainian city of Kherson has been rerouted through Crimea, the peninsula in southern Ukraine that has been occupied by Russia since March 2014. As I explain in this blog post, the rerouting of internet service in Kherson appears to parallel what took place following the Russian annexation of the Crimean peninsula.
InfluxDB has over a dozen different client libraries to help developers work with time series data in whatever programming language they like best. The Python client library is one of our most popular options. It’s simple to learn, and working with InfluxDB in a language you’re comfortable with helps you get started doing powerful time series analysis quickly.
This is the second post in a 2 part blog series on debugging, monitoring and tracing NodeJS Lambda applications. If you haven’t yet seen part 1, check it out here (it’s a great read!) Now let’s get back into our post with one of the most commonly experienced issues when it comes to Lambda functions, Cold Starts.
MongoDB is one of the most popular NoSQL databases in the world, used by millions of developers to store application metrics from e-commerce transactions to user logins. The MongoDB Enterprise plugin for Grafana — which is available for users with a Grafana Cloud account or with a Grafana Enterprise license — unlocks all of the data stored in MongoDB as well as diagnostic metrics for monitoring MongoDB itself for visualization, exploration, and alerting.
Recently, I was talking to Catchpoint’s High School Summer Interns about what software engineering is all about. They’re spending a week at a time with various Catchpoint departments, and last week was with the Catchpoint Technology Group.
How do you pass context from events that concern Security teams to Development teams who can make changes and address those events? Often this involves a series of meetings and discussion that can take days or weeks to filter down from security event to developer awareness. Compounding the problem, developers generally do not have access to Splunk Core, Cloud or Enterprise indexes used by security teams, and indeed, may use only Splunk Observability for their metrics, traces and even logs.
Everyone in the software industry is in a race to become more agile. We all want to improve the performance of our software development lifecycle (SLDC). But how do you actually do that? If you want to improve your performance, first determine what KPI you’d like to improve. DORA metrics offer a good set of KPIs to track and improve. It started as a research by the DevOps Research and Assessment (DORA) and Google Cloud (which later acquired DORA), to understand what makes high performing teams.
When I had my first child almost six years ago, I expected that most of my time would be spent in the role of a teacher rather than a student. I have two kids now — and I’m certainly teaching them as much as I can as they grow and learn to navigate the world — but if someone were keeping score, my kids might end up on top when it comes to who’s taught who more. Another thing that surprised me is how similar building a family is to build a company from the ground up.
A Two Sigma engineer explains why we built Tensu, an open source TUI (text user interface)-based program for interacting with Sensu Go’s observability pipeline and backend API. In this article we will be putting a spotlight on Tensu, an open source terminal-based dashboard for interacting with and responding to events from the Sensu Go observability pipeline and backend API.
Cloud services were born at the beginning of 2000 with companies such as Salesforce and Amazon paving the way. Simple Queuing Service (SQS) was the first service to be launched by Amazon Web Services in November 2004. It was offered as a distributed queuing service and it is still one of the most popular services in AWS. By 2006 more and more services were added to the offering list.
Organizations across a wide range of industries share a common goal: deploy stable applications that support their customers’ needs. Many of these organizations rely on the Datadog platform to get complete visibility into the health and performance of their applications, and we understand how important it is that our services are reliable. That’s why we leverage our own products to ensure that the platform works as expected.
By combining traffic replay capabilities from Speedscale with observability from Datadog, SRE Teams can deploy with confidence. It makes sense to centralize your monitoring data into as few silos as possible. With this integration, Speedscale will push the results of various traffic replay conditions into Datadog so it can be combined with the other observability data. Being able to preview application performance by simulating production conditions allows better release decisions. Moreover, a baseline to compare production metrics can provide even earlier signals on degradation and scale problems. Speedscale joined the Datadog Marketplace so customers can shift-left the discovery of performance issues.
Most developers are familiar with the concept of tracking an application's performance. We've all had to undertake our performance debugging at some point. It typically occurs when there is a significant problem with potential cost or user impact. We don't take the time to examine the application's performance in various scenarios till after that. Of course, you can and should monitor various components of the application separately.
For smart cities of the future, monitoring infrastructure metrics like fuel and water levels is vital to optimizing operations. Fuelics PC designs and deploys battery-operated narrowband IoT (NB-IoT) sensors that monitor fuel, water, waste, and even parking capacity at the edge, then transmit that data to the cloud for easy viewing and monitoring.
If you were pulled into a meeting right now and asked to give your thoughts on how to achieve better outcomes with monitoring and observability, what would you recommend? Would you default to suggesting that your team improve Mean Time To Detect (MTTD)? Sure, you might make some improvements in that area, but it turns out that most of the opportunities lie in what comes after your system detects an issue. Let’s examine how to measure improvements in monitoring and observability.
Remove any bottlenecks to your network deployments with continuous, end-to-end modern network monitoring software. Modern network architectures like SD-WAN have emerged as game-changing solutions that provide a mechanism for improving traffic management, deployments, and automation.
There is quite a wide range of solutions offered by monitoring as a service to any company, from performing any analysis to detect the root cause of the issue to determining the path of the failure. Here goes…
TL;DR: Dashbird launched observability for AWS AppSync. Additionally to AWS Lambda, SQS, DynamoDB, API Gateway, ECS, Kinesis, Step Functions, ELB, SNS, RDS, OpenSearch, and HTTP API Gateway you can now get detailed insights and metrics in the Dashbird app for AWS AppSync. Since Facebook released its previously internally used query language GraphQL in 2016, it has seen an outstanding increase in adoptions for all kinds of applications.
We’ve integrated IsDown with PagerDuty so you can manage alerts in the same place you manage all your other alerts. The PagerDuty integration is part of our strategy to make it easy to monitor all the business dependencies that companies nowadays have. We live in a world where SaaS rules the world, and companies prefer to buy vs. build. But with that comes the problem of monitoring all these dependencies, which are critical to daily operations.
Operations staff get a hard time. The lowly systems administrator (sysadmin), database administrator (DBA) and all the other operations engineering team members from cyber penetration specialists to user acceptance testing (UAT) and so on are generally unloved.
Hello Retrace and Prefix Customers! In case you missed our Q1 survey invitation, I’m Netreo’s Vice President of Product Management. I joined Netreo for the opportunity to create great business solutions and customer experiences.
Commercial buildings produce 16% of carbon dioxide emissions in the US, and the EPA estimates that 30% of the energy used by these buildings is wasted. Energy efficiency in commercial buildings is a vital aspect of the transition to greener systems worldwide to fight climate change.
The best part of my job is talking with prospects and customers about their logging and data practices. I love to talk about everything they are currently doing and hope to accomplish so I can get a sense of overall goals and understand current pain points. It’s vital to come up with solutions that provide broad value across the enterprise and not just a narrow tactical win with limited impact.
APIs are integral to the success of modern enterprises across a wide range of industries, such as finance, logistics, and manufacturing. They not only enable developers to build powerful business solutions by integrating with external applications, but also facilitate communication between internal services. This means that the ability to build reliable, highly-performant APIs—and govern their behavior and performance—is more important than ever.
We need to remove a vmstorage node from VictoriaMetrics cluster gracefully. Every vmstorage node contains its own portion of data and removing the vmstorage node from the cluster creates gaps in the graph (because replication is out of scope).
Here at Grafana Labs, we’re always looking for ways to provide our customers with a choice of platforms where they can run Grafana Enterprise Metrics (GEM). As part of that mission, we’re pleased to announce that we’ve added Red Hat OpenShift 4.x support to GEM. GEM, as you may know, is a leading enterprise metrics solution.
I care a lot about instrumentation and telemetry and OpenTelemetry, so I was thinking of joining the observability engineering team at my company… but it seems like they spend all their time managing Prometheus and Grafana. I guess I was expecting something very different?
The new release of AppDynamics Cloud addresses one of the most common feature requests we've had: tagging. Let's explore what tags are and how to use them.
In today’s payments ecosystem, the ability to monitor and use payment data effectively represents a real and essential competitive advantage. Intelligent operations should be a strategic goal for the entire company, and when executed properly, will enable you to build a future-proof payment operations infrastructure.
Organizations in every industry are becoming increasingly dependent upon data to drive more efficient business processes and a better user experience. As the data collection and preparation processes that support these initiatives grow more complex, the likelihood of failures, performance bottlenecks, and quality issues within data workflows also increases.
When new web browser versions are released, new bugs are inevitably introduced, which can degrade a website’s performance and increase the overall page load time. This can severely impact a user’s engagement and a business’s bottom line.
Every modern monitoring product will have some capabilities to leverage thresholds of some sort to automatically raise alerts when critical metrics pass a value that indicates something of concern may be occurring, such as a performance slowdown, resource constraint, or availability issue.
Artificial Intelligence (AI) is all the rage these days. Everywhere you look, companies are promising to solve your ills by applying AI to whatever problem you’re trying to solve. It doesn’t seem to matter what area you are in; medical, research, education, technology, software or anything else. Someone, somewhere is offering an AI-based tool that will solve all your problems.
As a pioneer of audio electronics solutions for all in-vehicle communication demands, this organization has delivered an enhanced driving experience to more than 50 million vehicles across the globe. With over 60 years of experience, this organization has been a trailblazer in the audio electronics industry. It has been recognized by Guinness World Records, NASSCOM, and many more for its contributions to the world of audio technology.
Modern Kubernetes environments are becoming increasingly complex. In 2021, Datadog analyzed real-world usage data from more than 1.5 billion containers and found that the average number of pods per organization had doubled over the course of two years. Organizations running containers also tend to deploy more monitors than companies that don’t leverage containers, pointing to the increased need for monitoring in these environments.
Synthetic monitoring is a useful tool that ensures your site is both UP and performs well, and configuration matters. Optimized synthetic monitoring looks for necessary elements along a focused goal pathway. A poorly configured check can add precious seconds to a Transaction and trigger unwanted Global Timeout errors. Today, we’re going to do a deep dive on tips and tricks used by Uptime.com Support and Development teams to improve and optimize the Transaction checks we use everyday.
StatusGator now supports Two-Factor Authentication, often called 2FA, a more secure way of signing into your account. Using an authenticator app such Google Authenticator, Authy, or a password manager like 1Password, you can now protect your StatusGator account with a second authentication factor, a one-time password (OTP) that you enter after signing in.
Joins are a common transformation in any query language, and as part of the effort to make Flux an increasingly valuable tool for our users, the engineers on InfluxData’s query team created, and continue to maintain, two separate join functions. And while these solutions have met some of our users’ needs, they both lack one key feature: support for outer joins.
In today's business and IT environment, marked by constant change and transformation, if you’re a managed service provider (MSP), you are probably struggling to keep up. You’re faced with the need to modernize your operations, but the speed at which you can do so is constrained by years of accumulated complexity and chaos.
Obkio’s Network Monitoring SaaS app was born from a need within the industry to simplify network performance monitoring for modern, decentralized networks. What are some of Obkio’s features, and how can you use Obkio to troubleshoot network problems? We’re showing you how in this network monitoring app tour - told through screenshots.
Google’s Core Web Vitals (CWVs) are used to rank the performance of mobile sites or pages. It’s easy to see when your CWV scores are low, but it’s not always clear exactly why that’s happening. In Honeycomb’s new guide, Tracking Core Web Vitals with Honeycomb and Vercel, you can learn how to capture, analyze, and debug your real-world CWV performance using a free Honeycomb account.
Splunk is honored to be the recipient of a series of six new awards from TrustRadius—all based on customer reviews. In this round, TrustRadius grants its “Best of” Awards to the top three products per Best Feature Set, Best Value for Price and Best Relationship in each respective category.
Today’s user journey is much more complicated than ever and has completely changed the perception of how business critical functions are managed and maintained to support customer expectations for flawless digital experiences. The journey that users take when visiting your website will vary depending on your business model. An e-commerce site, for example, might involve user interactions that go from product selection to shopping cart to payment transaction.
Eventarc is a Google Cloud offering that ingests and routes events between GCP products, such as Cloud Run, Cloud Functions, and Pub/Sub, making it easy to build automated, event-driven workflows in complex environments. By taking care of event ingestion, delivery, authorization, and error handling, Eventarc reduces the development overhead that is required to build and maintain these workflows and helps you improve application resilience.
Moving from a monolith to microservices lets you simplify code deployments, improve the reliability of your applications, and give teams autonomy to work independently in their preferred languages and tooling. But adopting a microservices architecture can bring increased complexity that leads to gaps in your team members’ knowledge about how your services work, what dependencies they have, and which teams own them.
The explosion of APIs, devices, applications, and data sources has complicated the task of building connectivity across the enterprise. As organizations are connecting to applications outside of their four walls, they risk becoming fragmented. Moreover, existing on-premise systems, such as AS/400 and ERPs, need to be able to communicate both internally and externally.
Website performance is important as it directly impacts your business bottom line, this is why picking the right website monitoring service crucial! They perform regular tests and alert you whenever your site is down, making it easier for you to spot track down issues and solve them. There are lots of options out there from simple uptime monitoring or transaction monitoring to complex web performance monitoring solutions.
Today, we're launching ARM support for machines running Alpine Linux. This feature is available for our Ruby and Elixir users! We hope to add support for Alpine Linux ARM to our Node.js package in the future. The ARM CPU architecture is becoming more and more popular. As it powers people's development machines and production servers, we decided to add it to the list of the operating systems we support.
How much does monitoring and observability actually cost us? We all collect logs, metrics, traces, and possibly other telemetry data. Yet, this can get expensive pretty quickly, especially in today’s microservices-based systems.
Before we jump into cloud cost optimization, let us address the elephant in the room. Businesses are moving to the cloud but are struggling with unpredictable cloud bills. If you are a business owner who has moved to the cloud recently, you need to understand each cloud touchpoint and get a transparent view of your cloud services. When it comes to cloud cost optimization, there are many tools and techniques that organizations can adopt. Most of these can only take you so far.
The Apache Tomcat is an open-source implementation of the Jakarta Servlet, Jakarta Server Pages, Jakarta Expression Language, Jakarta WebSocket, Jakarta Annotations and Jakarta Authentication specifications, all being a part of the Jakarta EE Platform. That is the official description of Apache Tomcat.
User experience is the pinnacle of cloud technology. With cloud data centers handling 94 percent of all workloads, cloud optimization is vital. Users need fast, agile, scalable, and stable solutions over the long term. But how do you build these solutions? This is where cloud-native technology comes in. Cloud native computing provides the foundation for building, designing, running, and managing applications in the cloud.
With climate change and other environmental factors causing pollution rates and ground-level Ozone levels to climb, poor air quality is an increasingly growing global problem. In fact, fossil air pollution is responsible for 1 out of 5 deaths worldwide, according to a 2021 study conducted by Harvard University.
With the recent advancements in service delivery through containers, Linux has gained a lot of popularity in cloud computing by enabling digital businesses to expand easily regardless of their size or budget. These advancements have also brought a new wave of attack, which is challenging to address with the same tools we have been using for non cloud-native environments.
In this two post series, we are going to explore some ways to trace and debug NodeJS Lambda applications. Delving into some methods to look further into resources utilized to and some methods to optimize code. AWS Lambda, an event-driven compute service first introduced roughly eight years ago, changed how we build out cloud applications as an industry.
Learn how AppDynamics can give the hiring edge you need to secure top candidates — or your dream job.
The Splunk Operator for Kubernetes team is extremely pleased to announce the release of version 2.0! This represents the culmination of many months of work by our team and continues to deliver on our commitment to provide a high-quality experience for our customers wishing to deploy Splunk on the Kubernetes platform.
The OpenTelemetry Collector is an application written in Go. The GitHub readme does a great job of describing it: So the OpenTelemetry collector is a Go binary that does exactly what its name implies: it collects data and sends it to a back-end. But there’s a lot of functionality that lies in between. What a neat service! A local destination for data that handles the final sending of Open Telemetry information to your back end.
Pandora FMS Open Source is not a freemium software, it is not bloatware nor shareware (*Wink for those born before the 80s). Pandora FMS is licensed under GPL 2.0 and the first line of code was written in 2004 by Sancho Lerena, the company’s current CEO. At that time, free software was in full swing and MySQL was still an independent company, as was SUN Microsystems.
Observable and secure platforms use three connected data sets: logs, metrics, and traces. Platforms can link these data to alerting systems to notify system administrators when an event requires intervention. There are nuances to setting up these alerts so the system is kept healthy and the system administrators are not chasing false positive alerts.
GitHub Actions provides tooling to automate and manage custom CI/CD workflows straight from your repositories, so you can build, test, and deliver application code at high velocity. Using Actions, any webhook can serve as an event trigger, allowing you, for example, to automatically build and test code for each pull request. Datadog CI Visibility now provides end-to-end visibility into your GitHub Actions pipelines, helping you maintain their health and performance.
Improvements in the performance and accessibility of technology have changed our expectations for how applications should work and, by extension, the way we work. For example, three years ago only 6% of workers were remote. According to the 2021 Upwork "Future Workforce Report," that number is now 22%, and remote workers are expected to reach 28% of the workforce by 2025. As more and more people are let loose from their office tethers, they bring with them a belief that their organization's services and applications should work as they did before. What's more, expectations extend from the workplace to the marketplace.
When end-users constantly complain about bad network quality or poor audio video conference experience, you know it's time to shop for a Team's monitoring tool. And your Teams monitoring solution needs to be proactive, provide insight into hybrid work environments, and support real-time diagnosis of network issues for your end-users no matter where they work from. Business leaders rely more than ever on technology teams to deliver a successful company ROI. But problems with complex Teams deployment and unsatisfied workers can lead to increased costs and lower productivity.
Organizations leverage many different cybersecurity and observability tools for different departments. It’s common to see the IT department using Splunk Enterprise, while the SOC uses Exabeam. Both of these tools use separate agents, each feeding different data to their destinations. Normally this isn’t a problem unless you’re talking about domain controllers. Domain controllers only allow a single agent, meaning you can’t feed two platforms with data.
One year ago, we launched Cribl.Cloud as a cloud-hosted option for our industry-leading data pipeline product, Cribl Stream. Customers had a choice of either deploying on-premises with a subscription-based tiered license model or opting for our cloud service with a similar tiered billing model. Fast-forward one year, and Cribl is now a multi-product company with several unique observability products (Stream, Edge, AppScope, and soon Search) to offer our customers.
Usually, maintenance is performed based on two factors first is when asset failure has occurred and second is scheduled maintenance. In both cases, asset maintenance is done when the asset is in good condition or when it is too late. This is where condition-based monitoring maintenance comes into play. This maintenance is proactive, and maintenance is given to assets when it is required. For this purpose, assets are inspected regularly, several asset tracking techniques are used such as IoT.
With the Grafana 9.0 release, we rolled out the new and improved Grafana Alerting experience, which is now the default alerting system across all of our products. Along with introducing significant improvements to Grafana Alerting based on community feedback and more robust alerting documentation to guide our users, we also created easy-to-follow video tutorials to help you get started with creating alerts.
We’ve got exciting news: The Forrester Wave™: End-User Experience Management, Q3 2022 report has been released – and Nexthink has been named a leader in End-User Experience Management! In case you’re unfamiliar, this report provides a comprehensive evaluation of the nine most significant end-user experience management (EUEM) providers by one of the world’s leading research and advisory firms.
Today we’re proud to announce the general availability of best-in-class Synthetic Monitoring capabilities within Splunk Observability Cloud. Now, IT and engineering teams can proactively measure, monitor and troubleshoot their critical user flows, APIs and services, connected across Splunk Observability.
They say, “What happens in Vegas, stays in Vegas,” but I wanted to highlight the role our customers played at last month’s.conf22, our annual users’ event at the MGM Grand. It was awesome meeting customers in person again, and connecting virtually with thousands more. We had a terrific turnout with 8,200+ customers and partners representing 113 countries and more than 6,500 organizations.