Operations | Monitoring | ITSM | DevOps | Cloud

February 2024

What is Dynamic DNS? How it works and how to set it up

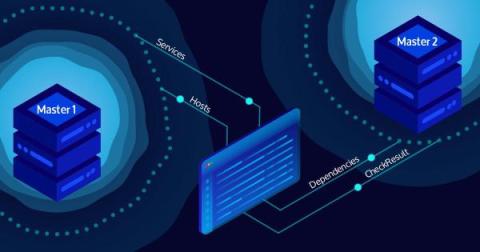
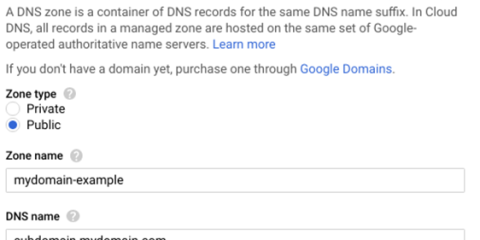
In a DNS, a zone refers to a specific segment of the domain namespace, such as clouddns.manageengine.com or manageengine.com, where each segment can be a unique zone, including top-level domains, like.com. DNS servers translate domain names into IP addresses, assigning a specific IP to each zone as an authoritative response, representing network participants like services or hosts.

Grafana Tempo 2.4 release: TraceQL metrics, tiered caching, and TCO improvements

Grafana Tempo 2.4 is here and comes with a stack of new features and enhancements to help improve performance and operational capabilities. Check out the video above, which highlights the new experimental TraceQL metrics feature that creates metrics from traces, and continue reading to get a quick overview of all the latest updates in Tempo. If you’re looking for something more in-depth, don’t hesitate to jump into the Grafana Tempo 2.4 release notes or the changelog.

How Hard Is It to Migrate to Streaming Telemetry?

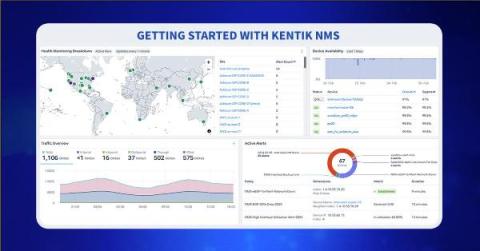
Streaming telemetry is the future of network monitoring. Kentik NMS is a modern network observability solution that supports streaming telemetry as a primary monitoring mechanism, but it also works for engineers running SNMP on legacy devices they just can’t get rid of. This hybrid approach is necessary for network engineers managing networks in the real world, and it makes it easy to migrate from SNMP to a modern monitoring strategy built on streaming telemetry.

Negotiating Priorities Around Incident Investigations

There are countless challenges around incident investigations and reports. Aside from sensitive situations revolving around blame and corrections, tricky problems come up when having discussions with multiple stakeholders. The problems I’ll explore in this blog—from the SRE perspective—are about time pressures (when to ship the investigation) and the type of report people expect.

The Top K12 Software and Tools for IT System Administrators in 2024

K-12 school districts may use 40+ different K-12 software and platforms – from communication tools like Zoom to learning management systems (LMS) such as Instructure or Clever. K-12 software is designed to alleviate a strain on typically small IT departments. Thus, some software was even built by ex-K12 system administrators, such as One To One Plus, to help schools deal with their unique challenges.

Improving mobile performance, from slow screens to app start time

Based on our experience working with thousands of mobile developer teams, we developed a mobile monitoring maturity curve here at Sentry. We hypothesized that once teams achieved stability and were no longer firefighting and fixing crashes, they’d shift to streamlining workflows and eventually focus more on optimizing mobile app performance. In a recent workshop, we asked mobile devs where they fell on the curve. The results were surprising.

Is It Necessary to Monitor Business Calls and Messages?

Imagine a scenario in which you take a call from a customer who tells you that a customer service agent promised them a full refund. This confuses you because the reasons do not meet the criteria for a refund. However, you have no evidence to prove the customer is telling the truth. Now, if only you could check what had been said on the call. Enter call monitoring. The global call center market alone is expected to reach $741.7 billion by 2030.

Tap Into Fully Integrated Hybrid Cloud Monitoring for Faster Resolution

Late last year we announced ScienceLogic’s Hollywood release, aimed at accelerating AIOps adoption through its human-friendly platform. By integrating generative AI insights with observability and automation, we took a big step forward in simplifying the work of IT teams. A key component of this goal was upgrading SL1’s features, specifically our now fully integrated hybrid cloud monitoring for faster troubleshooting.

Upgrade to SCOM 2022: Choosing between in-place upgrade and side-by-side installation

Upgrade to SCOM 2022: Choosing between in-place upgrade and side-by-side installation With mainstream support for SCOM 2019 ending on the 9th of April 2024, it is time to start planning for the upgrade to SCOM 2022. However, there are several factors to consider before making an upgrade. One of them is whether you should choose an in-place upgrade or a side-by-side installation. In this blog post, we aim to give you some important aspects to evaluate when making your decision.

How to Manage Kubernetes Resources and Costs with Grafana Cloud

To help optimize your Kubernetes resources (and the costs associated with them), Kubernetes Monitoring in Grafana Cloud offers features to manage and monitor Kubernetes resources and, in return, your observability bills. In this video, we'll show you how Kubernetes Monitoring helps you: ☁️ Grafana Cloud is the easiest way to get started with metrics, logs, traces, dashboards, and more. We have a generous forever-free tier and plans for every use case.

New TraceQL metrics feature in Grafana Tempo 2.4

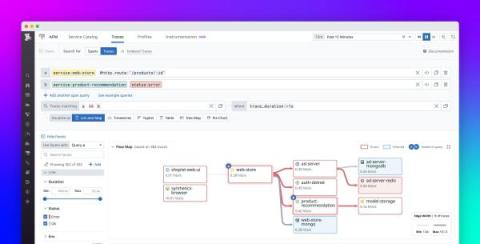
In this video, you'll see a deep dive demo into the experimental TraceQL metrics feature in Grafana Tempo 2.4. We'll show you how to use TraceQL metrics to do both root cause and impact analysis as well as other use cases, such as determining how many database queries are downstream of your application. ☁️ Grafana Cloud is the easiest way to get started with metrics, logs, traces, dashboards, and more. We have a generous forever-free tier and plans for every use case.

What's New in Sysdig - February 2024

Hey there! I’m Devin Limo, a Senior Customer Solutions Architect here at Sysdig. February was a whirlwind, and we’ve got some awesome updates you don’t want to miss. From deep dives into critical vulnerabilities to game-changing product updates, we’ve got you covered. Hot off the press: Falco has graduated within the Cloud Native Computing Foundation (CNCF)!

The Top Five Benefits and Challenges of Hybrid Cloud

In recent years, hybrid cloud environments have emerged as a popular, if not de facto, choice for many organizations seeking flexibility, scalability, and security in their IT infrastructure. Industry research firm Mordor Intelligence pegs hybrid cloud as a nearly $130bn market in 2024, growing at a better than 22% clip over the next five years.

How to detect and overcome Kubernetes CPU Throttling

A few days ago, I challenged myself: Could I create a CPU throttling monitor without using StackState's docs page? I'll go a bit deeper into CPU throttling later, but first: Why this mission? At StackState, we believe that every software developer should be able to observe the health and reliability of their own application — quickly and easily.

Demystifying Java Lambda Expressions

SRE and IT Operations play a critical role in ensuring reliable, high-performance applications. Yet, SREs (Site Reliability Engineers) often face ‘thrown-over-the-wall’ code deployments to operate without having insights into the code-level features. In my previous article (“Is your Java Observability tool Lambda Expressions aware?”), I delved into one such code-level feature: Java lambda expressions which replace anonymous inner classes.

Decoding .NET8: Unveiling Cloud-Native Observability

The.NET programming language is taking cloud native deployment and observability seriously, and most notably with the recent announcement of.NET Aspire stack unveiled at the recent.NET Conf 2023. In the latest episode of OpenObservability Talks, we reviewed the journey to making.NET a “by default, out of the box observable platform,” as ASP.NET Core creator David Fowler put it.

In Their Own Words: Three Ways NetOps Delivers Value to Customers

Now more than ever, modern networks play a pivotal role in today’s business operations. However, this increased importance comes with a challenge: Modern networks are becoming increasingly complex and heterogeneous. Network managers need to ensure optimal performance across various domains—from the data center to multi-cloud and software-defined networks. This requires the consolidation of vast amounts of data from across multi-vendor networks, including environments managed by third parties.

Is Waiting for the Thaw Unbear-able?

It’s not new news that organizations are producing more data than ever. But, in order to take advantage of this data, it needs to be collected, stored, retained, and then, at some point, analyzed. Most analysis tools also act as the retention point for this data. While this may (at first) appear to be the best option for performance, it quickly creates significant problems. First, those systems were never designed for the scale of today’s growing volume of data, currently at a 28% CAGR.

Getting started with Pyroscope: Intro to continuous profiling

Grafana Pyroscope is a multi-tenant continuous profiling aggregation system, aligning its architectural design with Grafana Mimir, Grafana Loki, and Grafana Tempo. It facilitates the ingestion, storage, and querying of profiles and seamlessly integrates with Grafana, enabling a cohesive correlation of profiling data with existing metrics, logs, and traces.

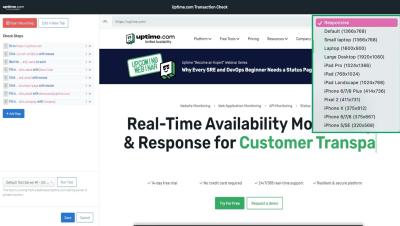
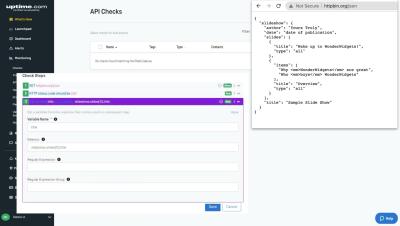
Using the Uptime com Transaction Recorder

Check out the Uptime.com chrome-based Transaction Recorder to simplify your synthetic monitoring. Quickly setup checks to monitor your forms, login processes, and payment process simply by mimicking the click actions of your users. For more information on the Transaction check and other Uptime.com features, check out the rest of our video library or view our support documentation linked below.

Step-by-step Guide to Monitor Riak Using Telegraf and MetricFire

Monitoring your databases is essential for maintaining performance, reliability, security, and compliance of your infrastructure. It allows you to stay ahead of potential issues, optimize resource utilization, and ensure a smooth and efficient operation of your database system. Effective monitoring of Riak involves collecting, analyzing, and acting on a variety of metrics and logs.

Mastering IPM: Key Takeaways from our Best Practices Series

As we conclude our Mastering IPM blog series, it's time to reflect on the wealth of insights we shared. From delving into the critical layers of the Internet Stack to navigating the intricacies of data analysis, each installment has provided valuable perspectives on optimizing digital experiences through Internet Performance Monitoring (IPM). Now, let's distill the key takeaways from the series.

How to set up Azure cost alerts for effective cloud management with Turbo360?

Azure Cost Management is crucial for organizations using Microsoft Azure cloud services. It plays a pivotal role in ensuring efficient resource allocation, cost optimization, and overall financial control. We speak to a number of customers who have requirements like below: Turbo360 Azure Cost Management tool helps you to achieve effective cost management of your Azure costs.

Webpages Are Getting Larger Every Year, and Here's Why it Matters

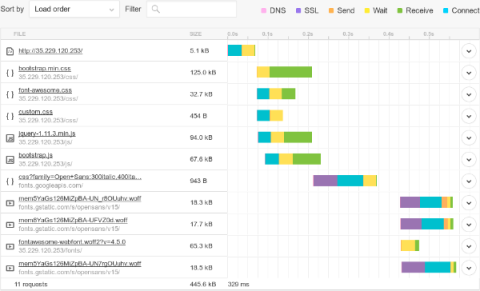
Average size of a webpage matters because it correlates with how fast users get to your content. People today have grown to expect good performance from the web. If your website takes more than 2.5 seconds to load, your users will probably never return to you again. Further, the more data your webpage needs to download, the longer it will take—particularly on slow mobile connections. Balancing a rich experience with page performance is a difficult tradeoff for many publishers.

Enterprise Cloud Security: Safeguarding the Future

Businesses incline toward cloud computing because it offers various benefits, including pay-as-you-go, rapid scaling up, and the ability to utilize resources instantly with downtime. However, everything we do in the information technology business must address cybersecurity. This blog will cover the influence of the cloud in safeguarding enterprises. Enterprise cloud security covers the compliance and strategies to protect cloud-based digital assets.

SigNoz Launch Week - Day 3 - Frontend Monitoring

Welcome to SigNoz Launch week! In day 3 we will focus on monitoring frontend with SigNoz. We will take examples on how to monitor web vitals of your application and monitoring errors in client applications. This will be followed by a discussion with our maintainers on nuances of building performant frontend application for data dense products like SigNoz. Do tune in!

Start Monitoring Third-Party Outages in Opsgenie

In today's digital world, we rely a lot on third-party services. These services are great because they help us grow, be more flexible, and work more efficiently. However, they also make things more complicated and risky. If a service we depend on stops working, it can cause big problems. To deal with this, we're excited to introduce a new feature that connects Opsgenie with IsDown.

Synthetic monitoring 101: A comprehensive guide to synthetic monitoring

Synthetic monitoring or synthetic testing is a way of ensuring the performance and availability of applications, websites, and IT infrastructure by creating simulated user interactions and generating artificial transactions that mimic real user behavior. This helps organizations preempt issues on response times and application functionalities by emulating user behavior to measure response times, identify potential bottlenecks, and troubleshoot performance issues before they impact actual users.

Managing distributed networks? Here's how a comprehensive IPAM solution simplifies the task

As organizations expand globally in the digital realm, distributed networking is inevitable. To ascend the growth ladder, they must embrace both digital and geographical evolution. This means, as IT infrastructure evolves, organizations are required to adapt. This includes monitoring, modernizing, and streamlining processes and resources across growing system requirements, application stacks, diverse protocols, and security defenses.

Graylog Parsing Rules and AI Oh My!

In the log aggregation game, the biggest difficulty you face can be setting up parsing rules for your logs. To qualify this statement: simply getting log files into Graylog is easy. Graylog also has out-of-the-box parsing of a wide variety of common log sources, so if your logs fall into one of the many categories of log for which there is either a dedicated Input; a dedicated Illuminate component; or that uses a defined Syslog format; then yes, parsing logs is also easy.

Closing the Interconnection Data Gap: Integrating PeeringDB into Kentik Data Explorer

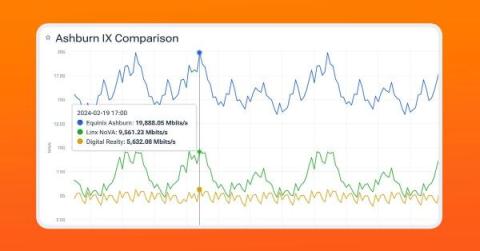
Kentik users can now correlate their traffic data with internet exchanges (IXes) and data centers worldwide, even ones they are not a member of – giving them instant answers for better informed peering decisions and interconnection strategies that reduce costs and improve performance.

Icinga 2 API and debug console

Have you ever experienced configuration issues, such as notifications not being sent as expected or apply rules not matching all expected objects, probably due to an incorrectly set custom variable? Icinga 2 has several options to assist you in such situations. Last time, Julian demonstrated how to analyse such problems using the icinga2 object list command. Today I will show you how to interactively investigate your problem using the mighty Icinga 2 debug console.

Navigating User Experience, Performance & Security

In the ever-evolving digital landscape, where users expect lightning-fast, seamless experiences, a thoughtful balance needs to occur between creating a unique website experience and achieving optimal performance whilst tackling the mounting threats posed by cybercriminals. This predicament places website owners and developers at a crossroads: How can they achieve great user experience (UX) while upholding stringent security protocols with a well-performing website?

Detecting Cryptojacking with Progress Flowmon

In the ever-evolving landscape of cybersecurity threats, cryptojacking has emerged as a stealthy and financially motivated attack method. In attacks of this type, cybercriminals hijack servers (or endpoint devices) to use the computing resources to “mine” cryptocurrencies. They get a financial benefit from this activity when they sell the newly minted currencies.

Revolutionizing the Microsoft Teams Experience: Yorktel and Martello Join Forces

In a strategic move aimed at redefining the Microsoft Teams experience, Yorktel, a global managed services provider, announces its dynamic collaboration with Martello’s Vantage DX. This innovative partnership is not just about adding a solution but about Yorktel’s commitment to enhancing their existing offering through the power of Vantage DX.

Critical Automation: Anomaly Detection for Application Observability

There’s no debate — in our increasingly AI-driven, lean and data-heavy world, automating key tasks to increase effectiveness and efficiency is the ultimate name of the game. No matter what job you hold today, you’re likely being pushed to not only do more with less, but also perform your work with a tighter focus on specific outcomes and SLOs.

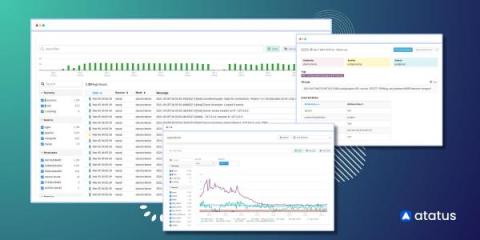
Log Management Made Easy: Top 10 Logs Monitoring Solutions

In contemporary enterprise operations, log management tools have become indispensable for optimizing performance. Among these tools, selecting one with a proficient logs user interface (UI) holds paramount importance. A quality log management tool not only gathers logs but also presents them in a well-organized manner, facilitating easy interpretation for the user.

Understanding How OpenTelemetry can help with PCI Compliance

The early days of e-commerce on the internet resembled a digital Wild West, characterized by unencrypted form inputs and clear-text storage of sensitive information. Fast forward to today, and the landscape of online payments has transformed dramatically, bolstered by industry-driven guide rails like the Payment Card Industry Data Security Standard (PCI DSS). These standards ensure that consumer details are stored appropriately and handled with the utmost care and security.

Evaluating Traffic at IXes and Data Centers with PeeringDB Filters in Kentik

Kentik Product Marketing Manager Lauren Basile shows how to leverage Kentik's integration with PeeringDB to enhance network performance, reliability, and cost efficiency. Lauren demonstrates practical examples of how network professionals can use PeeringDB filters in Kentik to make informed decisions about internet exchanges and data centers, optimize peering arrangements, and uncover potential cost savings.

Introducing Next-Level Innovations on Virtana's AIOps Platform

In an era defined by rapid technological advancements and complex digital infrastructures, implementing advanced capabilities is how IT leaders stay ahead of the curve. We are at the forefront of this revolution, continuously evolving to meet and exceed the demands of modern IT landscapes. Today, we are thrilled to announce a series of innovative features and capabilities designed to transform how organizations manage and optimize their digital environments.

Kubernetes Monitoring: How to Get Started in Grafana Cloud | Grafana

Start monitoring your Kubernetes cluster in less than 3 minutes! This is a quick but comprehensive guide for getting started with Kubernetes Monitoring in Grafana Cloud. Ideal for both beginner and experienced users, you'll see a step-by-step approach for installing the Helm chart on your Kubernetes cluster so you can validate the health and integrity of your infrastructure. Helpful links: ☁️ Grafana Cloud is the easiest way to get started with metrics, logs, traces, dashboards, and more. We have a generous forever-free tier and plans for every use case.

Much Ado About OpenTelemetry

There is so much good work that OpenTelemetry has done in the software industry, specifically around the domain of observability, in the last five years. Bringing users and vendors together to define the future of telemetry? Check! Unify logs, traces, and metrics under a completely vendor-neutral API? Check! Deprecate other standards by bringing their collaborators to the table to ensure their use cases are met? CHECK!

Master Class: Monitoring from Your Users Perspective

Over the past decade, not only has the Internet and the World Wide Web evolved, but also the way websites & applications are developed and experienced by end users. From monolithic to microservice-based structures and from data centers to cloud computing, we’ve come a long way. We’re living in the era of the end-user experience. It’s never been easier for a customer to find another solution if your business isn’t meeting their expectations.

How Complyt used Datadog's Cloud Cost Management to reduce their cloud spend

Learn how the team at Complyt was able to integrate Cloud Cost Managament in a matter of hours and quickly pinpoint underutilized services to cut their cloud spend in half. CCM delivers cost data where engineers work and with resource-level context like CPU, memory, and requests — easily scoped to their services and applications — so that they can take action and spend effectively.

Easy guide to Monitoring Puppet with Telegraf and MetricFire

Monitoring your Puppet runs and automations is essential for maintaining performance, reliability, security, and compliance of your infrastructure. It allows you to stay ahead of potential issues, optimize resource utilization, and ensure a smooth and efficient operation of your database system.

Beyond Logs: Navigating Entity Behavior in Splunk Platform

Identifying bad actors within your organization often feels like a complicated game of hide and seek. A common comparison is that it's akin to finding a needle in a haystack. So, if the bad actor represents the 'needle' and your organization the 'haystack,' how would you uncover these bad actors? Perhaps the quickest way to find the needle is by burning the haystack. Alternatively, dumping the hay into a pool of water and waiting for the needle to sink to the bottom could also work.

Top 5 Outcomes CIOs Need to Accomplish by 2025: Driving Business Value Through Technology

In January 2024, I published findings from some of my recent research as, “Top 5 Outcomes CIOs Need to Achieve by 2025: Driving Business Value Through Technology.” By focusing on these five key outcomes, CIOs can ensure that their technology investments directly contribute to business growth, resilience, and competitive advantage in the years leading up to 2025.

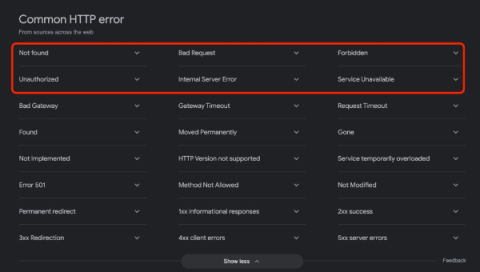
The Five Most Common HTTP Errors According to Google

Sometimes when you try to visit a web page, you’re met with an HTTP error message. It’s a message from the web server that something went wrong. In some cases, it could be a mistake you made, but often, it’s the site’s fault. Each type of error has an HTTP error code dedicated to it. If you try to access a non-existing page on a website it leads to a 404 error. Now, you might wonder, which are the most common HTTP errors that people encounter when they surf the Web?

A Beginner's Guide to Using CDNs

Websites have become larger and more complex over the past few years, and users expect them to load instantaneously, even on mobile devices. The smallest performance drops can have big effects; just a 100ms decrease in page load time can drop conversions by 7%. With competitors just a click away, organizations wishing to attract and retain customers need to make web performance a priority. One relatively simple method of doing this is by using content delivery networks (CDNs).

OpenTelemetry in Production: A Primer

At observIQ, we’re big believers and contributors to the OpenTelemetry project. In 2023, we saw project awareness reach an all-time high as we attended tradeshows like KubeCon and Monitorama. The project’s benefits of flexibility, performance, and vendor agnosticism have been making their rounds; we’ve seen a groundswell of customer interest.

FOSDEM - Costa Tsaousis: Netdata Open Source Distributed Observability Pipeline Journey & Challenges

FOSDEM - Costa Tsaousis: Netdata Open Source Distributed Observability Pipeline Journey & Challenges ABSTRACT: Netdata is a powerful open-source, distributed observability pipeline designed to provide higher fidelity, easier scalability, and a lower cost of ownership compared to traditional monitoring solutions. This presentation will offer an in-depth overview of the journey we've undertaken in building Netdata, highlighting the challenges we've faced and the innovative solutions we've developed to address them.

Comparing NestJS and ExpressJS

Having delivered numerous applications, prototypes, and demos over the years, I’ve developed a deep appreciation for how robust development frameworks can significantly contribute to Speed to Delivery Time (SDT). This metric is vital in the fast-paced software industry, where the ability to bring scalable and maintainable applications to market quickly can set a project apart.

The Top 10 Server Monitoring Tools

As organizations and their IT infrastructure become more complex the necessity for effective server monitoring grows. Companies are deciding to operate extensive server networks, utilizing both cloud infrastructure and on-premises data centers due to the ever-increasing demand. Today’s users demand as good as 100% uptime for the services they use, meaning optimal and well–established network connections are vital in order to handle large amounts of users and transactions.

DNS Security: Fortifying the Core of Internet Infrastructure

In an era marked by escalating cyber threats, Domain Name System (DNS) infrastructure security has become a key concern for IT organizations worldwide. Attacks related to DNS infrastructure, such as DNS hijacking, DNS tunneling, and DNS amplification, are on the rise. Many organizations find themselves questioning the robustness of their DNS security protocols.

How to Detect Infrastructure Anomalies with Kubernetes Monitoring in Grafana Cloud | Grafana

This video provides a comprehensive guide to initiating Kubernetes monitoring within Grafana Cloud, detailing a straightforward, step-by-step approach for installing the Helm chart on your cluster. It further ensures that you can validate the health and integrity of the data underpinning the solution, setting a solid foundation for effective monitoring practices. Ideal for both beginners and experienced users, this tutorial is designed to streamline your monitoring setup process with precision and ease.

OpsRamp and the Rise of Observability

As IT environments become more complex, cloud-based and divided across microservices, containers, and serverless computing, opportunities to optimise efficiency and improve performance open up. From cost and capacity savings to improving the speed, responsiveness and reliability of apps, it’s clear businesses are increasingly making the connection between IT and commercial outcomes.

The Next Generation of Papertrail is Here!

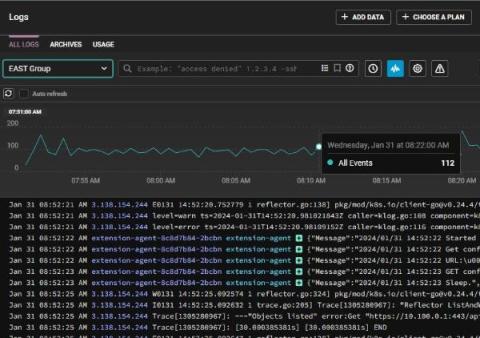
We are excited to unveil the next generation of SolarWinds® Papertrail™, SolarWinds Observability® logging. More powerful and faster than ever, the next generation of Papertrail, SolarWinds Observability logging aggregates log data from applications, services, infrastructure, databases, and network devices across both cloud-based and on-premise systems.

Navigating Your Microsoft Teams Migration: How Vantage DX Shields Your Investment

Migrating to Microsoft Teams can be fraught with unexpected challenges that threaten to derail your project’s momentum and inflate costs. Typical issues during a Teams migration effort include timelines that perpetually stretch, unforeseen complications during software rollouts, and the dire consequences of inadequate network infrastructure. Especially with Teams’ reliance on high bandwidth due to integrated video and voice features, preparing your network to handle these demands is crucial.

Cultivating Your Tech Garden: Enriching APM with Synthetic Monitoring

Welcome to the Tech Garden, a place where our monitoring tools, like to diverse flora, contribute to a thriving digital ecosystem. Our journey starts with the foundational roots of Application Performance Monitoring (APM), crucial for initial growth and stability, like the roots beneath our fruit trees.

Cribl Search and Common Schema: Faster, More Accurate Detections

Are you drowning in data from disparate sources? Are you struggling to analyze it efficiently, sift through different formats, and catch crucial signals? You’re not alone. Cribl Search and Cribl Stream is a powerful combo that lets you unlock insights from vast data volumes – regardless of their source or format. Say goodbye to siloed searches and hello to holistic analysis.

How SOCAR is driving visibility using Sumo Logic

SOCAR needed an observability solution that could parse logs, monitor ephemeral infrastructure in Kubernetes and ensure high visibility into their application, all at a price that fit their budget. Sumo Logic checked all those boxes and has already boosted team collaboration. Learn more about their purchase decision and how they're already making unexpected discoveries.

Grafana Cloud updates: AI for incident response, Enterprise plugins, Kubernetes alerting, and more

At Grafana Labs, we’re constantly shipping new features to help our users get the most out of Grafana Cloud. In case you missed it, here’s a roundup of all the Grafana Cloud news, updates, and improvements you should know about.

Troubleshooting MacOS Wifi Latency Spikes Due to Location Services

Remote work and work-from-home comes with its own set of challenges, and unexpected Wi-Fi hiccups can be a major roadblock. One often-overlooked culprit behind those latency spikes on your MacOS device? The unassuming Location Service. In this blog post, we'll shed light on how Location Service interactions might be causing disruptions in your Wi-Fi connectivity. More importantly, we'll equip you with practical solutions to restore the smooth flow of your remote work.

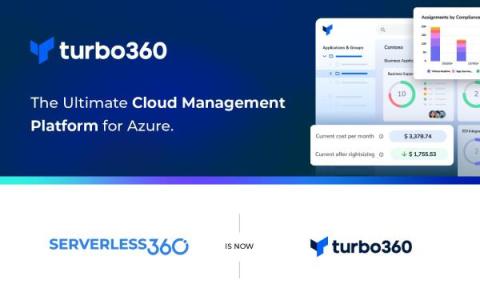
Turbo360 Unveiled: The Ultimate Cloud Management Platform for Azure

Today, we are thrilled to announce our brand-new product, “Turbo360”—an ultimate Cloud Management Platform for Microsoft Azure. It’s not a completely new product; we are rebranding and repositioning our successful product Serverless360, to Turbo360 to serve a bigger market and customer base. Serverless360 has evolved into a full-blown cloud management platform in the past seven years.

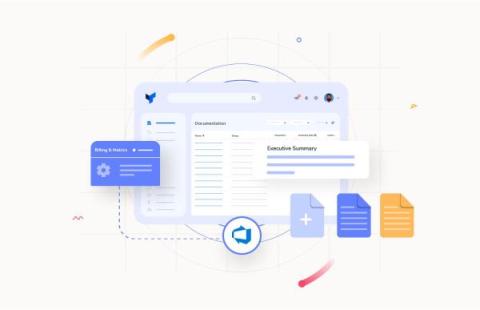
Generating Azure documentation from an Azure DevOps Pipeline

This week, I met with one of our partners, and my good friend Rik Hepworth asked a great question. This was: “Mike, we really like Azure Documenter in Turbo360, but what would be awesome is if I can generate the documentation from a DevOps pipeline so each time we deploy updates to Azure, we can regenerate the documentation” In this article, we will look at how to do it.

Cloud Infrastructure Guide for Businesses

Many businesses use the cloud infrastructure to save on the maintenance cost of physical hardware and other expenses. Further, it provides organizations various services, from computing power to storage, to help them stay competitive and flexible. Too much competition in the market results in the adaptation of more and more technology, eventually leading to excessive data. You can no longer rely only on devices to store large volumes of data as it won’t be enough and can result in fraud and breach.

SigNoz Launch Week - Day 1 - Logs Explorer

Welcome to SigNoz Launch Week 1.0! This is our first launch week, and we’re excited to introduce you to some cool new features in SigNoz. We ship fast but often miss sharing the story behind these features with our community. Launch week for us is an opportunity to share the behind-the-scenes of new features that we have built in the recent past. Our open-source maintainers will share the story on the whats, whys, and hows of new upgrades to SigNoz!
Sponsored Post

Overcoming SAP S/4HANA implementation challenges with Avantra

SAP S/4HANA is one of the most innovative ERP solutions in the software industry due to its real time insight delivery and high efficiency. As an in memory data platform, SAP S/4HANA simplifies administration and management in the IT space. It allows users to centralize the network resources and hardware to have easier accessibility. SAP S/4HANA facilitates bringing multiple systems' transactional and analytical abilities into one place, leading to better decision making, which can be cost effective in the long run. Users can also generate reports and execute decisions based on real time data.

Comparing OpenTelemetry and Jaeger | Key Features

Jaeger and OpenTelemetry are essential technologies that greatly improve the observability of software applications. OpenTelemetry is a vendor-neutral platform that makes it easier to create and collect telemetry data, including logs, traces, and metrics. Its extensive backend integration adaptabilities allow it to fit into a wide range of infrastructures. However, Jaeger is an expert in distributed tracing within microservice environments.

What is the OpenTelemetry Transform Language (OTTL)?

The OpenTelemetry Transformation Language, or OTTL for short, offers a powerful way to manipulate telemetry data within the OpenTelemetry Collector. It can be leveraged in conjunction with OpenTelemetry processors (such as filter, routing, and transform), core components of the OpenTelemetry Collector. It caters to a range of tasks from simple alterations to complex changes.

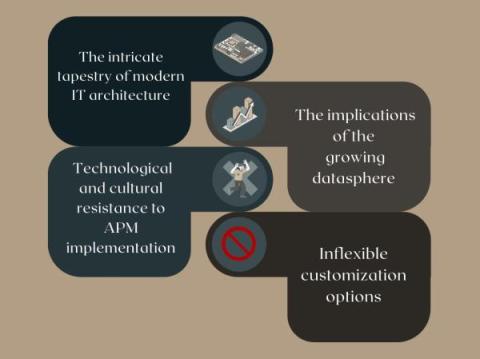
APM From a Developer's Perspective

In twenty years of software development, I did not have the privilege of being on call, of tending to my software in production. I’ve never understood what “APM” means. Anybody can tell me what it stands for—Application Performance Monitoring (or sometimes, the M means Management)—but what does it mean? What do people use APM for?

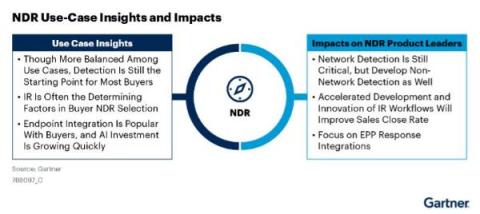
Gartner Lays out Three Use Cases of Network Detection and Response (NDR) Adoption

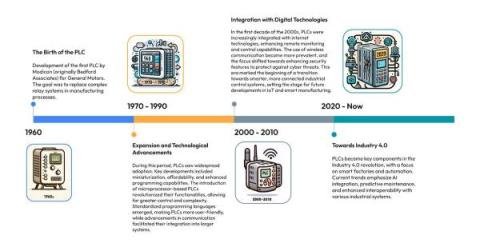
The Gartner recent report, “Emerging Tech: Top Use Cases for Network Detection and Response”, lays out three primary use case drives, which include: Before we dive deeper into Gartner findings, let’s talk about NDR from a high level.

Build better Service Level Objectives (SLOs) from logs and metrics

In today's digital landscape, applications are at the heart of both our personal and professional lives. We've grown accustomed to these applications being perpetually available and responsive. This expectation places a significant burden on the shoulders of developers and operations teams.

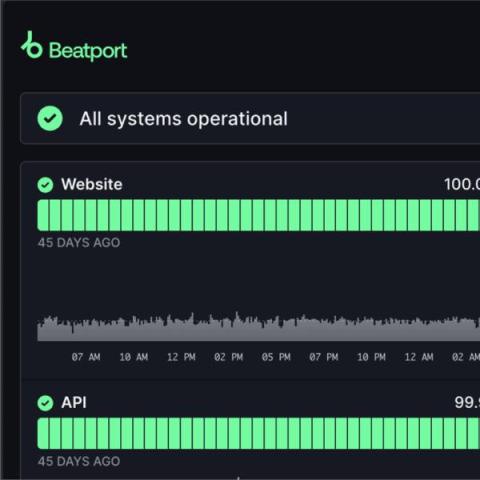
A Comprehensive Guide to Status Pages in 2024

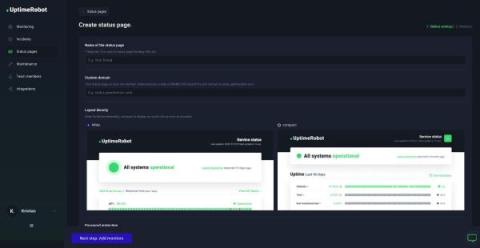
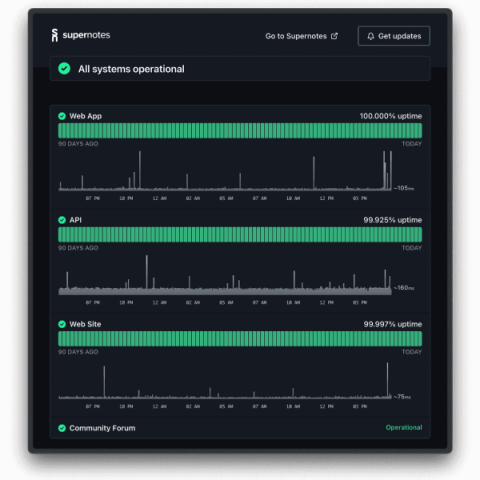
Status pages are one of the best additions to your monitoring that can significantly reduce the number of support tickets or improve the efficiency of your teams and processes. There are multiple benefits hidden in creating a custom status page, so let’s take a look at all of them and how you can implement them immediately.

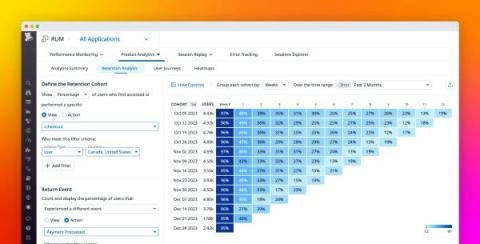
Troubleshoot anomalies in workload performance with Watchdog Insights and Alerts for Live Processes

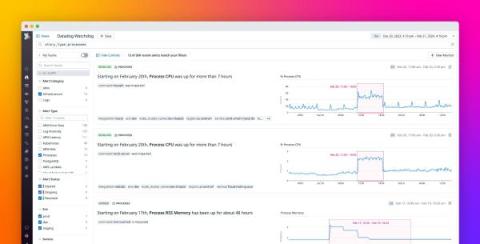
Processes—the service workloads that run on your infrastructure—are the building blocks of your application, and it’s critical to know how well they operate at every level of the stack. Degraded process performance can lead to downtime for your mission-critical services, resulting in loss of customer trust and potentially impacting revenue for the business.

Mastering Predictive Analytics: Powering Engines for Continual Insight

Predictive analytics are a powerful tool, enabling organizations to make informed data-driven decisions. These tools are far-reaching and can deliver impactful results, either in the long term, like supply chain management and overall equipment effectiveness, or in the short term, like anomaly detection. Let’s take a look at what predictive analytics are and how to power predictive analytics engines for continued, meaningful insight into your data and operations.

Critical Requirements for Rapid and Accurate Isolation of Issues in Modern Networks

NetOps by Broadcom addresses the three fundamental requirements that enable NetOps teams to speed issue detection and resolution. A highly scalable, unified data model, advanced analytics and intelligent triage workflows. The solution presents operators with the intelligence they need, within intuitive, easy-to-understand troubleshooting workflows. The solution minimizes alarm noise, so NetOps teams can quickly diagnose issues and identify the root cause. For more info, visit broadcom.com/netops.

Broken windows: Why the 'Single Pane of Glass' is Impossible

It was only as I started to study information theory that I truly understood how nonsensically the computer worked in Star Trek: The Next Generation. Decades before voice assistants and at a time when only the most basic language parsing existed in practice, the computer on Star Trek could always give you the answer you wanted. No one ever spent any time clicking into multiple windows to find an answer, and the display always gave information that could be easily summarized in words.

Data Here, Data There, Data Everywhere: the Benefits of Routing Data With Cribl

As an organization, you likely have many choices on where to store, analyze, and correlate your data. Those choices may change or iterate over time, so having an easy way to route data is needed. Enter Cribl Stream, which can route your data where it needs to go and save some effort, time, and money. It can help with organizational-wide initiatives like migrations and consolidations but can also help with smaller-scale initiatives and your day-to-day tasks of simply getting data in.

What You Need to Know About ITIL for Service Management

As the person on the front lines, you know that providing the best service possible can be what makes your ITSM organization succeed. Every day, you work to build the relationships that help your organization create value for end-users. However, when you have inefficient processes, you end up having to be the person responding to an upset user.

Can gzip Compression Really Improve Web Performance?

The size of the web is slowly growing. Over the past decade, the average webpage weight grew by 356%, from about 484 KB to 2.205 MB. Considering 800 KB was the average size of a website in 2012, that’s an enormous difference. While it’s true that the global average internet speed is increasing, users with slow, limited, or unreliable internet access often end up waiting. The question is, how do we keep websites fast even as they get bigger and bigger?

Website tracking and all you need to know

All you need to know about website tracking Website tracking refers to the practice of monitoring and collecting data on users' activities and behaviors when they visit a website. Various tools and technologies are employed to track and analyze this information. The primary goal of website tracking is to gain insights into user interactions, preferences, and overall engagement with a website and then fine-tune the page based on it.

The Best 40+ Resources, Tools, Websites, Forums, and Communities for K-12 System Administrators

Specialized resources for K-12 sysadmins can provide targeted solutions and insights tailored to the unique challenges of educational IT environments. These resources, ranging from K-12 forums and blogs to specific management tools, offer knowledge on best practices, emerging technologies, and troubleshooting strategies directly applicable to schools. Firstly, there are software and platforms that K-12 sysadmins can incorporate into their IT infrastructure, such as StatusGator and StatusHub.

Custom integration support in OpManager is set to revolutionize your IT workflows

IT operations are the most efficient when their respective IT teams are less stressed. However, that’s a tough ask considering the amount of work needed to collaborate across multiple tools, correlate events, and update IT infrastructures.

Time Series Data and OLAP: Why You Should Use InfluxDB for Real-Time Analytics

Picture a bustling control room at a major aerospace company, where engineers and executives monitor aircraft performance, analyze flight data, and make critical decisions in real-time. In this dynamic environment, the ability to harness the power of real-time analytics becomes paramount. This is where InfluxDB 3.0, the latest version of InfluxData’s time series database, delivers an innovative edge to organizations with time-critical analytics needs.

Part 1: Infrastructure Monitoring - Getting Started

The term "Infrastructure" encompasses various components, including hardware, software, networks, servers, databases, and more. Collectively, these components form the foundation for an organization's digital services and operations. However, the intricate nature of these systems also introduces challenges related to performance bottlenecks, potential faults, security vulnerabilities, and the ever-present need for scalability.

Best 7 Free Network Monitoring Tools

Have you ever heard the phrase, “Better safe than sorry”? That’s the mentality you should have when considering your organization’s network. From performance optimization to data management, you should have eyes on every single aspect of your IT infrastructure to keep it running as smoothly as possible. Here are seven free network monitoring solutions that give you the tools to optimize your network environment and support your operational needs.

The Importance of DevOps Analytics

Traditional software development and infrastructure management module for production and service has been overtaken by the quicker-paced delivery of services and applications, DevOps. This outperformance by DevOps in response to the traditional approach has led to numerous organizations making DevOps a fundamental part of the company.

How to monitor etcd with Datadog

So far in this series, we’ve walked through key etcd metrics and tools you can use to monitor etcd metrics and logs. In this post, we’ll show you how you can monitor etcd with Datadog, including how to: But first, we’ll show you how to set up and configure the Datadog Agent and Cluster Agent to send etcd monitoring data to your Datadog account.

Tools for collecting etcd metrics and logs

In Part 1 of this series, we looked at how etcd works and the role it plays in managing the state of a Kubernetes cluster. We also explored key etcd metrics you should monitor to ensure the health and performance of your etcd cluster. In this post, we’ll show you how you can use tools like Prometheus, Grafana, and etcdctl to collect and visualize etcd metrics. We’ll also show you how to collect etcd logs that provide context for those metrics.

Key metrics for monitoring etcd

Etcd is a distributed key-value data store that provides highly available, durable storage for distributed applications. In Kubernetes, etcd functions as part of the control plane, storing data about the actual and desired state of the resources in a cluster. Kubernetes controllers use etcd’s data to reconcile the cluster’s actual state to its desired state. This series focuses on monitoring etcd in Kubernetes.

How to monitor a home VPN from anywhere with Grafana Cloud

I’m a senior solutions engineer here at Grafana Labs, but I recently found myself trying to solve a real-world problem in my homelab. The issue was, I have some services running there and I want to be able to access my home network when I’m away. Of course, I had to make sure my network remains safe when I do that, so I decided to deploy a simple and secure VPN.

7 ways to find and fix digital user frustration signals

Earning a customer's trust is tough, but losing it is unbelievably easy. That is why when a customer is happy, they stay for longer. A 2019 Accenture consumer survey of over 20,000 users across 19 countries revealed that a significant 47% of users avoid businesses that frustrate them with the user experience. Interestingly, an equal 47% said they were willing to pay a premium for a frustration-free user experience that exceeds their expectations.

How Cribl Stream Can Enhance Digital Operational Resilience Under DORA within Financial Services

In the swiftly changing digital realm of the finance and insurance sectors, sustaining operational resilience while complying with rigorous regulatory mandates is paramount. The Digital Operational Resilience Act (DORA) marks a significant regulatory milestone designed to ensure entities within the financial services sector are equipped to withstand, respond to, and recover from all types of ICT (Information and Communication Technology) related disruptions and threats.

Visibility is Critical to the Microsoft Teams User Experience

In today’s digital work environment, the necessity for seamless connectivity cannot be overstated, with any disruption significantly impacting productivity. Microsoft Teams has emerged as the most impactful application on a user’s day-to-day work life. According to Okta, the authentication vendor, Microsoft 365 and Microsoft Teams is the #1 application across enterprises.

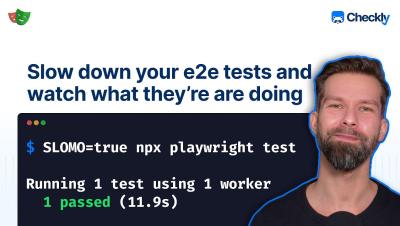
How to run your Playwright end-to-end tests in SloMo

Sometimes you want to follow along your Playwright tests without starting a full debugging session. Learn in this video how to slow down your Playwright end-to-end tests, to see and watch exactly what's happening in your testing scripts. Use the "slowMo" launch option configuration to add delays inbetween all Playwright actions. More cool Playwright and Synthetic Monitoring tips coming your way soon!

Unlocking the mysteries of cronjobs: A beginner's guide to scheduling magic

Imagine, if you will, a quaint, bustling town square from days gone by. At its heart stands an ancient, yet unfailingly punctual clock. This clock doesn’t just tell the time; it orchestrates the daily dance of life in the square. When it chimes, shopkeepers open their shutters, bakers pull freshly baked loaves from their ovens, and the townsfolk know their day has officially begun. This clock is the unsung hero of the square, keeping everything and everyone in perfect harmony without a word.

Monitor the Windows Registry with Datadog

The Windows Registry is a centralized key-value database that stores permissions, user data, and configuration settings for the Windows operating system and many Windows native applications. The keys stored in the registry provide a granular view into the processes occurring on a Windows host, such as certificate expirations, security checks, and pending reboots.

Photowatt, a French EDF group subsidiary trusts Icinga

We take pride in our diverse range of customers and users worldwide who trust Icinga for their monitoring needs. That’s why we’re showcasing some of these enterprises with their Success stories. It’s stories from companies or organizations just like yours, of any size and different kinds of industries.

DX NetOps Upgrade Weekend Program: Maximizing Upgrade Success

In the fast-paced world of network technology, staying current with the latest software releases is crucial for maintaining a competitive edge. However, upgrading software can often be a daunting task, fraught with risks and challenges. That's where Broadcom’s Designated Weekend Upgrade Program comes into play. This program is free of charge and offers an innovative approach to software upgrades that promises to revolutionize the way you update your DX NetOps landscape.

Tech Trends To Revolutionise eCommerce In 2024

We recently featured in Minute Hack. If you missed the write up, you can catch up in full, here… The digital landscape is poised for a revolution that surpasses mere transactions, offering a glimpse into the deep impact technology. In the dynamic landscape of eCommerce and digital experiences over the past year, we’ve witnessed a whirlwind of change and adaptation.

Prometheus vs InfluxDB: Features, Similarities and Differences.

In time-series databases, the choice between Prometheus and InfluxDB is often essential for businesses and developers. These two OSSs (Operations Support System) offer better solutions for managing and analyzing time-stamped data yet diverge in their approaches, features, and use cases. Understanding differences and shared functionalities between Prometheus and InfluxDB becomes a primary need as organizations navigate the complexities of handling vast streams of time-series data.

Flight to Success: Birdie's DevOps Evolution Fueled by Observability Insights

Birdie wanted to uplevel observability to a platform that would provide meaningful insights for application performance and debugging. Ensuring customers can provide seamless and timely care to in-home patients stands as a top priority for Birdie, and the development team takes pride in building and maintaining a high-quality platform distinguished by its reliability and responsiveness.

Top 10 Managed Services Providers in the UK - Best MSPs of 2024

Managing cloud migration, cybersecurity, and your IT stack – all of which somehow always needs to be updated – while juggling turning a profit is more than a full-time job. It’s downright impossible without the right team, the right expertise. That’s where managed service providers come in. Managed service providers (MSPs) are third-party companies who are the experts you need.

The Leading Reporting Dashboard Examples

Dashboards provide an enhanced view of your most critical business metrics. With the majority utilizing both real-time and historical data, they enable you to promptly respond to current trends as well as accurately forecast for the future. Also, reporting dashboards excel when compared to static reports, in regards to presenting data and objectives to stakeholders.

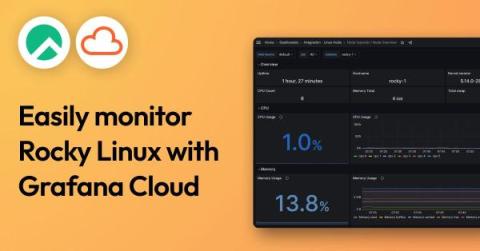
Easily monitor your Rocky Linux server using the Linux integration for Grafana Cloud

Rocky Linux is a community-driven, open source operating system that is backed by CIQ, the primary sponsor and support provider. This OS is a powerful alternative for those seeking a downstream, binary-compatible option to Red Hat Enterprise Linux (RHEL). CIQ supports Rocky Linux as a response to changes in the CentOS project, which is no longer maintained as a stable downstream clone of RHEL.

Balancing Speed to Delivery time in App Development

As devs, we know the age-old question of, “How long do you think it will take?” oh too well. Regardless of experience and position within the development cycle, this inquiry always comes loaded with expectations and complexities, a concept I refer to as Speed to Delivery Time (SDT). To be clear, SDT isn’t just about marking days on a calendar.

Capturing Security and Observability Data From Oracle Cloud

A couple of years ago, I wrote another blog on how Oracle Cloud Infrastructure (OCI) Object Storage can be used as a data lake since it has an Amazon S3-compliant API. Since then, I’ve also fielded several requests to capture logs from OCI Services and send them through Cribl Stream for optimization and routing to multiple destinations. There are two primary methods to achieve this.

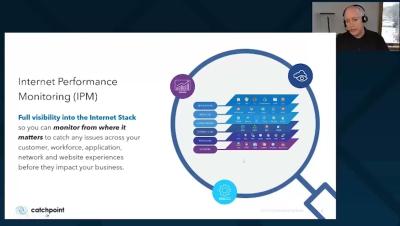
Using Internet Performance Monitoring (IPM) to Monitor Hybrid Cloud Environments

As businesses increasingly adopt hybrid cloud models to balance flexibility and control, the need arises for effective monitoring and optimization. This presentation provides practical insights into ensuring seamless performance, resource efficiency, and cost-effectiveness in your hybrid cloud deployment.

Zoom Monitoring: Detect & Troubleshoot Zoom "Poor Network Connection" Issues

Whether you’re a remote worker or working for an international business, video conferencing platforms have become indispensable tools for businesses and organizations worldwide. Among them, Zoom is a VIP player, facilitating seamless virtual meetings and collaborations. However, as IT professionals well know, the efficacy of these digital gatherings can be compromised when confronted with network-related challenges.

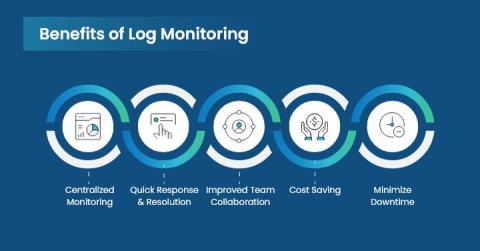
Why is Log Monitoring Considered to be Important?

Log monitoring has become crucial nowadays as more than 90% of organizations use cloud services, containers, and other technologies to stay ahead of their competitors. This excessive adaption of the latest technologies and services is great for businesses but it also makes everything a bit more complex. Consequently, the volume, velocity, and diversity of logs rise exponentially as a result of this complexity.

5 Essential Metrics for Website Performance Analysis

User experience and online presence are key to your business’s success—so monitoring and optimizing your website’s performance is non-negotiable. Downtime, slow load times, and unpredictable behavior will deter website visitors faster than a 404 error on your homepage. For that reason, Uptime.com offers a comprehensive suite of tools to keep your website running smoothly, efficiently, and reliably.
Sponsored Post

Stop using Status Pages RSS Feeds in Slack

Managing RSS feeds in Slack for outage updates is getting harder. Teams rely on them to track the health of their service dependencies. Integrating RSS feeds into Slack channels might seem like a simple way to keep everyone informed. However, this approach has significant drawbacks. It can cause confusion and inefficiency. It doesn't provide clarity and timely updates.

Introducing our new Roadmap Page

Hey there, fellow open-source enthusiasts! At Icinga, we’ve always been committed to transparency, community engagement, and continuous improvement. That’s why we’re excited to introduce a new page on our website that will provide you with insights into the future direction of our project. Check out our brand new Roadmap page! So, what exactly is our Roadmap Page all about? 1. Transparency: We believe in keeping our community informed every step of the way.

Understanding DDoS Attacks: Motivation and Impact

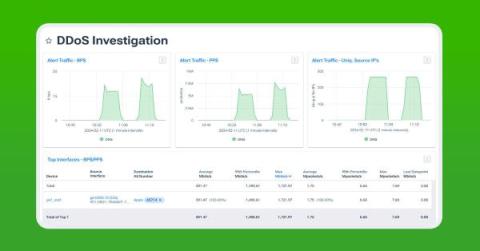
DDoS attacks disrupt services and damage reputations, with motivations ranging from political to personal. These attacks can also mask more severe security breaches, so early detection and mitigation are crucial. Learn how Kentik provides a solution by analyzing enriched NetFlow data to identify and mitigate DDoS threats.

Fluentd vs. Fluent Bit: A Comparison

Recently, I came across the quote, "The goal is to transform data into information and information into insights." This statement emphasizes the significance of data (logs) and the responsibilities associated with software applications for robust data management, particularly log management. Effective log management is essential for performance optimization, troubleshooting, ensuring strong security, and maintaining compliance.

InfluxDB 3.0: The Ideal Solution for Real-Time Analytics

Despite changes in technology, culture, economics, or virtually any other factor imaginable, the adage ‘time is money’ remains relevant. When it comes to data analysis, the faster you can conduct analysis, the better. However, increasing data volumes across the board make it challenging to analyze and act on data in a timely manner.

Overcoming invisible downtime across application user experiences

Invisible downtime escapes traditional metrics and harms the user experience. Learn how full-stack observability helps defend your application environment. According to the latest App Attention Index, a staggering 88% of consumers grappled with application performance issues within the past year, and 70% admitted to warning others against using an app, after one bad experience.

AI-powered diagnostics for incident response: New Sift features in Grafana IRM

Sift is a machine-learning-powered diagnostic feature in Grafana Cloud that SREs and DevOps teams can use to automate routine parts of incident investigation, such as searching for new errors in logs, surfacing recent deployments, or identifying overloaded Kubernetes nodes. We want Sift to springboard you into an investigation, so useful context is already there by the time you see an alert or declare an incident.

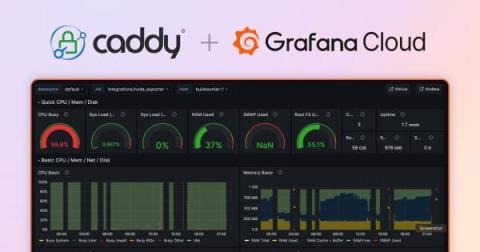
How the open source Caddy server uses Grafana Cloud for full-stack observability

Mohammed Al Sahaf serves as Technical Product Manager at Samsung Electronics Saudi Arabia. Outside his day job, he serves with the Caddy team to tackle the web of problems facing web servers in the third millennium. Mohammed is the author of Kadeessh, formerly caddy-ssh, and the maintainer of numerous Caddy modules. When he isn’t programming, he is trying to catch up on life and sleep with the help of coffee.

From Chaos to Clarity Troubleshooting Postgres

I have always had a special fondness for Postgres, particularly captivated by its JSONB capabilities, which is at the core of what I love as it stands as a testament to its adaptability. This functionality exemplifies Postgres’s ability to adapt to modern apps’ rapidly changing needs to support structured and unstructured data to coexist seamlessly within the same database environment. The capabilities of PostgreSQL are not limited to its ability to manage relational and non-relational data.

AWS Cost and Usage Dashboards Operations Solution (CUDOS): A Deep Dive

CUDOS is one of the six specialized dashboards, in the AWS Cloud Intelligence Dashboards framework. The Cloud Intelligence Dashboards framework is focused on providing comprehensive usage and cost insights for AWS resources. It is a very crucial tool that provides deep insights that can be used to optimize AWS infrastructure.

Evolving Your Career Path in Tech: Insights and Strategies for Success

Discover the unique career paths of our panelists in the tech industry. Overcoming imposter syndrome, setting and achieving goals, and navigating the nuances of company culture can pose challenges in one's professional journey. However, these women will share their stories of resilience, overcoming obstacles, and self-advocacy that propelled them to where they are today.

MSSP Monitoring Use Cases: The Benefits of Network Monitoring for MSSPs

Nowadays businesses are confronted with increasingly sophisticated cyber threats that pose significant risks to their operations, data, and reputation. To combat these threats effectively, organizations often turn to Managed Security Service Providers (MSSPs) for expert guidance and support. Unlike traditional Managed Service Providers (MSPs), MSSPs specialize in delivering comprehensive security and network monitoring solutions tailored to the unique needs of their clients.

The Data Table Webcast Series with Kevin Kline

The Data Table is a webcast series tailored for data and database professionals like you, hosted by SolarWinds own tech evangelist, Kevin Kline. Each session gives database professionals a seat at the table to discuss the latest news, best practices, and strategies in the Data and Analytics (D&A) space. It's not just about theory, it's an opportunity to connect with and learn from Kevin and other IT industry experts about the topics IT pros really care about.

Modern Observability for Data Unification for Business Insights Is Here

Today, we’re adding to the groundwork we’ve established to provide enterprise organizations with a modern approach to data unification to improve insights. Our True North unifies all the many layers of data into a single stream to provide better insights so you can make better decisions and adjustments and bring value to the organization.

NiCE Advanced URL Management Pack for Microsoft SCOM

NiCE Advanced URL Management Pack enables extended monitoring of https, certificates, response times, and much more. It is inspired by the URL Genie MP, bringing many more new features to the SCOM admin table. In this Use Case covering the NiCE Advanced URL Management Pack, a FinTech Provider specifically needed way more in-depth URL monitoring for several reasons, all of which are tied to enhancing the security, performance, and user experience of their services.

Website monitoring in Applications Manager

With the increasing reliance on the internet for information and services, customers expect websites to be fast, reliable, and easy to navigate. In today’s digital age, a company’s website serves as its virtual storefront, and is often the first point of contact for potential customers. Any downtime or slow loading times can lead to frustration and a negative perception of the company.

The Role of Artificial Intelligence (AI) in Digital Transformation

In today's fast-paced digital landscape, it's not enough for companies to merely adapt to change; they must lead the way in embracing transformative technologies because it’s the only way to grow and stay competitive. In this blog, we'll explore how the fusion of digital transformation and AI transformation is shaping business environments around us.

Enhancing Log Analytics in Loki with Cribl Stream

First, when I mention Loki, I’m not talking about one of my favorite TV shows to binge-watch or the lead character played by Tom Hiddleston, who has arguably become one of my favorite characters in the Marvel universe. I’m talking about the Loki, which is a highly available, cost-effective log aggregation system that was inspired by Prometheus. While Prometheus is focused on metrics, Loki is focused on collection of logs.

SSL Certificate Errors: A comprehensive guide

SSL certificates create an encrypted connection between a web server and a user’s browser. This encryption ensures that any data transmitted remains private and secure, making it essential for protecting sensitive information like passwords, credit card numbers, and personal details. However, when there’s an issue with the SSL certificate, users can encounter errors that not only disrupt this secure connection but can also hint at potential security risks.

Goliath's Use of AI Puts an Extra Citrix Expert In-House

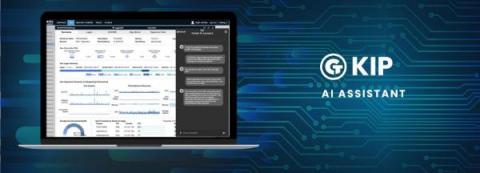
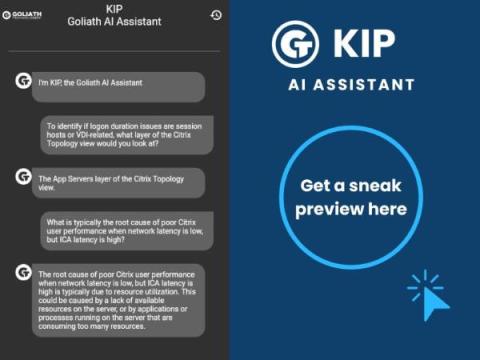
AI has been the talk of the day ever since the breakthrough of ChatGPT with a large generative language model. More and more companies are also adding AI capabilities into their products, but this is often just a marketing trick to tag on AI to show a new feature that isn’t really AI. Goliath Technologies is handling AI very differently. They are introducing KIP, a virtual AI troubleshooting assistant for Citrix end user experience monitoring.

Three Properties of Data to Make LLMs Awesome

This post first appeared on Phillip's personal blog. Back in May 2023, I helped launch my first bona fide feature that uses LLMs in production. It was difficult in lots of different ways, but one thing I didn’t elaborate on in several blog posts was how lucky I was to have a coherent way to get the data I needed to make the feature useful for users.

What Is Application Performance Monitoring?

Applications serve as the backbone of countless operations, driving productivity, customer experience and business success. Tracking and managing their performance is therefore critical to maintain continuity and efficiency, enabling IT teams to proactively identify and resolve issues before they lead to downtime and potential revenue loss. That’s where application performance monitoring (APM) comes in.

Building Your Own Observability Solution vs Implementing a SaaS Solution

Observability is a key component of modern applications, especially highly complex ones with multiple containers, cloud infrastructure, and numerous data sources. You can implement observability in two ways: build your own observability solution or use a homegrown alternative like Coralogix.

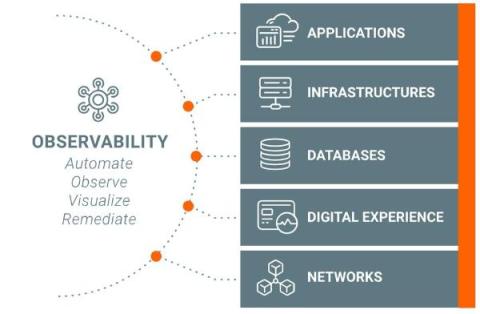
What Is Network Observability? - 5 Best Platforms for Observability

In today’s world, every business relies on its network infrastructure to achieve its goals. It’s, therefore, critical to monitor your network infrastructure and be aware of how efficient it is. You can achieve this through network observability. What Is Network Observability? The 3 Key Factors of Network Observability Benefits of Network Observability Observability vs.

How to instrument your Python application using OpenTelemetry

If you want to see if OpenTelemetry helps you become a better Python developer — or if you just want to know how to add OpenTelemetry to your Python service — you’ve come to the right place. In this blog, we’ll show you how to instrument your Python application using OpenTelemetry and how to visualize your OpenTelemetry data using Application Observability in Grafana Cloud. We’ll walk you through the following steps.

Getting Started With Azure Serverless

Serverless computing represents a paradigm shift in how we build, deploy and scale cloud applications. By decoupling infrastructure and server management from code development, developers are free to put a single focus on fine-tuning code in app development. The era of serverless computing puts innovation at center stage and removes the traditional constraints of server management.

Generative AI in Observability: A Trip or a Trap?

Generative AI or Generative Artificial Intelligence, in its simplest form, means being capable of generating text, images, or any data using generative models, mostly in response to prompts. You would have all heard of OpenAI’s ChatGPT. It is generative AI in action. Essentially, What do you do in ChatGPT? You type in a topic or a question, and the robot replies with structured answers.

AppNeta Is Getting a New Look and Feel

Broadcom offers two robust solutions for network operations: DX NetOps and AppNeta. These solutions work together to provide active, passive, and infrastructure monitoring, giving you continuous, end-to-end visibility into your networks. Our vision is to bring DX NetOps and AppNeta closer together to offer experience-driven NetOps—providing a unified solution that delivers comprehensive network visibility and network path analytics.

Anodot Cloud Cost Update: Enhancing Anomaly Detection and Budgeting

February 20, 2024 We’re excited to announce the latest enhancements to Anodot’s Cloud Cost platform, bringing cutting-edge improvements in anomaly detection and budgeting capabilities. Our commitment to innovation continues to shape the way businesses approach data analysis and financial planning.

The Reality of Streaming Telemetry and SNMP

In this LinkedIn Live replay, Kentik's Phil Gervasi and Chris O'Brien delve into the evolving landscape of network monitoring, focusing on the transition from SNMP to streaming telemetry. Despite SNMP's long-standing dominance in network observability, the duo explores its limitations and the rising adoption of streaming telemetry for enhanced granularity and real-time data analysis. With his extensive experience as a network engineer, Chris shares valuable insights into the practical implications of this shift for enterprises of all sizes.

Avoiding the Data Roach Motel with Open Source

It's your data. You should be able to do whatever you want with it. However, vendor lock-in can trap your data in a single solution, making it extremely difficult to switch to something that better meets your needs. When your data goes in, but doesn't come out—that's a data roach motel. Open source technologies, and solutions built with open source tools, enable organizations to take control of their data, giving them the freedom to put it into and take it out of whatever databases or solutions they see fit.

Maintaining Control of Your IT Infrastructure With WhatsUp Gold

Today’s IT infrastructure is an increasingly complex mix of servers, clouds, devices and applications. End-to-end visibility is necessary for network and system administrators to address outages, hardware failures, software performance issues, traffic bottlenecks and potential security threats.

5 Hidden Costs of Over-Sensitive Monitoring Systems in Incident Management

Monitoring systems are invaluable for detecting incidents before they spiral into catastrophes. However, there's a hidden danger lurking within even the most robust monitoring setups: false alarms. When systems are overly sensitive, they raise alerts for incidents that don't actually exist. While this may seem harmless on the surface, hyper-sensitive monitoring can quietly drain time, money, and morale in ways that only become apparent over time.

Monitor networks with microscopic precision: Understanding network path analysis

Just as an atom is the building block of all matter, a network packet is a basic unit of data transmitted over a network. But to visualize how atoms makeup a piece of metal, scientists need an electron microscope. Likewise, to visualize, observe, and, most importantly, understand the behavior of network packets in a network, a specialized tool is needed: a network path analysis tool. This tool can visually trace the path taken by network traffic from source to destination.

NiCE Unified Monitoring Management Pack for Microsoft SCOM

The Unified Monitoring Management Pack discovers other monitoring systems like Icinga, Nagios, and CheckMK and brings their alerts into SCOM for unified monitoring and alert management. A FinTech provided was faced with managing several monitoring tools, all of them required to run smooth operations.

NiCE Linux Extension Management Pack for Microsoft SCOM

The NiCE Linux Extension Management Pack enables extended Log monitoring for Linux Systems. It includes analyzing multiple rows, wild cards, log correlation, and more. The standard Linux Management Pack for System Center Operations Manager (SCOM) offers a decent level of monitoring for Linux systems, but it might have limitations when it comes to log monitoring on Linux in comparison to more specialized or dedicated log management solutions. Here are a few areas where it might be lacking.
Sponsored Post

Navigating the Top 10 Linux Monitoring Challenges

In today's fast-evolving IT landscape, where technological advancements are the norm, the role of robust monitoring has become increasingly critical. As organizations embrace Linux-based systems for their flexibility, performance, and scalability, the need to effectively monitor these environments has never been more pronounced. Linux, being at the core of numerous mission-critical operations, demands a vigilant and adaptive monitoring approach to ensure optimal performance, security, and reliability.

How to Monitor Cross-Origin Resource Performance

Browsers provide detailed performance information about every resource a webpage loads. Most of this information is hidden during cross-origin requests however. This is a common problem since pages often load content from a variety of origins. Pages can access cross-origin timing information if an additional header is added to cross-origin responses.

How Time Series Databases and Data Lakes Work Together

In the fast-paced world of software engineering, efficient data management is a cornerstone of success. Imagine you’re working with streams of data that not only require rapid analysis but also need to store that data for long-term insights. This is where the powerful duo of time series databases (TSDBs) and data lakes can help.

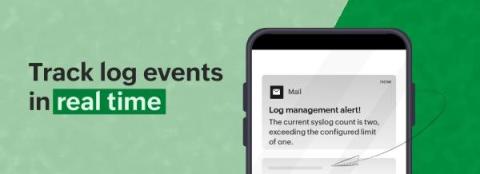
Track events in real time: Enhance monitoring with proactive log analysis

Preventing issues through proactive log analysis is more advantageous than reacting to problems with troubleshooting when they occur. Logs can act as a powerful source for proactive monitoring, and configuring the right alerts can ensure that you are notified about critical events in advance. In this blog post, we'll unveil a few suggestions for optimizing log-based alerting to enhance incident management and achieve operational excellence.

Thou Shall Pass! Troubleshooting Common Amazon S3 Errors in Cribl Stream

Data lakes are everywhere! With data volumes increasing, cost-effective storage is becoming a greater need. With Cribl Stream, you can route data to an Amazon S3 data lake and replay or search that data at rest. But nothing is more frustrating than something not working and those blasted error logs that pop up. In this blog, some common errors for your S3 sources or destinations are highlighted, and some potential root causes and solutions are highlighted.

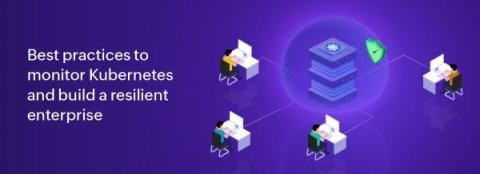
10 best practices to achieve Kubernetes resilience for enterprises

Resilience has more than one meaning, but the one we typically think of is the capability to withstand a crisis when it strikes and be equipped to face higher challenges. Building and adopting resilient technological solutions is the need of today's modern businesses. An enterprise fortified with resilience is well-equipped to face any unforeseen disruptions, mitigate damages, recover quickly, and reduce incident management costs.

Streamlining Success: The Core Reasons to Embrace Configuration Management

WhatsUp Gold’s Configuration Management tool is a seamless add-on to the interface; Configuration Management lets you centralize and automate all your management tasks and securely back up device configurations. Watch this webinar and learn how to: Automate configuration management tasks, backups and recovery Bring consistency to your configurations across your device roles Meet security and compliance guidelines with alerting, archiving and automated reporting.

Microsoft 365 APM Profiles using REST API Monitor and Microsoft Graph API

As of WUG 2022 our REST API monitor supports OAuth 2 Client Credentials allowing a daemon application (non user interactive) to authenticate as an application to the Graph API. Using this new capability we created new APM profile to monitor Microsoft 365 and Office 365.

NOSQL vs SQL. Key differences and when to choose each

Until recently, the default model for application development was SQL. However, in recent years NoSQL has become a popular alternative. The wide variety of data that is stored today and the workload that servers must support force developers to consider other more flexible and scalable options. NoSQL databases provide agile development and ease of adapting to changes. Even so, they cannot be considered as a replacement for SQL nor are they the most successful choice for all types of projects.

CISO Fireside Chat: Volkswagen Slovakia Implements Progress Flowmon

Volkswagen Slovakia's IT and operational technology departments operate and monitor thousands of IP addresses and User ID credentials, as well as hundreds of automated machines. The company trusts Progress® Flowmon® to execute new strategies tied to security monitoring, detecting anomalies and enforcing its Zero Trust Policy. Join us for a Fireside Chat with Marian Klaco, Volkswagen Slovakia's Chief Information Security Officer.

Best Log Monitoring Tools

Log monitoring is a fundamental practice in the system administration and cybersecurity, playing a pivotal role in maintaining the health and security of computer systems. At its core, log monitoring revolves around the scrutiny of log files generated by diverse software applications, operating systems, and servers. These log files serve as detailed records, containing crucial information about system events, errors, and user activities.

How to end-to-end test and monitor your login flows with Playwright and Checkly

In this video, Stefan from Checkly demonstrates how to monitor a login and authentication flow using Checkly and Microsoft's Playwright. Stefan guides you through the entire process. If you're interested in end-to-end testing or synthetic monitoring, this video is for you. Drop a question below or leave a comment!

Getting Resource Metrics in Kubernetes: A Comprehensive Guide to kubectl top

In Kubernetes management, the ability to efficiently monitor resource utilization is very important for cluster owners. Have you ever heard about the kubectl top command and wondered how it could revolutionize your Kubernetes management experience? If so, you're in the right place. The kubectl top command – a powerful tool that offers snapshots of resource metrics for pods and nodes within a Kubernetes cluster.

Webinar: Cloud security and observability: When integrity and availability meet

The bad news: It’s no wonder so many organizations find it near impossible to get control of — and ensure — a secure, reliable network. The good news: Technology leaders from Prisma Cloud and StackState show you how you can significantly enhance the integrity and availability of your cloud environment — with just a few lines of code or simple clicks.

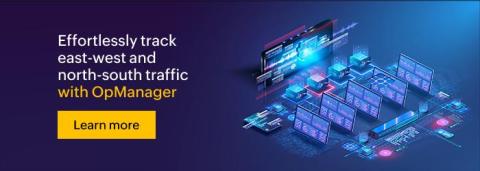
How OpManager helps network admins monitor east-west and north-south traffic seamlessly

According to a report on the network traffic analysis market, the market is expected to grow significantly, reaching $6,540.61 million by 2028. This growth is projected at a CAGR of 9.38% from 2022 to 2028. Understanding these trends is vital for IT and other organizations that depend on analyzing their network traffic for improved network management and performance.

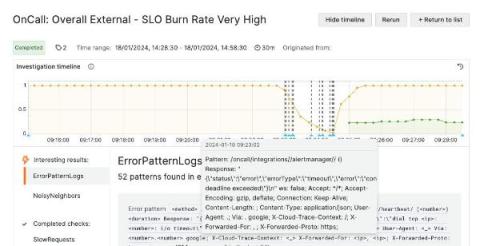
Navigating the Waters of System Performance: A Deep Dive into a Recent Incident

In digital transactions, even the slightest hiccup can ripple through the system, causing significant disruptions. Our recent encounter with an unexpected system slowdown and a noticeable drop in transaction success rates is a testament to the intricate balance required to maintain seamless operations. This post aims to shed light on the incident, our findings, and the measures we’ve taken to fortify our system against future disturbances.

Using Time Series Data for Infrastructure Monitoring: Challenges and Advantages

Monitoring the performance and health of infrastructure is crucial for ensuring smooth operations. From data centers and cloud environments to networks and IoT devices, infrastructure monitoring plays a vital role in identifying issues, optimizing resource utilization, and maintaining high availability. However, traditional monitoring approaches often struggle to handle the volume and velocity of data generated by modern infrastructures. This is where time series databases, like InfluxDB, come into play.

Grafana vs Splunk - An Overview

Monitoring tools serve as essential tools for computer systems, diligently collecting and analysing data to enhance decision-making and and prevent potential issues. Monitoring tools give you real-time information, helping you quickly find and fix problems and also makes sure everything runs smoothly. Thus effective monitoring tools are a necessity for businesses seeking insight into their IT infrastructure.

Analyzing the Impact of Website Speed on User Engagement

Welcome to the high-speed chase of website performance! As emerging techies in the realms of DevOps and Site Reliability Engineering (SRE), you’re about to embark on a thrilling journey to understand one of the most critical aspects of user experience—website speed. In this digital era, where a millisecond can make or break a user’s engagement, it’s essential to grasp the nuances of website performance.

IaC? CI? Shift Left? What do they really mean? - A DevOps Glossary

Look, we've all been there: there's a term, you've heard it one hundred times. You've nodded as others said it in meetings. And now, you've started to say it. The only tiny insignificant problem is that you're not 100% sure what it actually means or how it's different from another similar term. I feel you. So I wrote this DevOps glossary with my highly opinionated definitions of common DevOps industry terms.

OpenTelemetry: 3 questions to ask before choosing an observability solution

As OpenTelemetry rises in popularity, more organizations are implementing, or planning to implement, the open source project to monitor their applications — and, meanwhile, more vendors are offering OpenTelemetry support. In fact, a quick Google search for “OpenTelemetry support” shows results ranging from legacy APM vendors to newer, cloud native solutions like Grafana Cloud.

Are You Forensic Ready?

In the landscape of everyday operations, the concept of forensic readiness may often linger unnoticed in the background. When a crisis strikes, be it a major system outage or a security breach. The importance of being forensic ready as part of your overall digital resiliency strategy suddenly becomes evident. That’s the moment you realize it’s necessary for a thorough investigation. The findings enable you to have an effective response and proportionate mitigative actions.

Agent-Based Network Monitoring: Monitoring Distributed Networks

Network monitoring has long been a cornerstone of IT management, providing insights into network activity, performance metrics, and potential issues. However, traditional network monitoring methods often need to catch up to keep pace with the dynamic and complex nature of modern networks. As organizations strive to optimize network performance, minimize downtime, and enhance overall reliability, the role of proactive agent-based network monitoring software like Obkio becomes increasingly crucial.

What Is Application Performance Monitoring?

Every business is a software business. And by software, we don’t mean code—we mean running software serving customers in production. Those customers may be internal to the company, they may pay you money, or they may represent attention that increases ad revenue—either way, making them happy is your business. And your fast, reliable software makes them happy. Application performance monitoring, also known as APM, represents the difference between code and running software.

Internet VPN Performance Troubleshooting For Multi-Site SMBs with Obkio's Basic Plan

At Obkio, we frequently get asked the question by potential customers: "Which plan do I need?". So we decided to share the perfect use case to provide clarity. What better way to illustrate the capabilities of our Basic Plan than by showcasing a real-life scenario of a multi-site SMB taking advantage of it?

Cisco Live EMEA '24 - Let's talk Full-Stack Observability!

Listen in on this conversation with Ronak Desai - Cisco AppDynamics SVP and General Manager for Full-Stack Observability where he discusses recent innovations such as the advancements with Digital Experience Monitoring and why DEM is important, Cisco AI Assistant and how Cisco leverages AI, and the Cisco Observability Platform with its huge number of developer led modules. Chapters.
Deciphering Distributed Systems: A Complete Guide to Monitoring Strategies

Distributed systems allow projects to be implemented more efficiently and at a lower cost, but require complex processing due to the fact that several nodes are used to process one or more tasks with greater performance in different network sites. To understand this complexity, let’s first look at its fundamentals.

After a Ransomware Infection - Enhancing Security for Your Infrastructure Against Further Intrusion

In a previous blog, we outlined the essential steps that organizations should take within the first two days after the detection of a ransomware attack. In this follow-up post, we’ll discuss what an organization should do after the initial response to reduce the risks of future attacks. We’ll also highlight how Progress Flowmon can support ongoing network monitoring, early detection of attacks and reduction of further damage. Webinar: The First 48 Hours of Ransomware Incident Response.

Greater Control Over Windows Events for Qradar: Why Windows Events Matter

Windows events provide a wealth of security-relevant information, especially when they are correlated and analyzed within a SIEM like IBM Qradar. Whether you rely on MITRE ATT&CK, NIST, or another security framework, Windows Events are likely one of your higher volumes (EPS – Events Per Second) and represent your largest-sized events (Gigs per day – Storage and Archive).

The Role of Observability in Telecoms

The rapid growth of 5G technology and expanse of the Telecoms industry has created the need for these organizations to implement effective data-driven decisions, to enable the future profitability of their companies. This raises the challenge of analyzing data from various sources across complex networks to derive insights and ultimately decision making.

Navigate memory management challenges in MongoDB with Site24x7

Effective memory management is crucial for optimal MongoDB performance and helps ensure seamless database operations and user experience. Allocating enough memory lets the database store frequently used data and indexes in RAM and cut down on disk I/O operations. This boosts query response times and system responsiveness. Poor memory management can cause delays in retrieving data from disk, leading to performance degradation.

WEBINAR - Microsoft Teams Performance Excellence: IT Blind Spots and Remedies

Unlocking Microsoft 365 Excellence: EMA Report Reveals Performance Secrets In today’s modern workplace, Microsoft Teams is the linchpin of productivity and customer experience. For the first time, a report launched today uncovers a critical IT blind spot when it comes to Teams, revealing its impact on the customer experience. Join EMA analyst Valerie O’Connell as she reveals insights from ‘The State of Microsoft 365 Performance Management’ report.

OTel Explainer: Simplifying Observability in Modern IT Environments

In today's rapidly evolving landscape of distributed systems and microservices, understanding how applications behave in production environments has become increasingly complex. Traditional monitoring tools often fall short when it comes to providing comprehensive insights into the performance and behavior of these modern architectures.

How to start with Kubernetes monitoring in Grafana Cloud

This video provides a comprehensive guide to initiating Kubernetes monitoring within Grafana Cloud, detailing a straightforward, step-by-step approach for installing the Helm chart on your cluster. It further ensures that you can validate the health and integrity of the data underpinning the solution, setting a solid foundation for effective monitoring practices. Ideal for both beginners and experienced users, this tutorial is designed to streamline your monitoring setup process with precision and ease.

Kubernetes alerting: Simplify anomaly detection in Kubernetes clusters with Grafana Cloud

Despite the widespread adoption of Kubernetes, many DevOps teams and SREs still struggle to troubleshoot issues because of all the complexity that comes with the open source container orchestration platform. That’s why we developed Kubernetes Monitoring, an application in Grafana Cloud you can use to visualize and alert on your Kubernetes clusters.

Measure long-term user engagement with Datadog Retention Analysis

It’s relatively easy to study the immediate impact of new releases by analyzing short-term changes in user behavior or system activity. However, this information doesn’t tell you much about the long-term viability of your application, which depends less on the novelty of major application updates and more on sustained usability.

How Do You Monitor Dynamic Amazon Web Services (AWS) Cloud Architectures?

david.arrowsmith • Feb 15, 2024 Comprehensive visibility across all your Amazon Web Services (AWS) environments plays an important part in maintaining the availability, and performance of applications hosted in AWS. Leveraging Interlink Software’s AIOps and Business Service Observability Platform, enterprises can greatly enhance their capability to monitor, manage and optimize the health of applications and act swiftly resolving issues before they impact on customer experience.

What is a HTTP 500 Error & How Can You Fix It?

One of the most valuable features of AlertBot’s web monitoring solution is that is automatically and continuously scans web pages for hundreds of possible errors, uniquely identifies them, and even captures a screenshot. Today, we’re going to take a deeper look at one of the many possible errors that AlertBot flags as part of its ongoing scans: HTTP 500 errors.

70 Facts and Stats on AWS in 2024

Amazon Web Services is one of the most popular services that StatusGator users subscribe to so they can be among the first to learn if AWS or any of its components or regions experience downtime. Previously, we already explored the least reliable AWS Region, and we continue to explore the most popular cloud computing platform. Here are facts on Amazon Web Services as of 2024 split into categories.

Network Monitoring Dashboard: Features, Criteria, and Tips

Today, more than 95% of professionals use networks for communications, file transfer, and other business operations. The more a business is dependent on the latest technologies and practices, the more complex their network will be. So, no matter whether you run a small company or a large organization, with modern networking, chances are high that administrators might face network issues with the management of complex networks.

Top 13 Open Source APM Tools [2024 Guide]

Choosing the right APM tool is critical. How do you know which is the right one for you? Here are the top 13 open source application performance monitoring(APM) tools which can solve your monitoring needs. Open source APM tools have added benefits over their SaaS counterparts. Open source tools are more transparent as you can verify its source code, and you can use it without going through the pains of taking approvals usually required for using a third-party vendor tool.

Debugging and Decoding MongoDB with OpenTelemetry

MongoDB’s flexibility and document-oriented nature have always stood out to me as its most compelling features, setting it apart from the strict schema constraints of traditional relational databases. This adaptability is a boon for application development, allowing for more dynamic data interactions that mirror real-world information complexities and freeing table schemas’ constraints.

Why DNS Monitors Are Crucial for Your Infrastructure

In the early 90s, it was easier—and more affordable—to register a domain name with the same as a company’s. Now, it requires other services to register it and keep it from potential competitors. Despite the process change, registering a domain name is still one of the most crucial aspects of supporting a business online. This blog details the behind-the-scenes processes on how domain names become accessible content to users, starting with what a Domain Name System (DNS) is.

Mastering high web traffic: Essential strategies for success

Preparing for high-traffic scenarios is crucial for the success of any website. As your online presence grows, you'll inevitably face challenges associated with increased traffic. This article will discuss key strategies to effectively manage high web traffic and ensure your website maintains optimal performance.

Get Swept Off Your Feet by Cribl Stream 4.5: Converting Dimensional Metrics to the OpenTelemetry Protocol Format with the OTLP Metrics Function

In the dynamic world of observability and analytics, everyone’s looking for smarter, more efficient, and interoperable ways to handle their data. That’s where Cribl steps in, bringing you an exciting update to our product lineup. We’re thrilled to introduce the OTLP Metrics Function to Cribl Stream 4.5! This Function converts metrics into the OpenTelemetry Protocol (OTLP) format with ease!

The Real Cost of Synthetic User Testing with AWS

Every time I share a project using SaaS tools, someone inevitably responds that they could do the same thing on their own home server ‘for free.’ I mention this not because it is annoying, since I would never go on social media at all if annoying responses were allowed to change my behavior, but because I think it points to a basic misconception that still affects DevOps practitioners today: the refusal to accurately estimate the real costs of self-managed solutions.

Your Global Microsoft Teams Performance Action Plan

Our ‘Global Microsoft Teams Performance Trends’ report revealed some very interesting facts about enterprise usage of Teams. Using insight drawn from hundreds of thousands of Teams users, we’ve figured out the issues that plague certain regions. Don’t worry, we haven’t just filed that under “important stuff for later”, we’ve created an action plan for your organization you use to make its Teams performance much better. Let’s dive straight in.

Powering Real-Time Data Processing with InfluxDB and AWS Kinesis

Imagine a data engineer working for a large e-commerce company tasked with building a system that can process and analyze customer clickstream data in real-time. By leveraging Amazon Kinesis and InfluxDB, they can achieve this goal efficiently and effectively. So, how do we get from idea to finished solution? First, we need to understand the tools at hand.

Safer Client-Side Instrumentation with Honeycomb's Ingest-Only API Keys

We're delighted to introduce our new Ingest API Keys, a significant step toward enabling all Honeycomb customers to manage their observability complexity simply, efficiently, and securely. Ingest Keys are currently available for Environment & Services customers, with Classic support and programmatic key management capabilities under development and coming soon!

Monitoring Kafka with OpenTelemetry including client side monitoring

In this video, you will see a demo of how to monitor Kafka with OpenTelemetry. We will instrument a NodeJS application using Kafka and get client side metrics like delay between producer emitting a message to consumer receiving it via distributed tracing. We will also get Kafka server metrics like consumer lag and plot it dashboards.

Why ngrok Prioritized a Datadog Integration for Streamlined Monitoring of HTTP Events

ngrok delivers instant ingress to your applications in any cloud, private network, or devices with authentication, load balancing, and other critical controls using their global points of presence. Hear from Chad Tindel, Field CTO & VP WW Solution Architecture, on why Datadog was their most requested integration and how it provides an easy pathway to ship application and traffic logs into one unified observability platform.

How to Monitor Network Failover: Fighting Against Downtime

The Internet is everywhere these days, woven into how businesses operate and connect with customers, partners, and colleagues. It's not just a luxury; it's a necessity. Keeping things running smoothly means having a network that's on its A-game all the time – no glitches allowed. Why? Well, network downtime isn't just an inconvenience; it's like a money-eating monster that also affects how people see your company.

Heroku Router Path Metrics

We are pleased to announce that we have released a new feature that allows you to collect Heroku Router metrics by path! By default, this option will not be enabled as it will increase your number of total metrics. If no action is taken, you will continue to receive your Router metrics in the default format. This provides a good overview of your application’s total connection times, requests by method/status, etc.

Cisco AppDynamics for SAP in retail

In this video, Matt Schuetze discusses the challenges retailers face during peak sales periods, along with shifting consumer behaviors. Their SAP systems must manage a wide gap between the highest stresses during peak times and the regular loads during off-peak seasons, exposing retailers to poor customer experience outcomes. He expands on how using AppDynamics for SAP to monitor, manage, and respond to these challenges in real-time help retailers protect their customers’ experience and support their ongoing pursuit of competitive edge.

Data Lakes: A Comprehensive Guide

Whether you’re a Data Engineer, DevOps, Cloud Architect, or a Business Intelligence Professional, Data Lakes are indispensable tools for harnessing the power of big data, enabling advanced analytics, and driving informed decision-making across your enterprise. Back in the 90s, the internet boom led to an unprecedented expanse of data. This led to a gaping demand for better data storage solutions.

FinOps: A Basic Guide to Optimizing IT Financial Management

In an insightful Galileo webinar interview, industry analyst Charles Araujo delved into the world of FinOps, shedding light on its significance and practical implications for IT operations professionals. As organizations increasingly grapple with the complexities of cloud computing and strive to optimize their financial management practices, understanding the core principles becomes essential.

How to benefit from capacity planning and resource optimization using OpManager

In the dynamic world of IT infrastructure, maintaining the efficiency and performance of enterprise servers is a top priority for IT teams. Ensuring that servers are optimally allocated with resources is crucial for avoiding performance bottlenecks and making cost-effective decisions. Efficient resource allocation plays a vital role in achieving this goal.

Advanced Log File Monitoring Strategies on Microsoft SCOM and Azure Monitor

This technical whitepaper delves into the intricacies and benefits of advanced log file monitoring, showcasing its pivotal role in modern IT infrastructure management. We explore the fundamental principles of log file monitoring, discuss the challenges associated with traditional approaches, and highlight the advantages of adopting advanced techniques.

DataDog vs New Relic - The Real Winner [2024 Guide]

Both DataDog and New Relic are popular monitoring tools that provide a wide range of products covering different aspects of application and infrastructure monitoring. In this post, I have compared Datadog and New Relic on important features like APM, log management, infrastructure monitoring, OpenTelemetry support, etc. info 💡 I instrumented a sample Spring Boot Application and sent data to Datadog and New Relic to evaluate my experience.

Security and Compliance Network Cyber Essentials

Best practices are key when approaching your cybersecurity and compliance strategy, any source of guidance is beneficial. The Cyber Essentials is a UK Government, industry-supported set of best practices introduced by the National Cyber Security Center (NCSC) to help organizations demonstrate operational security maturity.

Introducing AppSignal Business Add-Ons

Introducing the alternative to expensive all-encompassing Enterprise Plans: AppSignal Business Add-ons. With our Business Add-Ons, you only need to pay for the features that matter to you, giving you the additional features your organization needs with the same freedom and flexibility all AppSignal customers enjoy. We currently have two Business Add-Ons on offer: In this blog post, we'll give you a whistle-stop tour of our new Business Add-Ons and explain how to add them to your organization's plan.

Bridging the Gap: Overcoming Communication Challenges Between Helpdesk, SREs, IT Teams, and Database Administrators

One area where communication breakdowns commonly occur is between helpdesk / IT teams / SREs and database administrators (DBAs), especially when troubleshooting application problems associated with databases. Smooth communication between different teams is key to resolving application performance issues efficiently and speedily. However, it is usually inappropriate for helpdesk staff to have access to the database monitoring privileges and tools used by DB administrators.

How to reduce expenses on monitoring: Swapping in VictoriaMetrics for Prometheus

Monitoring can get expensive due to the huge quantities of data that need to be processed. In this blog post, you’ll learn the best ways to store and process monitoring metrics to reduce your costs, and how VictoriaMetrics can help. This blog post will only cover open-source solutions. VictoriaMetrics is proudly open source. You’ll get the most out of this blog post if you are familiar with Prometheus, Thanos, Mimir or VictoriaMetrics.

New Year, New Uptime - Our First 2024 Updates

Hi Everyone! I am thrilled to reconnect with you all through another blog post, offering a glimpse into the latest buzz at Uptime.com. With our team firing on all cylinders, we’ve been hard at work delivering enhancements and exciting new features. So, without further ado, let’s dive into the latest additions and tease what’s coming up in 2024 – without giving away all the surprises just yet!

Don't Slow Your Roll: Controlling Your Qradar Data Flow

IBM Qradar is a Security Incident and Event Manager (SIEM) trusted by many organizations to provide threat detection, threat hunting, and alerting capabilities. Qradar SIEM is often integrated with complementary IBM tools or enhanced with extensions to meet the needs of organizations that wish to mitigate their risks.

Mastering IPM: API Monitoring for Digital Resilience

APIs (Application Programming Interfaces) have quietly evolved into the backbone of contemporary business operations, even though it's ironic that most people use APIs without even realizing it. For instance, you're ordering your favorite takeaway online; you tap the payment button, and voilà! Through APIs, your payment information swiftly traverses the digital landscape, promptly reflecting the adjustment in your credit card balance.

Start as an AWS reseller a simple guide for MSPs

As cloud adoption accelerates, managed service providers (MSPs) have a major opportunity to capitalize on this trend by reselling Amazon Web Services (AWS). Becoming an AWS reseller allows MSPs to expand their service offerings, achieve recurring revenue, and solidify their status as cloud experts. This comprehensive guide will walk through everything MSPs need to know to successfully start reselling AWS services.

A simple guide to becoming an Azure Reseller for MSPs

As Microsoft Azure continues its rapid growth, becoming an Azure reseller presents a major opportunity for managed service providers (MSPs) to expand their offerings and drive recurring revenue. This comprehensive guide will walk through everything MSPs need to know to successfully start reselling Azure services.

Testing logging code with Microsoft.Extensions.Logging and FakeLogger

Unit testing is most often used for testing business logic. But what if you want to ensure that your code logs important messages to your log store? In this post, I'll introduce you to FakeLogger and how it can be used to test logging code when using Microsoft.Extensions.Logging and the ILogger interface. So, let's start by discussing why to even unit-test logging code. Adding good logging to your code is an often forgotten or down-prioritized practice.

Datadog Conversations: Toyota's Shift to Software-First Mobility

As the world’s largest automotive manufacturer and the leading software-first mobility company, Toyota leans on Datadog to achieve its goals of delivering value to customers and uplifting employees with new technologies and processes. Jason Ballard, IT Executive and General Manager, shares his top priorities for the enterprise in North America and offers his advice for how other leaders in the industry can transform their business.

Home Shopping Europe (HSE) increases customer satisfaction using Elasticsearch on AWS

Home Shopping Europe (HSE), a prominent player in the European live commerce sector, has revolutionized its customer experience by leveraging Elastic on AWS. Elastic's AI and ML features in Elasticsearch deliver accurate and relevant search results. This enhancement has not only elevated click-through rates by 4% but has also significantly reduced maintenance time by 42%, marking a pivotal shift for HSE's e-commerce business.

Honeycomb CCP Games Case Study

Imagine a universe in which a massively multiplayer online role-playing game (MMORPG) sets Guinness World Records for the size of its online space battles—and that game is built on 20-year-old code. Well, imagine no more. Welcome to the world of EVE Online, where hundreds of thousands of players interact across 7,800+ star systems and participate in more than one million daily market transactions. As you might guess, updating and maintaining this codebase without interrupting game play could pose quite a challenge.

IT in Motion: The ScienceLogic Innovation Story

ScienceLogic CEO and Co-founder, Dave Link, jumps on the IT in Motion podcast for a special episode revealing our NEW book, Innovation: Journey and Outcomes for the AIOps Revolution. In this episode, Dave discusses the inspiration for writing the book as well as some of his favorite chapters in the story.

Chaos engineering in an Azure environment: Confident enough to try it?

What could go wrong with your Azure environment? Netflix gave the world two beautiful gifts: a media streaming platform for the general public and a wonderful monkey for the tech community. Enough has been said about the media streaming part, so let's play (or work) with the monkey now. When Netflix let the world know about Chaos Monkey, the tech community took a minute to stand and applaud. Since then, it has been a standard to unleash intentional chaos just to see how robust our tech stacks really are.

Troubleshooting Microsoft Teams & Internet Performance for Multi-Site Businesses with Obkio: Isothermic Case Study

If your enterprise operates manufacturing facilities and multiple store locations, you're well aware of the management and communication challenges that arise from poor application performance, such as Microsoft Teams, and the disruptions caused by Internet VPN issues for both employees and customers. This case study provides a clear path to establishing effective network performance monitoring and troubleshooting these network issues.

8 Key Indicators of a Healthy Website You Should Always Monitor

Hey there, tech enthusiasts! In the bustling digital world, your website’s health is like a heartbeat — vital and an excellent indicator of overall wellness. Ever wondered what makes a website, like a healthy heart, tick just right? We’re here to unveil eight crucial indicators that are essential for a healthy and robust website. And guess what? Your pals at Uptime.com have just the tools to help you keep your finger on the pulse.
Sponsored Post

It's Not Black Magic: Malware & Ransomware in Plain English

It was almost exactly 10 years ago in December 2013 that we wrote our first blog post about detecting CryptoLocker, which was the first sophisticated Ransomware attack of its kind back then. BTW, 2013 was the year of the Boston Marathon bombing, Edward Snowden leaking secret NSA information, Syrians fleeing their home country and Nelson Mandela passing away.

NiCE DB2 Management Pack 5.30

We are thrilled to announce the release of NiCE DB2 Management Pack version 5.30 for Microsoft System Center Operations Manager (SCOM) and Azure Monitor SCOM MI. This latest update introduces a host of exciting features and enhancements, further solidifying NiCE’s commitment to delivering cutting-edge solutions for IBM Db2 monitoring. Let’s dive into the key highlights of the NiCE DB2 Management Pack 5.30.

Data-centric AIOps: The Next Frontier With Observability Pipelines

Data-centric AI is the new frontier in AI, where the models themselves now remain stationary while tools, techniques and engineering practices improve data quality. As Andrew Ng puts it, “Data-centric AI is the discipline of systematically engineering data to build an AI system.”

How to set up on-call compensation

Once you set up an on-call team, the next step is to decide their compensation. There might be several questions in your mind right now: "How do we fairly value on-call time?" "Is it a flat rate or hourly?" and a few others. So we are here to help you set up an on-call compensation system because we know compensating people fairly lays the foundation of a healthy business. Are you still stuck on setting up an on-call team? Read this guide first: 7 steps to set up an on-call team.

'The Story of Grafana' documentary: From one developer's dream to 20 million users worldwide

On Dec. 5, 2013, Torkel Ödegaard made the first commit in GitHub for a personal project that would become Grafana. “It’s hard to believe it’s been 10 years since Torkel launched Grafana, growing from a small man with a big dream to becoming the most popular data visualization software in the world,” says Grafana Labs co-founder and CEO Raj Dutt. “The Story of Grafana” chronicles that meteoric journey.

Maximize branding with custom HTML in status pages

Imagine checking a status page during a service disruption only to be greeted by a generic and impersonal display, devoid of any brand identity or relevant information. A status page without customization feels detached and fails to provide a good digital user experience. In addition, a status page that doesn't match your brand's look and feel can make the communication seem mundane.

Aggregate Data in Cribl Stream to Optimize Your SIEM Data and Its Performance

Cribl Stream offers different ways to optimize data, such as: In this blog, I will focus on the Aggregation use case using the Aggregations function and how you can practically use the Aggregations function to format the output in different ways.

How to Build Dashboards

Reporting and analytics dashboards provide enhanced visibility into your data and the ability to view your most critical metrics via a single source of truth. By using dashboards, your team can easily highlight issues or areas of concern and promptly begin addressing them utilizing the real-time data that a dashboard provides. As well as this they can be utilized to drive data-driven decisions for your organization, enabling greater accuracy for decision-making to drive growth.

Resource Constraints in Kubernetes and Security

The Sysdig 2024 Cloud‑Native Security and Usage Report highlights the evolving threat landscape, but more importantly, as the adoption of cloud-native technologies such as container and Kubernetes continue to increase, not all organizations are following best practices. This is ultimately handing attackers an advantage when it comes to exploiting containers for resource utilization in operations such as Kubernetes.

Augmenting Your DBA Toolkit: Harnessing the Power of Time Series Databases

Database Administrators (DBAs) rely on time series data every day, even if they don’t think of time series data as a unique data type. They rely on metrics such as CPU usage, memory utilization, and query response times to monitor and optimize databases. These metrics inherently have a time component, making them time series data. However, traditional databases aren’t specifically designed to handle the unique characteristics and workloads associated with time series data.

Centralize, triage, and track tickets with Datadog Case Management

Complex systems require many different monitors to assess the health of their infrastructure and applications, creating a wealth of alerts that can be hard to track. Due to a lack of effective triage processes, many organizations page engineers for every alert that comes in, making it difficult to separate false positives from issues that actually require immediate attention.

Analyze the root causes and business impact of production issues with Trace Queries

Tracing provides indispensable insights into the state and performance of distributed applications, but it can often be difficult to determine the root cause or ultimate business impact of issues indicated by traces. Translating visibility of individual microservices into broader performance insights often requires drawing complex correlations between spans. This can be a laborious process, which can complicate everything from troubleshooting and triage to tracking KPIs and managing costs.

Advancing Observability Maturity: Core Benefits

One of the major trends in software development in the last decade has been “shifting left” responsibilities that have traditionally been under operation’s domain to earlier in the software development life cycle (SDLC). It first came in the form of DevOps where a lot of the software engineering best practices were introduced to the deploy, operate, monitor phases. Such examples include continuous integration and continuous deployment (CI/CD) and Infrastructure as Code (IaC).

Sentry .NET SDK 4.0 improvements for .NET 8

As we celebrate the 10th anniversary of Sentry’s support for the.NET ecosystem with over 150 million downloads, we’re excited to announce Sentry.NET 4.0! Building on top of.NET 8.0, this major release includes many exciting new features, including support for Profiling, Metrics, AOT and trimming, native crash reporting, Spotlight, and better.NET MAUI support. Version 4 of the SDK is now available!

Building Large-Scale User Behavior Analytics: Data Validation and Model Monitoring

As the demands of our customers continue to rise, Splunk User Behavior Analytics (UBA) V5.3 now boasts an increased ingesting rate up to 160K EPS from Splunk Enterprise to a 20-node large deployment. This scalability improvement facilitates support for 750K user accounts, 1 million devices, and 64 data sources.

Apply network management protocols to your organization for better results

To address this issue, first understand that, in the digitization we are experiencing, there are multiple resources and devices that coexist in the same network and that require a set of rules, formats, policies and standards to be able to recognize each other, exchange data and, if possible, identify if there is a problem to communicate, regardless of the difference in design, hardware or infrastructure, using the same language to send and receive information.

Speed Test Feature Updates: Speed Test Metrics, Dashboard Widgets & Minimum Speed

Speed Tests stand as crucial tools for evaluating the health and efficiency of a network. In this article, we delve into the significance of Speed Tests, explore the enhanced features introduced by Obkio’s Network Performance Monitoring Tool, and understand the transformative impact of these updates on your network performance monitoring.

Apica Ascent wins Champion of the 2024 Emotional Footprint Awards in Application Performance Management

We are thrilled to announce that Apica Ascent has been honored with the prestigious Champion badge in the 2024 Application Performance Management – Emotional Footprint Awards, hosted by SoftwareReviews, a division of Info-Tech Research Group (ITRG). This accolade is a testament to our commitment to excellence and the positive impact our solutions have on users’ experiences.

Software Maintenance Best Practices for 2024

Businesses rely on software solutions increasingly in our modern age, and it’s constantly evolving. Compared to some of the software being used in the early 2000s, we’ve seen large changes, resulting in more complex frameworks, which come with their own unique changes. As software and systems become more complex, so increases the probability of errors occurring and the level of jeopardy those errors might present.

Latest Top 11 Log Monitoring Tools [Includes Open-Source]

For any software company, a log monitoring tool is a must for collecting, storing, and providing a centralized view of all logs from different applications and hosts for faster anomaly detection, incident resolution, and troubleshooting. They can also help detect security threats and provide audit trails. They are effective in capacity planning, decision-making, and ensuring optimized performance.

Ensuring network reliability: A deep dive into OpManager's failover capabilities

Business continuity is a vital aspect of modern business operations. It is the ability to maintain essential business functions during and after unexpected disruptions or disasters. Downtime, in the context of business continuity, refers to periods when critical systems are unavailable. When such a catastrophe happens, the repercussions can be significant. For one, it can be costly—every moment of system unavailability can result in financial losses.

OpenTelemetry Flask Instrumentation Complete Tutorial

In this article, we will use OpenTelemetry to instrument a sample Flask app for traces. Flask is one of the most popular web application frameworks of Python. It consists of Werkzeug WSGI toolkit and Jinja2 template engine. Instrumentation is the biggest challenge engineering teams face when starting out with monitoring their application performance. OpenTelemetry is the leading open-source standard that is solving the problem of instrumentation.

Monitoring apps based on Falcon Web Framework with OpenTelemetry

Falcon is a minimalist Python web API framework for building robust applications and microservices. It also compliments many other Python frameworks by providing extra reliability, flexibility, and performance. Using OpenTelemetry, you can monitor your Falcon applications for performance by collecting telemetry signals like traces. Instrumentation is the biggest challenge engineering teams face when starting out with monitoring their application performance.

How Often Should You Ping Your Site?

How often should you ping your site? Should you be checking every few minutes, or every hour? Surely you have other ways to detect problems, so maybe just a daily check of your API and main page would be enough, right? While there’s no single right answer for everyone, this post tries to break down how you can find the right cadence for your site checks.

5 Steps to Troubleshoot Issues in Modern Networks

Networks are becoming more elastic, flexible, and agile than ever before. Organizations can now run network functions on commodity hardware, making network design and implementation less rigid and expensive. By modernizing and virtualizing their networks, teams are able to increase capacity and improve security.

Elastic APM for iOS and Android Native apps

Elastic APM for native apps provides auto-instrumentation of outgoing HTTP requests and view-loads, captures custom events, errors, and crashes, and includes pre-built dashboards for data analysis and troubleshooting purposes Elastic® APM for iOS and Android native apps is generally available in the stack release v8.12. The Elastic iOS and Android APM agents are open-source and have been developed on-top, i.e., as a distribution of the OpenTelemetry Swift and Android SDK/API, respectively.

The Top 8 Network Monitoring Tools

Network Monitoring is a process that supplies the information and data that network administrators need to determine, in real-time, the status of their network and if it's running optimally. This enables these administrators to work proactively to highlight deficiencies, enhance efficiency, and more. By utilizing network monitoring you can attain complete visibility into their network.

Resolving a Critical Incident in Core Banking: A Deep Dive into Application Patch Malfunction

In the dynamic environment of core banking systems, maintaining seamless operations is crucial. However, unforeseen complications can arise, leading to critical incidents that demand immediate and effective resolution. A recent incident involving an application patch malfunction presents a compelling study on the intricacies of managing and resolving system anomalies in real-time.

Unlocking the Power of IIoT with Time Series Databases

This article was originally published on IIoT World and is reprinted here with permission. In the rapidly evolving world of Industrial Internet of Things (IIoT), organizations face numerous challenges when it comes to managing and analyzing the vast amounts of data generated by their industrial processes. Data generated by instrumented industrial equipment is consistent, predictable, and inherently time-stamped.

Building resilience in cloud: Strategies, advantages, and considerations

Cloud resilience When it comes to cloud computing, resilience is an infrastructure's ability to bounce back from setbacks seamlessly, ensuring uninterrupted operations in the face of outages, malfunctions, software bugs, and even natural disasters. We'll explore measures you can take to enhance resilience in your cloud, plus discuss the advantages and limitations of building a resilient cloud system.

The Top 9 Dynatrace Alternatives & Competitors in 2024

Are you looking for a Dynatrace alternative? Then you have come to the right place. In this article, we will go through the top 9 Dynatrace alternatives. First, let's briefly discuss what Dynatrace offers and why you might consider other solutions. Dynatrace is a leading observability and application performance management (APM) platform, providing deep insights into application performance and reliability.

Streamlining Cloud Operations by Unifying Security & Observability

Many companies are using cloud technologies to become more agile, scalable, and cost-effective during their digital transformation. However, this change brings new challenges in maintaining the security and performance of applications and infrastructure in the cloud. Security and observability go hand-in-hand.

5 Steps to Optimizing Microsoft Teams Performance

In the fast-paced landscape of modern workplaces, efficient communication and collaboration are paramount for success. Microsoft Teams has emerged as a cornerstone tool for many organizations. However, persistent and often unseen performance issues such as poor audio or video quality can stifle productivity and have a negative impact on the customer experience. Optimizing Microsoft Teams will allow you to use the platform to its peak performance for maximum productivity.

Your Practical Guide to Reducing MTTR

Let’s face it. Incidents will always happen. We simply can’t prevent them. But we can strive to mitigate the impact incidents have on our product and customers. Ensuring high reliability depends on quickly and effectively finding and fixing problems. This is where the metric MTTR, standing for “mean time to restore” or “mean time to resolve,” becomes valuable for organizations.

Quickly spot and revert faulty deployments with Change Overlays

Faulty deployments and other types of erroneous changes may account for around 70% of all application outages. With the prevalence of CI/CD workflows, engineering teams make changes to their applications, services, and infrastructure all the time, which can make it difficult to trace issues to specific changes.

Introducing Grafana 10.3

Grafana 10.3 is here! From improving your ability to create and navigate complex canvas panels to monitoring via anonymous access control, this release is all about enhancing efficiency and clarity in your observability journey. In this video, learn more about: Canvas Pan and Zoom Improved Tooltips Metric Analysis Alerting enhancements Multi-stack data sources Anonymous access control Stay with us through this playlist to delve deeper into each addition and maximize your Grafana 10.3 experience.

Datadog on Kubernetes Autoscaling

Datadog, the observability platform used by thousands of companies, runs on dozens of self-managed Kubernetes clusters in a multi-cloud environment, adding up to tens of thousands of nodes, or hundreds of thousands of pods. Also, this infrastructure is used by a wide variety of engineering teams at Datadog, with different features and capacity needs that may also change overtime.

This Month in Datadog: Dynamic Instrumentation, Log Pipeline Scanner, Network Device map, and more

Datadog is constantly elevating the approach to cloud monitoring and security. This Month in Datadog updates you on our newest product features, announcements, resources, and events. This month, we put the Spotlight on Dynamic Instrumentation..

Livestream: Client side monitoring & metrics for Kafka using OpenTelemetry & SigNoz

In this livestream, we will walk through a demo of how to get client side insights from Kafka using distributed tracing. We will take a NodeJS producer and consumer setup communicating via Kafka to show how one can instrument this with OpenTelemetry, and get metrics from a client perspective. We will also touch on getting Kafka metrics using OpenTelemetry receivers.

How to effectively streamline AD actions with automation

Organizations worldwide use Active Directory (AD) to manage users, devices and data. The world moves at a fast pace, and it demands that tasks be performed as quickly and efficiently as possible. How many times have you had to create a user account in AD manually? Change passwords? Update group memberships? You could add so many other repetitive AD administrative tasks to this list.

Elevate Your IT Infrastructure Monitoring and Automation with Microsoft System Center

Are you grappling with the complexity and time-consuming nature of identifying and resolving infrastructure issues? We understand the challenges that can arise, impacting service quality and efficiency. Join us for an insightful webinar, “Microsoft System Center | Infrastructure Monitoring and Automation in Action,” where we will unveil the power of NiCE and Kelverion in automating your infrastructure management.

Monitoring Django application performance with OpenTelemetry

Django is a popular open-source python web framework that enables rapid development while taking out much of the hassle from routine web development. It also helps developers to avoid common security mistakes. As such, many applications are built with Django. Django is very popular among web developers and has a huge community behind it. It gives web developers ready-to-use components for common things that you will need to accomplish for a web application.

Latest top 17 API monitoring tools [open-source included]

Choosing the right API monitoring tool is critical. How do you know which is the right API monitoring tool for you? Here are the top 17 API monitoring tools, including open source tools for API performance monitoring. In this article, we will review the top 17 API monitoring tools which you can use for monitoring your APIs. But first, let’s have a brief overview of APIs.

What Is Network Monitoring and Why Is It Essential?

Network monitoring is an essential pillar of maintaining a healthy IT infrastructure. Without an effective network monitoring system in place, your organization could be losing out on better performance, greater efficiency and increased cost savings. In this guide, we'll walk you through everything you need to know about network monitoring to understand what it is and why it’s critical for your operations.

Better Practices for Connecting Cribl Stream to Many Splunk Indexers

Cribl Stream and Cribl Edge can send data to Splunk in several different ways. In this blog post, we’ll focus on the common scenario where you want to connect Cribl Stream’s Splunk Load Balanced Destination to many Splunk Indexers at once. (We’ll talk about Cribl Stream, but what we say applies to Cribl Edge, too.) Cribl Destinations settings default to reasonable values. Sometimes Cribl Support recommends changing those values for better results in a given situation.

Using Kentik Journeys for Network Troubleshooting

Kentik Journeys uses an AI-based, large language model to explore data from your network and troubleshoot problems in real time. Using natural language queries, Kentik Journeys is a huge step forward in leveraging AI to democratize data and make it simple for any engineer at any level to analyze network telemetry at scale.

The Business Cost of Downtime and How AIOps Enables Faster Fixes

IT downtime is no doubt a costly business. As soon as service starts to degrade, companies start to lose money. Studies by Gartner and IBM show that the average cost of unplanned downtime to enterprises ranges between a staggering $5,600 and $9,000 per minute. For ecommerce businesses, like Amazon, the stakes are even higher, potentially resulting in a loss of up to $220,000 for every minute of downtime.

Why AI is crucial to your hybrid observability strategy: LogicMonitor's latest innovations

At LogicMonitor, we are deeply committed to a mission that goes beyond the conventional: revolutionizing IT monitoring through hybrid observability powered by AI. This ambition is not merely a slogan but the cornerstone of our entire approach. Our LM Envision platform was purposely designed to bring together diverse IT environments under one seamless, integrated experience. Enterprises have complex IT ecosystems.

Full Stack Clarity Troubleshooting Android OpenTelemetry

Developing a native Android app is a challenging task that requires a deep understanding of the Android SDK, as well as programming languages such as Java or Kotlin. The process requires navigating various tools, frameworks, and APIs, each with its own rules. On top of that, you need to ensure compatibility and optimal performance across the diverse Android ecosystem, with its multitude of devices, screen sizes, and OS versions.

The Crucial Role of Microsegmentation in 2024: Enhancing Cybersecurity in a Hybrid World

In the ever-evolving landscape of cybersecurity, the year 2024 presents unprecedented challenges and opportunities. As organizations continue to embrace digital transformation, the need for robust security measures has never been more critical. New and emerging threats posed by Generative AI, Unsecured API integrations, agile cloud environments, and easy access to sophisticated nefarious code creation are driving the increase in the frequency, volume, and success rate for cybercriminals.

The New AWS Public Monitoring Agent: AWS Canada West

Exciting news is on the horizon! We're stoked to share that Obkio’s new AWS - Canada West Public Monitoring Agent is now live! Just a month after AWS announced its first-ever data center in Western Canada (and second in Canada), Obkio has launched a brand new Monitoring Agent, allowing current and future customers to monitor network performance from their network locations up to the AWS infrastructure in Calgary.

Monitor Windows Performance Counters with Datadog

The Windows operating system exposes metrics such as CPU, memory, and disk usage as built-in performance counters, which provide a unified way to observe performance, state, and other high-level facets of Windows subsystems, components, and native or third-party applications. As such, Windows Performance Counters can be invaluable for monitoring resource usage and the health of your infrastructure, as well as systems your services are using.

The Key Role of Cloud Observability in Ensuring Security

The utilization of cloud-based technologies developed to optimize and streamline business operations is far from a novel idea. In fact, research suggests at least 90% of modern organizations currently use cloud platforms and related technologies to oversee essential processes.

How to wait for a specific API response in your Playwright end-to-end tests

Learn in this video how to monitor network HTTP calls in your end-to-end tests and use Playwright's "waitForResponse" method to capture specific network responses. This approach allows you to wait for specific API calls to validate if you website or app shows the correct data.

Beyond deployment: The ongoing challenges in application performance monitoring implementation

In the age of digital acceleration, application performance monitoring (APM) acts as a sentinel, empowering organizations to maintain, analyze, and optimize the health of their digital ecosystems. However, as organizations navigate the intricacies of distributed architectures, hybrid cloud deployments, and dynamic workloads, they confront a complex terrain marked by data proliferation, siloed environments, and a scarcity of skilled personnel.

DataDog vs Prometheus - Comprehensive Comparison Guide [Updated for 2024]

Both DataDog and Prometheus are application monitoring tools aimed to improve application performance. While Datadog is a cloud-based SaaS solution, meaning there's no need to install or maintain any infrastructure, Prometheus is an open-source tool that requires manual download and installation on your infrastructure. Let us compare DataDog and Prometheus to see which tool suits The biggest difference between Datadog and Prometheus is that while Prometheus is open-source, Datadog is proprietary.

6 Best Statuspage Alternatives in 2024

A status page serves as a vital communication tool, offering real-time updates on the operational status of a service or website. Businesses leverage status pages to enhance transparency, build trust with users, and proactively address potential issues. An effective status page minimizes downtime impact, fosters customer loyalty, and demonstrates a commitment to customer satisfaction, making it an essential component for maintaining a positive online presence.

Exploring logs, metrics, and traces with Grafana - Grafana for Beginners Ep. 7

Exploring logs, metrics and traces for the first time could be an overwhelming experience if you don't know where to start. Join Senior Developer Advocate, Lisa Jung to get the 101 on using the Grafana explore tool and start exploring your data! Best practices.

New in Grafana k6: The latest OSS features in v0.49.0 and static IPs in Grafana Cloud k6

Grafana k6 v0.49.0 has been released, featuring a built-in web dashboard for real-time result visualization and tons of other improvements for Grafana k6 OSS. Here’s a quick overview of the latest features in Grafana k6 v0.49.0, as well as some other exciting updates related to Grafana Cloud k6 and the k6 ecosystem. To learn more about k6 and performance testing, check out the Grafana Labs blog.

Azure Cost Reporting to boost cloud resilience and reduce costs

Managing costs within your Azure datacenter is a crucial aspect of ensuring efficiency and optimizing resources. The Azure portal has Azure Cost Management Reports embedded, offering a detailed lens into your cloud spending. In this article, we’ll explore the ins and outs of these reports, their key metrics, best practices, and how to generate and interpret cost reports.

Azure Pay as You Go Vs Reserved Instances

When dealing with public cloud computing, deciding to reserve or pay-as-you-go for your resources is generally seen as a strategic chess move – it requires foresight, planning, and a clear understanding of your organization’s needs. In this article, we’ll browse through the nuances of this decision-making process, exploring overviews, benefits, limitations, pricing considerations, break-even points, and ultimately, as a desired outcome, reaching a well-informed conclusion.

Upcoming Homelab plan!

For full details on the plans and prices, check out our pricing page. Netdata’s vision is to democratize observability and make it accessible to everyone. Whether you are a startup or a multinational corporation, a business user or a home lab user, a non-profit organization or a student - we want you to be empowered with the very best that Netdata can offer.

Unleashing the Potential of SVGs: A Guide to Dynamic Visualization and Monitoring

In the dynamic realm of monitoring Kubernetes clusters, effective visualization is paramount for gaining insights into system health and performance. One versatile tool that has gained prominence in this domain is Scalable Vector Graphics (SVGs). In this blog post, we’ll delve into the usage of SVGs, explore different implementation methods, weigh the pros and cons, and discuss why they are indispensable for monitoring Kubernetes with Icinga2.

Podcast - The Power of Observability and Automation of Citrix Technologies with eG Innovations

The Citrix Ready team recently recorded a podcast with eG Innovations for their Tech Fusion podcast series. Hosted by Neil C. Hughes from The Tech Blog Writer, Wendy Howard from eG Innovations’ pre-sales, and Manjunatha Gali from Citrix Ready discussed how eG Enterprise enhances and goes beyond native Citrix monitoring tools with its unique observability and automation features. You can listen to the podcast: They covered a wide range of topics, including.
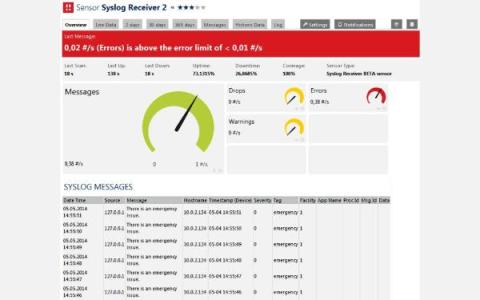
Time Series Data: The Core of Network Monitoring

When it comes to network monitoring, time series data is a transformative force, revolutionizing how network engineers monitor and manage their networks. By capturing and analyzing data points over time, time series data provides a detailed and dynamic view of network performance, enabling network professionals to identify trends, patterns, and anomalies that might otherwise go unnoticed.

The First 48 Hours of Ransomware Incident Response

The initial response to a ransomware attack is crucial for determining the damage in terms of downtime, costs, data loss and company reputation. The sooner you detect the activity associated with ransomware, the sooner you can slow its spread. From there, you can take remedial actions to significantly reduce the effects of the attack.

Anodot vs. Flexera: Which is the smart option for FinOps practitioners?

Our solution (Anodot) and Flexera are two possible options for FinOps in enterprise cloud environments. With over 85% of organizations projected to adopt a cloud-first approach by 2025, finding a partner who can navigate the ever-evolving world of FinOps for cloud success is crucial. So, which solution actually makes good on their promises? Let’s look at both providers and see whose features truly embrace a FinOps approach in the cloud.

Self Hosted Retrace - For your Data Governance, Centralised Control needs

Our customers can now get a self hosted Retrace, where their own data will never leave the Azure cloud environment. Stackify by Netreo will deploy and manage the Retrace platform that includes infrastructure components and software. Customer will get the access to the Retrace within their corporate domain, rather than public internet.

Unveiling IT Challenges: Decoding Microsoft Teams' Hidden Issues

In a bustling office, meet Sarah, tasked with ensuring Microsoft Teams functions seamlessly. However, dissatisfied users often refrain from reporting issues, leaving Sarah in constant firefighting mode. Join her journey as she unveils strategies to detect and resolve hidden Teams performance problems, shifting from firefighting to staying ahead. Discover how you can transform your IT strategy for a smoother workplace with Microsoft Teams.

Open Source Observability with OpenTelemetry and ChecklyDescription

We need to monitor our service's performance, but large closed SaaS options are expensive and complex. OpenTelemetry is the 'wave of the future' for observability, but is it ready for your team? Yes! Join Nočnica to see a demonstration of instrumenting a demo application and learn what OpenTelemetry can do. We'll also add external site monitors with Checkly synthetics checks.

Track and alert on Amazon CloudWatch Network Monitor metrics with Datadog

Amazon CloudWatch Network Monitor, available as part of Amazon CloudWatch, is a network monitoring service that enables you to create customizable monitors for your network connectivity from AWS to on-premises infrastructure via AWS Direct Connect (DX).

StackState Observability Vision

Join Andreas Prins, CEO of StackState, as he discusses the evolving landscape of application monitoring and the persistent challenges in achieving application reliability. Discover why StackState stands out with its modern observability solution, trusted by leading banks, insurers, and infrastructure operators worldwide. Learn how StackState observability platform is revolutionizing the way development teams understand, navigate, and remediate issues within their IT environments.

How to Monitor Internet Multihoming Networks: From A to Z

As our networks change and evolve, businesses alike are increasingly reliant on the Internet for communication, collaboration, and data exchange. With the demand for uninterrupted connectivity at an all-time high, many businesses are turning to Internet multihoming setups to enhance their network performance and ensure a seamless online experience for their users.

Behind the Scenes with the Splunk Brand Refresh

Splunk had just celebrated its 20th anniversary. The business was growing. Customers were loyal. So why would we consider refreshing our brand? The answer is simple, if you aren’t growing, you’re declining. Just like people, brands need to adapt and grow so they stay relevant. For us, part of our growth was reaching new audiences and launching new products. Which meant as brand stewards, we needed to update our brand to better connect with these new opportunities.

ScienceLogic Chronicles Pioneering AIOps Journey in New Book "Innovation: Empowering IT Operations for the Future"

ScienceLogic announces the publishing of a new book, "Innovation: Journey and Outcomes for the AIOps Revolution," that chronicles the journey of the company as a trailblazer in IT Operations Management (ITOM) and the ever-expanding realm of AIOps. Authored by CEO David Link, the book delves into the narrative of how the ScienceLogic SL1 platform has grown to empower organizations to navigate the intricate challenges of managing complex, distributed IT services with unparalleled speed, scale, and real-time precision.

Visibility, scalability, security: Why IPAM is the cornerstone of robust data centers

Data centers have been transformed with the evolution of new challenges and technologies from strictly on-premises environments to remote locations. Though this provides a lot of advantages, this development comes with its own challenges. Managing this cluster of devices requires precision planning, and modern hybrid architectures don’t end with mere devices.

OpenTelemetry Nestjs Tracing Implementation Guide [2024 Updated]

Nestjs is a Nodejs framework for building scalable server-side applications with typescript. It makes use of frameworks like Express and Fastify to enable rapid development. It has gained wide popularity in recent times, and many applications are making use of the Nestjs framework. Using OpenTelemetry client libraries, you can monitor your Nestjs application. Monitoring your Nestjs application is critical for performance management.

Spans - a key concept of distributed tracing

Spans are fundamental building blocks of distributed tracing. A single trace in distributed tracing consists of a series of tagged time intervals known as spans. Spans represent a logical unit of work in completing a user request or transaction. Distributed tracing is critical to application performance monitoring in microservice-based architecture. Before we deep dive into spans, let's have a brief overview of distributed tracing.

Kibana vs. Grafana - A Scenario-Based Decision Guide [2024]

Both Kibana and Grafana are data visualization tools providing users capabilities to explore, analyze and visualize data with dashboards. The difference between Kibana and Grafana lies in their genesis. Kibana was built on top of the Elasticsearch stack, famous for log analysis and management. In comparison, Grafana was created mainly for metrics monitoring supporting visualization for time-series databases.

Top 14 ELK alternatives [open source included] in 2024

ELK is the acronym Elasticsearch, Logstash, and Kibana, and combined together, it is one of the most popular log analytics tools. Elastic changed the license of Elasticsearch and Kibana from the fully open Apache 2 license to a proprietary dual license. The ELK stack is also hard to manage at scale. In this article, we will discuss 14 ELK alternatives that you can consider using.

A Lightweight Open Source ELK alternative

ELK is the acronym Elasticsearch, Logstash, and Kibana, and combined, it is one of the most popular log analytics tools. Elastic changed the license of Elasticsearch and Kibana from the fully open Apache 2 license to a proprietary dual license. The ELK stack is also hard to manage at scale. SigNoz can be used as a lightweight alternative to the ELK stack.

Exploring the Synergy Between Testing and Monitoring in Software Development

The roles of testing and monitoring often intersect, yet they maintain distinct identities. In my near-decade in the tech sector I've observed how end-to-end (E2E) tests and synthetic monitoring, despite common frameworks and requirements, often fail to benefit from collaboration and synergy.

What is a content delivery network and why is it important

what-is-a-cdn A content delivery network (CDN) is a distributed network of servers strategically positioned across the globe to enhance the delivery speed and performance of web content to users. The primary purpose of a CDN is to reduce latency and improve the user experience by bringing content closer to the end users. Imagine you are the owner of a popular e-commerce website that sells an extensive range of products to customers worldwide.

Understanding Hybrid IT Environments

In today's tech landscape, businesses are undergoing a significant shift in how they manage their IT infrastructure. Cloud computing has been a huge force in this transformation, leading to a blend of on-prem and cloud-based services known as hybrid IT. With a hybrid IT infrastructure, you can take advantage of both the control and security of on-prem solutions, as well as the scalability and flexibility of cloud architecture. But is hybrid IT right for your business?

Top 10 Managed Service Providers in the US - Best MSPs of 2024

The future is tech. There’s no doubt there. AI and cloud computing have all grown over the last decade, but great growth comes with great growing pains. That’s where managed service providers (MSPs) come into play. MSPs solve the growing pains of migrating to the cloud, cybersecurity risks, or outgrowing your current tech stack.

The Story of Grafana | Episode 4: Evolution | Grafana Documentary

From an open source project to an open observability platform, Grafana's evolution continues to drive massive adoption and impactful use cases worldwide. The story of Grafana has only just begun. As we wrap up the Grafana 10th anniversary documentary with this final episode, we'd like to give special thanks to the Grafana community and extended open source ecosystem for all of the contributions and support this past decade. There's so much more to look forward to and we can't wait for what's next!

Monitor your OpenStack components with Datadog

OpenStack is an open source cloud platform that enables customers to provision and manage compute, storage, and networking resources via web-based dashboards or APIs. OpenStack offers a range of services beyond standard infrastructure-as-a-service functionality, including orchestration, fault management, and service management components. These components help customers build, maintain, and scale high-availability applications.

Mastering IPM: Protecting Revenue through SLA Monitoring

If you’re an SRE, then you already know your SLOs from your SLAs, not to mention your SLIs. But even if you’re not au fait with those acronyms, you’ll soon discover how widespread and applicable these concepts are in this installment of our IPM Best Practices Series. We’ll explore these concepts in detail and explore how external monitoring can enhance the tracking of Service Level Objectives (SLOs), leading to positive user experiences and informed decision-making.

Improving workflow performance through a unified observability experience

Unified observability experience from Cisco delivers seamless Observability across your hybrid and cloud native applications. Focus on lower Mean Time to Resolution (MTTR)! In today’s press release, Cisco Unveils New Innovations on the Cisco Observability Platform, we announced a host of exciting innovations.

Taming Tetragon With Cribl.Cloud

Did you know you can deploy Tetragon and parse high-volume logs with Cribl Edge? It’s true! Tetragon integrates seamlessly with Cribl Edge. This combination enhances monitoring capabilities in Linux environments. Have your cake and eat it, too. With a combined Cribl and Isovalent solution, you can deliver deep insights into your workloads, optimizing for your specific operational requirements with zero loss of data fidelity.

Data Sovereignty and OpenTelemetry

In today’s economic and regulatory environment, data sovereignty is increasingly top of mind for observability teams. The rules and regulations surrounding telemetry data can often be challenging to interpret, leaving many teams in the dark about what kind of data they can capture, how long it can be stored, and where it has to reside. In the past, addressing these issues at scale was a costly endeavor.

The Story of Grafana documentary: From dashboards to full-stack observability and beyond

Beehives in backyards. Rocket launches in California. Sourdough starters in mason jars. Shipping containers growing strawberries in Paris. “The stories you can tell from just a graph were really surprising,” says Grafana creator Torkel Ödegaard. But not impossible with Grafana, the ubiquitous open source visualization tool that is not just for monitoring applications.

AI vs. ML: What's the Difference? + What is #aiops in 60 Seconds | #backtobasics | LogicMonitor

Ever wonder what #machinelearning (#ml) really means? Or how it's different from #ai? What even is #aiops? This #BackToBasics short explains it ALL in plain English! #shorts Follow us...

Cisco AppDynamics for SAP in Manufacturing: an analysis of challenges and solutions

In this Cisco Cloud Observability video, Matt Schuetze delves into the complex challenges that define today's manufacturing business landscape—and how Cisco AppDynamics can integrate with SAP environments to address them. The video offers an essential understanding of the manufacturing industry’s challenges and the role SAP plays in it. Matt explains Cisco AppDynamics’ unique capability to link business process steps and flows to the underlying ABAP code and HANA database calls, providing a direct connection to user experience within the SAP environment.

Combining tracing and profiling for enhanced observability: Introducing Span Profiles

In today’s complex data landscape, continuous profiling has become essential for detailed insights into application resource usage. Grafana Labs is now advancing this field with the introduction of Span Profiles in Grafana 10.3. The Span Profiles feature represents a major shift in profiling methodology, enabling deeper analysis of both tracing and profiling data. Traditional continuous profiling provides a system-wide view over fixed intervals.

Maximizing efficiency: How to restore configurations and reduce network downtime

Are you tired of experiencing network downtime due to device configuration issues? Well, here's a simple solution for you: Learn how to restore configurations and minimize network downtime. It's easier than you think, and with the right steps, you'll be up and running in no time. So, why wait? Let's get started!

Will Broadcom's plans for VMware affect you?

It is an unsettling time for many of our partners and customers, particularly those leveraging VMware technologies such as VDI and server virtualization, with uncertainty of Broadcom’s plans after their recent acquisition of VMware and likely changes to licensing costs, SKUs, product availability and so on.

Understanding the Critical Role of Infrastructure Monitoring

In today’s business landscape, where everything is connected through computers and networks, the Role of Infrastructure Monitoring has become paramount. If we go through the previous year’s reports, around 76% of organizations became victims of ransomware attacks in 2022. It was also predicted that the year 2023 might experience a security breach of 33 billion accounts.

The Importance of Mobile Responsiveness in Website Monitoring

In the ever-evolving landscape of tech, finance, and real estate, you, as a DevOps veteran or SRE newbie, have to juggle a myriad of tasks. One minute, you’re decoding a labyrinth of code, and the next, you’re deciphering the enigma of server management. Amid this digital juggling act, the role of mobile responsiveness in website monitoring emerges as your silent, yet ever-vigilant, backstage hero.

6 best practices for application performance monitoring

In today’s digital era, where applications are the lifeline of many businesses, the importance of monitoring and observing their performance is undeniable. It’s not just about keeping systems up; it’s about understanding how applications behave and ensuring they meet the ever-growing expectations of users. Let’s take a look at six best practices in application performance monitoring that organizations can implement to set themselves up for success.

Monitoring your FastAPI application with OpenTelemetry

FastAPI is a modern Python web framework based on standard Python type hints that makes it easy to build APIs. It's a relatively new framework, having been released in 2018 but has now been adopted by big companies like Uber, Netflix, and Microsoft. Using OpenTelemetry, you can monitor your FastAPI applications for performance by collecting telemetry signals like traces. FastAPI is one of the fastest Python web frameworks currently available and is really efficient when it comes to writing code.

5 ways network compliance makes your life easier as a network admin

As a business owner, if you want to ensure your success, you must establish and maintain network compliance. It may seem demanding, but by having a solid understanding of the laws and standards that apply to your industry, you can overcome many challenges that may arise. If you operate in industries like finance and healthcare, complying with numerous regulations may seem even more daunting, but it's crucial to demonstrate your commitment to delivering exceptional quality.

Goliath Introduces an Industry-First AI Troubleshooting Assistant Reshaping How IT Support Teams Address User Issues Requiring Deep Citrix or Horizon Expertise

PHILADELPHIA, February 5, 2024 — Goliath Technologies, a leader in end-user experience monitoring and troubleshooting software, today announced the general availability of Goliath Performance Monitor 12.1.1, bringing AI into the service of IT Administrators to address the need for additional Citrix and Horizon expertise.

Client-side Logging: Optimize Performance and Enhance the User Experience

Performance optimization is crucial when developing user-centric applications. To achieve better performance, it is essential to maintain effective log management. Client-side (user) logging is vital in driving website traffic or increasing user engagement with your applications. After deploying an application or a web browser, client-side information, such as user behavior, events, and errors, is not stored by default.

Infinity plugin for Grafana: Grafana Labs will now maintain the versatile data source plugin

Grafana was initially renowned for its ability to help users visualize time series data for platforms like Graphite and Elasticsearch. However, as the landscape evolved, demand surged for Grafana to embrace a wider array of data formats, particularly from third-party APIs.

Elevate Your Shopify Design: 6 Steps to Improve Your Shopify Store Design

As of 2024, there are over 4.8 million live websites powered by Shopify. With a substantial 16.36% of the global e-commerce market share since 2023, Shopify has firmly established itself as a powerhouse in the realm of e-commerce. In the U.S. market, its dominance is even more pronounced, commanding about 28% of the e-commerce software market last June 2023. This impressive growth trajectory highlights Shopify’s effectiveness in providing businesses with the tools they need to succeed online.

Monitoring Cribl Stream with Elasticsearch

Are you managing a Cribl environment? We love that for you; you’re at the forefront of complex data orchestration. As the steward of this dynamic data ecosystem, you have to manage and optimize the flow of information from diverse sources. As data volumes grow, the struggle gets even more real. No worries, though. You’ve got Cribl Stream. Monitoring Stream is critical.

Addressing the Visibility Gaps Posed by Wi-Fi Networks

In recent years, Wi-Fi has emerged as the de facto architecture for local area networks (LANs) and campus networks. Wi-Fi is also gaining more widespread usage in factories and operational technology environments. Despite its ubiquity, Wi-Fi presents some persistent challenges for network operations center (NOC) teams.

Resources for Tasks in InfluxDB 3.0

If you’re an InfluxDB v2 user, you might be wondering what happened to the task engine in InfluxDB 3.0. The answer is that we removed it in order to support broader interoperability with other task tools. V3 enables users to leverage any existing ETL tool rather than being locked into the limited capabilities of the Flux task engine.

Universal Profiling: Detecting CO2 and energy efficiency

A while ago, we posted a blog that detailed how we imported over 4 billion chess games with speed using Python and optimized the code leveraging our Universal ProfilingTM. This was based on Elastic Stack running on version 8.9. We are now on 8.12, and it is time to do a second part that shows how easy it is to observe compiled languages and how Elastic®’s Universal Profiling can help you determine the benefit of a rewrite, both from a cost and environmental friendliness angle.

How Autodesk engineers better service and own their infrastructure.

Morgan Goose, Autodesk, shares how he and his team have democratized observability and made it a default offering for all their engineers. Autodesk is a global leader in software for people who design and make the world. That includes software for architects, builders, engineers, 3D artists, and production teams. To ensure the best customer experience, Autodesk has partnered with Datadog and is taking advantage of products like DBM to quickly identify and maintain the systems they instrument.

What is the Benefit of Including Security with Your Observability Strategy?

Observability strategies are needed to ensure stable and performant applications, especially when complex distributed environments back them. Large volumes of observability data are collected to support automatic insights into these areas of applications. Logs, metrics, and traces are the three pillars of observability that feed these insights. Security data is often isolated instead of combined with data collected by existing observability tools.

Kubernetes 2024: Challenges and solutions

Kubernetes has become the world's leading container orchestration platform, aiding small-scale to large-scale businesses in automating, autoscaling, and managing application deployments. Before delving deeper, let's understand why cloud-native solutions like Kubernetes have become the world's—especially organizations'—favorite technology. Creating highly scalable, resilient applications requires flexible infrastructure management.

Network Performance Monitoring FAQs

There is an abundance of resources, tips, and tools available to network administrators and business owners to help improve their network performance. However, the wealth of information can be overwhelming, often leaving you more confused than enlightened. Whether you're a seasoned network administrator or a business owner navigating the intricacies of digital infrastructure, we've meticulously compiled essential information.

6 Benefits of an AI-Powered Observability Pipeline

Observability Pipelines have become vital tools for DevOps and Security teams to manage, control, store, route, and optimize telemetry data analyzed by Security Information and Event Management (SIEM), Application Performance Monitoring (APM), and Log management platforms. These teams spend hours every week trying to fit an increasingly large volume of data into the same size box.

The 4 Best Datadog Alternatives for 2024

If you work as a CTO, then you already know that having robust monitoring and analytical tools for your technology stack is a prerequisite to getting your job done right. Many companies that started off using Datadog discovered that it can become prohibitively expensive and complex when they needed to scale. As such, there are a lot of people out there currently seeking out alternatives.

5 key SLA metrics for improved SLA monitoring using Applications Manager

Ensuring top-notch service delivery to end users is vital for every organization to produce world-class products and establish a successful business empire. No matter how big or small the organization is, setting up quality service expectations and bringing them into reality within the minimal delivery time limit is the key to thrive in today’s hyper-competitive market. But how do you guarantee that the services you provide are meeting the quality expectations of your customers?

Five worthy reads: Understanding low-code/no-code AI: App development simplified

Five worthy reads is a regular column on five noteworthy items we’ve discovered while researching trending and timeless topics. This week, we will delve into low-code/no-code AI, its potential, and how it can facilitate application development. In a world that is advancing technologically, AI could be one of the greatest things the internet industry has ever witnessed. We have heard so much about AI over the past decade as it has increasingly been deployed in various sectors.
Sponsored Post

Ensuring software quality with integration testing

Before the Raygun API limited release last year, we'd been consistently receiving requests for a public API for a long time, to provide a way for our customers to access their Raygun data programmatically. We're now proud to say we're providing a public API with a range of endpoints, but it took us a lot of planning and development to get here! In this post, I'd like to take you back to the beginning of development on our big API project. Specifically, I want to walk through the pivotal decisions we made around testing when we started development on the project, and how (and why) these have paid off.

DronaHQ for Building Monitoring Applications With InfluxDB 3.0

DronaHQ is a cloud-based platform designed to simplify the process of building and deploying business applications. It serves as a low-code development environment, enabling users—even those with limited technical expertise—to create custom applications quickly and efficiently. The platform offers a range of tools and features, including drag-and-drop interfaces, pre-built templates, and integrations with various databases and APIs.

Where Does Honeycomb Fit in the Software Development Lifecycle?

“Mommy, where does software come from?” “Software grows in a circle, just like this!” The software development lifecycle (SDLC) is always drawn as a circle. In many places I’ve worked, there’s no discernable connection between “5. Operate” and “1. Plan.” However, at Honeycomb, there is. More on that later.

A Beginner's Guide to Structured Logging

Structured logging is a methodical approach to log management in software development, often utilizing JSON or key-value pairs. This method enhances the comprehensibility and analytical efficiency of log data, particularly in complex and distributed system environments. Unlike unstructured logs, which lack a defined format, structured logs adhere to a standardized layout, facilitating streamlined analysis and troubleshooting.

How We Fixed a Big Memory Problem on an App Server written in C++

In server management, high memory utilization is more than just a metric; it’s like a lighthouse signaling potential performance degradation, service disruption, and, in severe cases, complete system downtimes. Here we delve into a recent incident involving an App Server for one of our customers, which underscores the criticality of proactive monitoring, swift incident response, and strategic problem resolution.

eBPF: Revolutionizing Observability for DevOps and SRE Teams

Whether you're a system administrator, a developer, or any other DevOps or Site Reliability Engineering (SRE) professional, you know that staying ahead in cloud-native computing is crucial. One way to keep your competitive edge in the technology game is to embrace the benefits of eBPF (Extended Berkeley Packet Filter). On top of advances in security and networking, eBPF-based tools are particularly impacting the observability landscape.

Unlocking Revenue Potential: Mastering Teams Performance for Seamless Business Communication

In today’s digital age, seamless communication is the lifeblood of every successful business. For revenue-driven teams, mastering Teams performance is central to collaboration, client interaction, and overall operational efficiency. In fact, a recent report published by research firm EMA found that sales personnel use Microsoft Teams more than 5 hours per day on average, and 49% said that Teams has a direct impact on customer service & revenue.

How Much Does Network Monitoring Cost? Software Pricing

In this increasingly digital world, advanced network monitoring software that can address possible networking issues, provide real-time polling performance assessments, and offer remote management functions has become even more necessary. Given these varied capabilities, you may wonder, “How much does network monitoring cost?” and what are the factors contributing to it?

How Much Does Cloud Monitoring Software Cost?

The goal of any great cloud monitoring tool is to give you a bird’s eye view of your system and its digital assets so that you can potentially improve user experiences. Unfortunately, many organizations struggle to realize the extent of functionality of their tools, leading to a bloated budget with many unused applications.

Visually replay user-facing issues with Zendesk and Datadog Session Replay

Zendesk provides support teams with an integrated solution for processing all types of customer inquiries and feedback. But as organizations scale, support tickets can multiply, making it difficult to parse customer feedback and investigate issues promptly and thoroughly. Customers often report problems without providing the detailed context needed for effective troubleshooting.

The 4 Best Status Page Software for 2024

As someone tasked with handling the pitfalls and consequences of unwanted downtime, it can be difficult to keep up to date with the latest software developments working to address these undesirable yet inevitable situations. And yet, whilst recognizing this fact is a necessary condition of overcoming such challenges, it is not in itself sufficient to meet the task.
Sponsored Post

Take control of all your Telemetry Data with CloudFabrix Robotic Observability Pipelines

CloudFabrix, the Robotic Data Automation Fabric inventor, announced “Data Observability Pipelines” for dynamic Data Ingestion and automation for any data source and destination. The solution acts as a data management and integration service that uses robotic processes to automate data tasks, such as data integration, data ingestion, cleansing, transformation, and enrichment. Automated data management saves time, improves data quality, and streamlines data workflows.
Sponsored Post

Monitoring Teams & Zoom on macOS Devices

When it comes to macOS, monitoring the digital experience comes with many challenges. When considering these challenges in relation to monitoring such business-critical UCaaS applications like Zoom, Teams or Cisco Webex, the challenges multiply - especially if relying solely on built-in macOS tools.

JS Toolbox 2024: Bundlers and Test Frameworks

JavaScript is bigger than ever, and the ecosystem is nothing short of overwhelming. In this JS toolbox 2024 series, we’ve selected and analyzed the most noteworthy JS tools, so that you don’t have to. In part 1 of this series, we explored the foundations of any JavaScript project: Runtime environments and package management. In part 2, we focused on JavaScript frameworks and static site generators.

Latest Top 13 Distributed Tracing Tools [perfect for microservices]

Modern digital organizations have rapidly adopted microservices-based architecture for their applications. Distributed tracing tools help monitor microservices-based applications. Choosing the right distributed tracing tool is critical. How do you know which is the right one for you? In this post, we will cover the top 13 distributed tracing tools in 2024 that can solve your monitoring and observability needs.

A Practical Guide to Logging in Microservices [Includes Best Practices]

Microservices logging is the practice of tracking and recording the activities of specific services in a distributed microservices architecture. Logging is an important aspect of any software system, and it is more critical for a microservices architecture as there are many small, independent services interacting with each other.

The Cybersecurity Threat Landscape in 2024

Over the last few years, the number and severity of cyberattacks against organizations have significantly increased. These attacks come in various forms, including ransomware, distributed denial-of-service (DDoS), data breaches, insider threats and many more. Despite the best efforts of many cybersecurity professionals to minimize these threats, it appears there will be no decrease in the threat level in 2024.

Let's Put on a Show With Cribl's Search Sandbox!

Remember when you were a kid and your school put on a production of the latest grade school drama? Maybe you didn’t get the lead role, but it was fun to put on (or watch) the show. Search Sandboxes are just like that! Except you get to be the stage manager when searching data. And Search Sandboxes offer you everything you need to make it an all-star performance.

Exploring Winglang with OpenTelemetry

Late last year, during an engaging Twitch livestream by AWS Developer Advocate Darko Mesaroš, I was introduced to a new framework Id seen a few people talking about called Winglang. What really got my attention was this wasn’t just another entry in the list of cloud frameworks, Winglang was on a mission to redefine how we interact with cloud environments. Its ambition to serve as an expansive framework that could effortlessly connect different cloud platforms instantly caught my attention.

An Ultimate Guide on Biztalk to Azure Migration

For many years, BizTalk Server has been a popular Microsoft platform for streamlining business transactions by integrating backend systems. Microsoft BizTalk Server is flexible, scalable, and very customizable. Hence, for many organizations, it was a logical choice to use the product to integrate their internal systems, and by using cloud adapters, the product can even connect with branch offices and/or partners in different geographical locations.

Navigating Cookies at Sentry: A Legal Perspective

You may have noticed that the banners asking you to accept “cookies” whenever you visit a website have gotten bigger and more annoying over time, especially if you browse the internet in Europe. This is in response to laws and regulations that are meant to protect users from being tracked unless they agree to be tracked. The requirement in Europe is that if you want to use cookies, subject to a few narrow exceptions, the purposes must be disclosed with granularity and agreed to in detail.

16,000+ Github stars, New Design Theme & Front Page of HN - SigNal 33

Welcome to the first SigNal of 2024! It is a year that we’re looking forward to accomplishing great things. We recently crossed 16,000+ GitHub stars as we continue to be amazed by the support of the developer community in our mission of open-source observability. Let’s see what humans of SigNoz were up to in January 2024.

Speed Root Cause Analysis and Troubleshoot Fast with Network Monitoring

The vast majority of IT infrastructure problems relate to the network. Afterall, most of IT infrastructure IS the network. Makes sense. But its immensity and complexity make the network a bear to troubleshoot and root cause analysis as tricky as finding the proverbial needle in the network haystack.

Avoid Stubbing Your Toe on Telemetry Changes

When you have questions about your software, telemetry data is there for you. Over time, you make friends with your data, learning what queries take you right to the error you want to see, and what graphs reassure you that your software is serving users well. You build up alerts based on those errors. You set business goals as SLOs around those graphs.

The Future of AIOps: Top 10 Predictions for 2024

In the current competitive landscape, organizations are constantly pressured to increase efficiency, flexibility, and scale in response to market demands. Artificial Intelligence for IT operations (AIOps) is emerging as a pivotal technology to help companies meet these imperatives and secure a competitive edge.

Micro Lesson: A Log's Journey

Meet Rick Jury, Senior Technical Account Manager at Sumo Logic. In this video, Rick talks about the ingestion pipeline and the journey that a log message takes from collection into the Sumo platform, and considerations for administrators around the ingestion pipeline. You will be excited to see how this translates into a search, turning a raw event into a schema and then into actual insights.

Visualize Sumo Logic metrics and logs with Grafana: Introducing the Sumo Logic Enterprise plugin

We are thrilled to announce the addition of a powerful new Enterprise plugin in the Grafana ecosystem: the Sumo Logic Enterprise data source plugin for Grafana. You can now easily connect Sumo Logic to your Grafana instance and correlate your log data with telemetry from all your data sources in one unified Grafana dashboard.

Azure Cosmos DB Pricing (2024)

Azure Cosmos DB, a global, multi-model database by Microsoft Azure, ensures globally responsive and scalable applications with low-latency, high-throughput data access. With support for diverse data models, global distribution, flexible consistency models, automatic scaling, and comprehensive SLAs, it’s crucial for modern applications requiring agility, security, and compliance.

Delivering Value with a Flat Budget

Join us for an important conversation with Cribl's Ed Bailey and Jackie McGuire, as we navigate the intricate balance of maximizing organizational value with a constrained budget. In today's challenging economic climate, where maintaining operations often means minimal to no additional spending, adaptive strategies become crucial. This is more than just a best-case scenario; it's a necessary approach for business resilience. Ed and Jackie will share innovative ideas and strategies to help leaders skillfully manage tight budgets while delivering significant value to their organizations.

Dashboard Studio Feature Highlights in Splunk Enterprise 9.2

With every major Splunk Enterprise release, we level up your dashboarding experience so that you can visualize and take action on your data fast. In Splunk Enterprise 9.2, we are bringing the experience across Classic (SimpleXML) dashboards and Dashboard Studio closer together and weaving in Dashboard Studio features from the two most recent Splunk Cloud Platform releases. This blog post covers the major dashboarding features included in Splunk Enterprise 9.2.

Monitoring as Code: Everything you Need to Know

Everywhere businesses are growing and adapting new technologies to stand out from their competitors. In fact, 91% of companies are working on a digital initiative as per a report by Gartner. It has also been concluded that 89% of all businesses either already have a digital-first business strategy in place or intend to implement one. With everything on the cloud and complex form, detecting issues can be quite challenging.

Mastering Firewall Logs - Part 2

As a pivotal element within your networking configuration, logs generated by Network Firewalls hold immense importance from both security and compliance standpoints. These logs serve as a source of valuable information, encompassing records of network traffic details like source and destination IP addresses, ports, protocols, timestamps, and the actions (e.g., allowed or denied) taken by the firewall for each connection or packet.