Operations | Monitoring | ITSM | DevOps | Cloud

March 2024

20 Best Cloud Monitoring Tools to Optimize Performance & Revenue

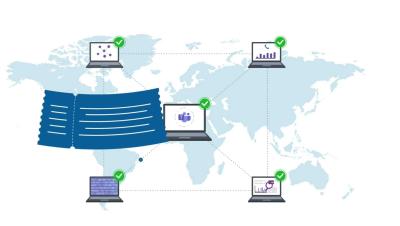
As of 2023, 89% of companies rely on a multi-cloud approach. Operating in the cloud is no longer a plus but a competitive necessity. Migrating from a fully on-prem to a hybrid or fully cloud environment isn’t exactly easy though, especially given the impenetrability of cloud data. Cloud monitoring enables your company to be proactive about its cloud services, ensuring that availability, security, performance, and other aspects are all up to par before reaching the end-user.

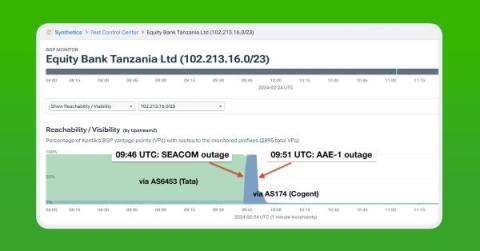
What Caused the Red Sea Submarine Cable Cuts?

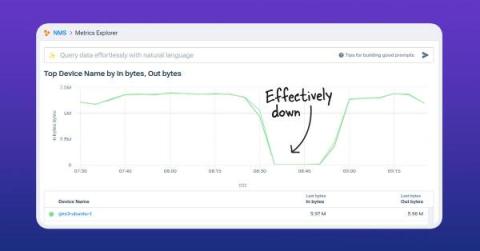
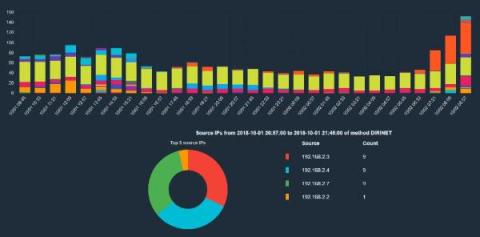
In the latest collision between geopolitics and the physical Internet, three major submarine cables in the Red Sea were cut last month likely as a result of attacks by Houthi militants in Yemen on passing merchant vessels. In this post, we review the situation and delve into some of the observable impacts of the subsea cable cuts.

Open source log management tools in 2024

Log management tools provide visibility into the performance and behavior of systems, applications, networks, and infrastructure components. By collecting and analyzing logs, you can monitor for anomalies, track trends, and identify potential issues before they escalate. Choosing the right log management solution requires careful consideration of several factors to ensure that it meets your specific needs and goals. Here are the most popular open source log management tools to help you choose.

If You Are an API and You Know It..

The API economy is taking over the world of data exchange. They are everywhere, from tech companies to grocery chains. With massive growth, security, and observability are a concern since creating the right telemetry is often an afterthought, and companies do not understand the scope of the issue till they are breached or have performance issues.

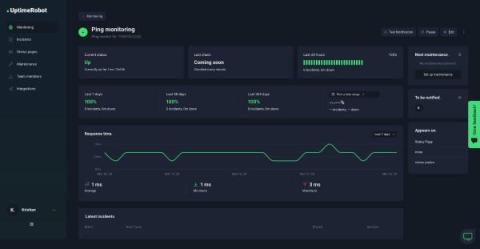
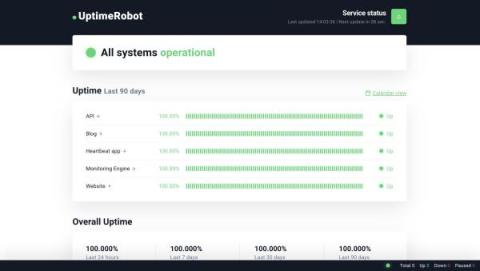
16 Best Uptime.com Alternatives For Uptime Monitoring in 2024

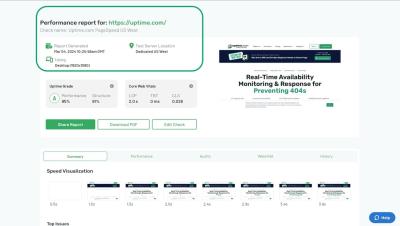
Monitoring website uptime is critical for ensuring it stays accessible and runs effectively. While Uptime.com has been recognized for these services, the evolving digital landscape necessitates exploring other tools that offer enhanced uptime monitoring features. This introduction explores top alternatives to Uptime.com, aimed at guiding users toward a solution that best matches their needs.

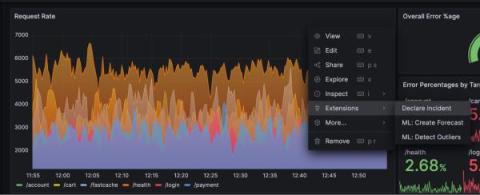
A better Grafana OnCall: Seamless workflows with the rest of Grafana Cloud

Incident response and management (IRM) doesn’t happen in a vacuum. Your ability to respond to issues in a timely manner depends greatly on how well your on-call engineers can use their IRM tooling and observability tools together to understand what changed and why.

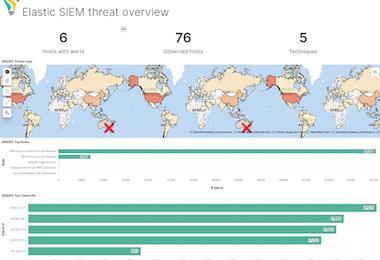
Preparing for the Elastic Certified Observability Engineer Exam - Get Elasticsearch Certified

The Elastic Certified Observability Engineer exam tests your knowledge and skills on using the Elastic Stack to implement observability, from ingesting metrics, logs, APM and uptime data to a single data source, to analyzing and reacting to events using Kibana, machine learning, and alerting.

How to Manage Sensitive Log Data

According to Statistia, the total number of data breaches reached an all-time high of 3,205 in 2023, affecting more than 350 million individuals worldwide. These breaches primarily occurred in the Healthcare, Financial Services, Manufacturing, Professional Services, and Technology sectors. The mishandling of sensitive log data provides an on-ramp to many of the most common attack vectors.

NiCE Customer Quotes

In the contemporary business landscape, the need for efficient IT infrastructure monitoring is paramount to ensure smooth operations and maintain competitiveness. NiCE specializes in Management Packs tailored for Microsoft SCOM, offering comprehensive performance insights and scalability. Our customers consistently report benefits such as improved monitoring, seamless integration with SCOM, and proactive issue resolution.
Tracking Custom Metrics in Python with AppSignal

We have improved our custom metrics offering with two recent Python releases. In release 1.1.1 of our Python package, we added the add_distribution_value helper, and in version 1.2.0, we added support for minutely probes, so you can measure the distribution of key data points in your Python application. In this blog post, we'll show you how to set up custom metrics in your Python application to gain valuable insights without sifting through logs or querying databases.

Frontend Debugging Is Bad and it Should Feel Bad

There’s a sentence that strikes fear into the heart of every frontend developer I've ever met: Users are reporting issues, and we don't know how to replicate them. What do you do when that happens? Do you cry? Do you mark the issue as wontfix and move on? Personally, I took the road less traveled: gave up frontend engineering and moved into product management (this is not actually accurate but it's a good joke and it feels truthy).

How an All-in-One AI Advisor Enables IT Teams to Stay Ahead of the Curve

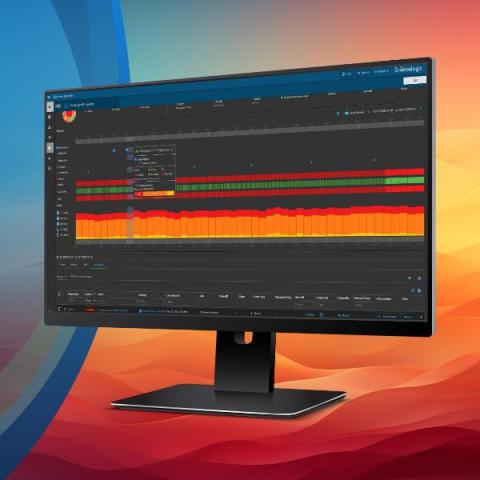
Ever since generative AI burst into public consciousness, business executives and IT leaders have been intrigued by the potential of generative AI to transform IT. As it turns out, generative AI has already begun revolutionizing ITOps and we are excited to be at the forefront of this game-changing technology through the ScienceLogic SL1 Hollywood release.

What Dynatrace doesn't want you to know about Cisco Full-stack Observability and AppDynamics

Cisco Full-Stack Observability is a strategic investment that outshines Dynatrace by incorporating AI-driven insights, full-stack visibility, and a future-proof design that adapts to your evolving business needs. Application experience is the heart of your digital business, so choosing the right observability platform is not just a technical decision — it’s strategic.

The five most common HTTP errors according to Google

Have you ever wondered what goes behind those annoying 'Oops, something went wrong' messages on the web? You're not alone. A simple Google search for the most common HTTP errors throws up names we've all seen at least once: Not Found, Unauthorized, Forbidden, Internal Server Error, and Bad Request. It's like a secret code that both frustrates and fascinates.

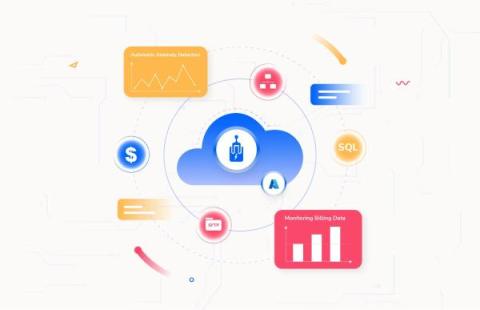
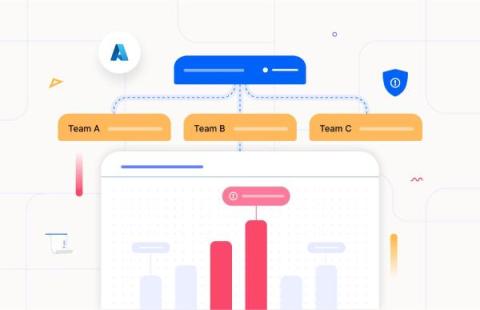
Optimize Azure spending with Turbo360's periodic notifications

Is your Azure spend management getting out of control? You’re not alone. Countless businesses struggle with the exact problem, often lacking clarity on the reasons behind the cost spike. Especially within larger organizations, where multiple teams deploy Azure resources, the Azure costs can quickly get out of control without the necessary tools to effectively track the spending and evaluate monthly Azure spend against their business needs.
What you're currently missing from your CDN monitoring tool

Content Delivery Networks (CDN) have been an inherent part of modern software infrastructure for years. They allow for faster and more reliable web-content delivery to users regardless of their location and an additional level of protection against DDoS Attacks and server failure. But just like any infrastructure service, they still fail from time to time and have their quirks. Enter CDN monitoring tools, providing insights on the performance of your CDN and helping troubleshoot issues.

Three Ways to Assure Network Quality

What is the quality of your network? More to the point, what is the quality of the network experience? Do your employees think that your network is slow? Merely adequate? Speedy? At the highest level, this is what network operations teams need to understand how to answer. And this needs to be answered no matter how complicated the network path is between endpoints. We’ll take a look at three things that can help you get a handle on these questions.

One Reason Why Your Nodes' Memory Usage Is Running High

When you’re using Cribl Stream and Cribl Edge to send data to hundreds of Splunk indexers using Load Balancing-enabed Destinations, it is sometimes necessary to analyze memory usage. In this blog post, we delve into buffer management, memory usage calculations, and mitigation strategies to help you optimize your configuration and avoid memory issues.

Observability Unpacked: 5 Takeaways From KubeCon + CloudNativeCon 2024

StackState had a blast at this year's KubeCon + CloudNativeCon gathering in Paris! The discussions were in-depth, covering a wide array of topics and lasting much longer than in the past. This year, attendees seemed to have a considerably deeper understanding of the cloud-native ecosystem, probably attributed to its rapid growth. We also noticed a pretty dramatic evolutionary shift in the vendors at the expo hall, who were showcasing some truly progressive specialized solutions.

Call me, maybe: designing an incident response process

Hey, I just deployed — and this is crazy. But the server’s down, so call me, maybe? Making your services available at all times is the gold standard of modern software operations. The easiest way to reach this would be to just write bug-free software, but even if you reach this completely unattainable goal — stuff happens! Modern software rarely exists in a vacuum and often depends on a multitude of external services and libraries.

How to Configure a Histogram Visualization | Grafana

💡 Do you want to know how and when to use histogram visualizations? Join Senior Developer Advocate Marie Cruz in this beginner-friendly tutorial to learn how to configure a histogram visualization in Grafana. ☁️ Grafana Cloud is the easiest way to get started with Grafana dashboards, metrics, logs, and traces. Our forever-free tier includes access to 10k metrics, 50GB logs, 50GB traces and more.

Charting New Territory: OpenTelemetry Embraces Profiling

The topic of continuous profiling has been an ongoing discussion in the observability world for some time. I said back in 2021 that profiling was set to be the next major telemetry signal in observability, and in fact, since then there’s been growing interest in profiles. Startups and large observability vendors have gotten into this domain. A significant recent step was when the OpenTelemetry project decided to add profiles to its core signals and formalized the open unified specification for that.

Sending PHP Single-Page Application Logs to Loggly

In this post, we’ll embark on the journey of building a simple PHP single-page application that interacts with a MySQL database. We’ll integrate logging functionality on top of our application. Logging is a crucial aspect of any application—for providing insights into user behavior, tracking errors, and monitoring performance. We’ll start by walking through how to set up our application.

Monitor Supabase databases and Edge Functions

When cloud service providers first started popping up, many developers were “wowed” by being able to spin up and scale all kinds of infrastructure to deploy their web applications on demand. However, big-box cloud service providers are often complex to use, scaling out is expensive and default monitoring solutions are not very insightful. Besides, we are spoiled developers, and we expect things to be easy.

Digital experience monitoring in Applications Manager

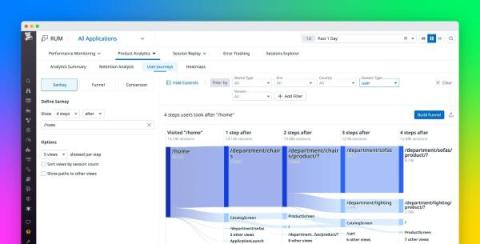
Digital experience monitoring (DEM) involves tracking the entire digital user journey of your applications, websites, APIs, and other digital services. It focuses on tracking the performance of your web application from the end user’s perspective, offering in-depth insights on user experience, app performance, and customer satisfaction.

Leveraging LLM/Gen-AI for Accelerating Left-Shift Operations Transformation

In today’s digital landscape, delivering a flawless customer experience is the ultimate competitive advantage. However, traditional methods of ensuring service resilience during operation can often be both expensive and cumbersome to maintain. This is where left-shift operations come into play—a powerful strategy aimed at instilling quality and resiliency in the early stages of building and delivering high-quality products and services..

The Complete Guide to AIOps

AIOps, which stands for Artificial Intelligence for IT Operations, is here to stay. The truth is that leveraging artificial intelligence (AI) for ITOps offers a range of benefits that can significantly improve the efficiency, reliability, and performance of IT operations. So keep on reading as we explore AIOps software potential. From automating routine tasks to predicting future issues and enhancing decision-making, as well as practical scenarios as strategies for its implementation.

Comparing Performance and Resource Usage: Grafana Agent vs. Prometheus Agent Mode vs. VictoriaMetrics vmagent

Monitoring and observability are critical components of modern IT infrastructures, enabling organizations to gain insights into the performance, health, and security of their systems. Agents play a crucial role in gathering and forwarding telemetry from various sources to observability platforms.

Track Errors in FastAPI for Python with AppSignal

When you first try a new library or framework, you are excited about it. However, as soon as you run something on production, things are less than ideal — an error here, an exception there - bugs everywhere! You start reading your logs, but you often lack context, like how often an error happens, in what line, etc. Fortunately, tools such as AppSignal can help. AppSignal helps you track your errors and gives you a lot of valuable insights.

AI Explainer: Feature Extraction

In a previous blog post, which was a glossary of terms related to artificial intelligence, I included this brief definition of "feature extraction": Let’s go a bit deeper on that. In the ever-expanding landscape of machine learning, feature extraction stands out as a crucial technique for enhancing the performance of models and uncovering valuable insights from complex datasets.

What are the benefits of an observability solution from Splunk?

Organisations get a full-stack, end-to-end view of what is happening in a complex application environment. With Splunk Observability they can correlate logs, traces and metrics. They get a complete view of their application services, and can proactively see if something is going to happen and quickly detect the issue when a problem occurs.

New Features to Meet Upcoming Ecommerce Security Regulations

RapidSpike recently launched the first of six new features designed to further boost the security of ecommerce websites, in readiness for PCI DSS 4.0. We recently featured in Prolific North. If you missed the write up, you can catch up in full, here… In response to rising ecommerce threats, the Payment Card Industry Data Security Standards will impose 63 new requirements on brands processing, storing or transmitting credit card information, with version 4.0 coming into effect on March 31, 2025.
Turbo360 and Contica AB Join Forces to Revolutionize Azure Management in Sweden

We’re excited to share some thrilling news with our community! Turbo360 has forged a powerful partnership with Contica AB, a leading integration specialist team in Sweden operating on the Microsoft platform since 2010. Comprising a cadre of specialists ranging from security experts to system architects, developers, project managers, integrators, and testers, Contica AB is committed to delivering tangible value through their expertise.

What is a domain name? How do domain names work?

A domain name is a unique address used to access a website, like google.com or wikipedia.org. It's a string of text that maps to an IP address, which is the numerical label assigned to each device connected to the internet. Domain names are used to identify one or more IP addresses, making it easier for people to remember and access websites without memorizing complex numbers.

How I fixed my brutal TTFB

Recently, I improved all my homepage Core Web Vitals by focusing on improving just one metric: the Time to First Byte (TTFB). All it took was two small changes to how data is fetched to reduce the p75 TTFB from 3.46s to just 704ms. In this post I’ll explain how I found the issues, what I did to fix them, and the important decisions I made along the way. (And don’t worry, I’ll break down “p75” and “TTFB”, too!)

Considerations for Active Monitoring from an SD-WAN Site

As companies adopt SD-WAN technologies, they increasingly rely on network services outside their control. The new reality is that network operations need end-to-end visibility on the network performance whether or not they own the infrastructure. In a 2023 EMA survey, 63% of companies report using the Internet as their primary WAN connectivity.

Completing the Kubernetes Monitoring Puzzle

Kubernetes has changed the way many organizations approach the deployment of their applications. But despite its benefits, the additional layers of abstraction and reams of data can cause complexity around Kubernetes monitoring. We’ve seen so much of these challenges borne out in the results of the 2024 Observability Pulse survey. In the survey report, 36% of respondents say Kubernetes poses a challenge, and just 10% of organizations say they have full observability into their environments.

Microsoft SLA for Teams Telephony - 99.999% Uptime Guarantee

This week at Enterprise Connect, Microsoft announced many compelling new Teams features to drive productivity, collaboration and to simplify the lives of its users. One of the most noteworthy announcements is that Microsoft is now delivering a 99.999% Microsoft Teams SLA uptime guarantee for Teams telephony. This covers uptime for calls that take place over the PSTN, including Microsoft Teams Phone, Teams Calling Plans and Audio Conferencing.

Avoid flaky end-to-end tests due to poorly hydrated Frontends with Playwright's toPass()

In this video we'll dive into the world of flaky tests in Playwright and synthetic monitoring with Checkly. We examine a site with poor Frontend hydration patterns, their effect on test stability, and how to work around them. Learn how to avoid using artificial delays and implementing a retry mechanism with Playwright's 'toPass()' method to achieve stable testing instead.

How to automate image analysis with the ChatGPT vision API and Grafana Cloud Metrics

OpenAI’s ChatGPT has an extraordinary ability to process natural language, reason about a user’s prompts, and generate human-like conversation in response. However, as the saying goes, “a picture is worth a thousand words” — and perhaps an even more significant achievement is ChatGPT’s ability to understand and answer questions about images.

Transforming Human Interaction with Data Using Large Language Models and Generative AI

AI has been on a decades-long journey to revolutionize technology by emulating human intelligence in computers. Recently, AI has extended its influence to areas of practical use with Natural Language Processing and Large Language Models. Today, LLMs enable a natural, simplified, and enhanced way for people to interact with data, the lifeblood of our modern world. In this extensive post, learn the history of LLMs, how they operate, and how they facilitate interaction with information.

Best practices for monitoring software testing in CI/CD

A key challenge of monitoring your CI/CD system is understanding how to optimize your workflows and create best practices that help you minimize pipeline slowdowns and better respond to CI issues. In addition to monitoring CI pipelines and their underlying infrastructure, your organization also needs to cultivate effective relationships between platform and development teams.

Anodot Cloud Cost Update: Forecasting CostGPT and AWS Recommendations

Our Cloud Cost platform just got some practical upgrades to help you manage cloud costs better and boost your operational efficiency. Curious about the new features? Let’s jump right in! Forecast in ChatGPT Interacting with cloud cost data just got easier and smarter. Ask any cost-related question using natural language, and let CostGPT do the rest. It instantly delivers insightful visualizations and forecasts of your cloud costs.

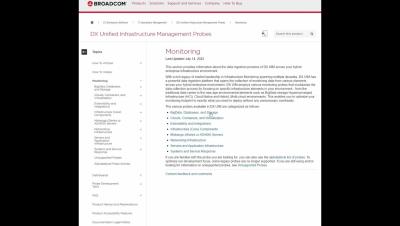
As Technologies Continue to Evolve, How Do You Know What DX UIM Monitors?

DX UIM is designed to add monitoring for new technologies as IT operators adopt cutting-edge devices and services to improve their competitiveness, develop new services for their end users or customers, or increase cost efficiency. DX UIM currently supports monitoring and metric collection for more than 140 different technologies. Its architecture easily allows new technologies to be added to the list. How do you know if your technologies are covered? It’s Easy: In this 3-Minute Video Our DX UIM expert explains how to navigate to the Tech Docs section on our Support website.

Stream Amazon CloudWatch Logs to Splunk Using AWS Lambda

Amazon CloudWatch Logs enables you to centralize the logs from different AWS services, logs from your applications running in AWS and on-prem servers, using a single highly scalable service. You can then easily view these logs data, search them for specific error codes or patterns, filter them based on specific fields, or archive them securely for future analysis.

Manage Netdata Cloud with Terraform

We proudly announce the release of the Netdata Cloud Terraform Provider. It’s a step forward to make our platform more automated and compliant with the modern Infrastructure as Code approach. Terraform is one of the leaders in the IaC tools with a rich ecosystem of providers and modules, now you can put a puzzle with Netdata Cloud to your stack.

Leveraging UC Monitoring for Unified Communications Apps (MS Teams, Zoom, Google Meet)

With insights from Grand View Research revealing that the global Unified Communications (UC) market surged to an estimated value of $136 billion in 2023, it's obvious that UC has become a cornerstone of modern business communication. Over half a million businesses worldwide have embraced UC technology, harnessing its capabilities to streamline communication channels and elevate organizational success.

The Impact of AI on Cybersecurity

Explore the fusion of Artificial Intelligence (AI) and cybersecurity, unlocking the secrets behind AI’s transformative influence in digital asset protection, during our exclusive webinar, “Enhance Your Cybersecurity by Harnessing the Power of AI.” Our product expert will discuss the wide-reaching impact of AI and teach attendees how to navigate dynamic cybersecurity trends and the ever-evolving threat landscape.

Time Series, InfluxDB, and Vector Databases

Integrating time series data with the power of vector databases opens up a new frontier for analytics and machine learning applications. Time series data, characterized by its sequential order and timestamps, is pivotal in monitoring and forecasting across various domains, from financial markets to IoT devices. InfluxDB, a leading time series database, excels in handling such data with high efficiency and scalability.

Strategies for Ensuring Compliance in Financial Messaging

In the ever-evolving landscape of financial services, institutions are under constant pressure to ensure their messaging infrastructures comply with a myriad of global regulatory requirements. Compliance with regulations such as the General Data Protection Regulation (GDPR), the Payment Services Directive 2 (PSD2), and other localized financial regulations is not just a legal necessity but a cornerstone for maintaining trust and integrity in the financial sector.

Boosting Application Security Using OpenTelemetry

Every day, we hear about new vulnerabilities or exploits that underline the importance of application security in today’s connected world. Such incidents put sensitive user information at risk and threaten applications’ infrastructure. Securing applications is therefore crucial not only from a technical standpoint but also to maintain user trust and ensure service reliability. The challenge lies in identifying and mitigating potential security threats before they can be exploited.

12 best practices for DevOps and IT teams to handle monitoring alerts

"Music is noise that makes sense," said author Yann Martel, implying that if a sound doesn't make sense, then it is perceived as just noise. Noise can thus be defined as any alert that affects our senses and disturbs our peace without adding any value. The digital age drowns us in stimuli of all kinds all the time, making the struggle to ignore noise in order to filter for sense harder than ever.

DNS Redirect - Redirect Domain To URL Using DNS Records

Domain redirection plays a crucial role in managing website transitions, consolidating content, and maintaining a seamless user experience. This article explores the various aspects of domain redirection, including the different types of redirects, DNS redirection, and best practices for preserving SEO value during the process.

Traceroute InSession: A traceroute tool for modern networks

This is a follow-up to our previously published post announcing Traceroute InSession, where we provided extensive technical details about how it works. In this series, we explore the challenges InSession addresses within modern networks and compare it to other traceroute variants. At Catchpoint, we pride ourselves on being traceroute experts. Why? We’ve run over 15 billion traceroutes over the last 15 years and more than 3 billion in 2023 alone!

What is Log Analytics?

There is observation then there’s analysis. Log Analytics falls under the latter category. Observation and analysis are not mutually exclusive; one builds upon the other. Similarly, Log analytics advances beyond simple log monitoring, enabling observability teams to identify trends and irregularities throughout your enterprise. To demystify what is Log Analytics, let’s first have a look at the definition.

Steps to Taming Hybrid Cloud Complexity: Eliminating Visibility Gaps & Enabling Actionable AI-Powered Insights

For years “the move to the cloud” implied a singular event – a singular migration to a singular entity. It all sounded so simple. Yet, the “simple” act of moving to the cloud stands in stark contrast to the reality of today’s complex, hybrid IT estates where the overwhelming volume of data flows can make it challenging for IT teams to effectively pinpoint and rectify service incidents.

Improving INP and FID with production profiling

On March 12 Google began promoting INP (Interaction to Next Paint) into a Core Web Vital metric in an effort to push performance beyond page loads. This means your website or application’s SEO ranking may be impacted if users do not have smooth interactions on the site or app. While this change is a net positive for users, finding the root cause of these reported slow interactions can be tricky for developers.

Fine-tune observability configurations for all your Azure integrations in one place

Microsoft Azure provides an array of managed services to support many aspects of cloud computing, including application development, workload migration, and data management. To help you monitor the health and performance of these services, Datadog offers integrations with more than 40 Azure services, including Azure Kubernetes Service (AKS), Cosmos DB, and Azure App Services. Each integration provides robust data visualizations, meaningful alerts, and one-click Datadog Agent deployment.

Why Splunk for observability?

How can Splunk bring ITOps- and engineering teams together so that they can deliver exceptional customer experiences? Splunk Observability can help enterprises and organisations solve problems within seconds. It's the only full-stack, analytics-powered and OpenTelemetry-native observability solution. Hear Robbie Baines, Observability Advisor at Splunk tell us more in this video.

Why is Splunk growing rapidly within the observability market?

As organisations are making the move from on-prem to cloud solutions built on microservices architecture, their monitoring has become more complex. To get a more holistic view of their application services a comprehensive observability solution is needed. Splunk Observability strengthens digital resilience by preventing unplanned downtime.

CI/CD observability: Extracting DORA metrics from a CD pipeline

Last November, Dimitris and Giordano Ricci wrote a blog post about CI/CD observability that looked into ways to extract traces and metrics in order to get a better understanding of possible issues inside a CI/CD system. That post focused on getting data from a continuous integration (CI) system, and it really resonated with the community.

What is alert fatigue and its effect on IT monitoring?

Talking about too many cybersecurity alerts is not talking about the story of Peter and the Wolf and how people end up ignoring false warnings, but about its great impact on security strategies and, above all, on the stress it causes to IT teams, which we know are increasingly reduced and must fulfill multiple tasks in their day to day.

Splunk second thoughts? It's time for the cloud-native alternative

Back in September when Cisco announced they were acquiring Splunk, we explained how the market was consolidating with Sumo Logic ahead of the pack, challenging traditional vendors with our cloud-native platform. Now that the deal is complete and Splunk is officially a Cisco company, we’re hearing from more Splunk customers who are considering their options.

Using eBPF to Debug eBPF

In one of our latest posts, StackState Co-Founder Mark Bakker described how eBPF revolutionizes observability and how StackState’s agents rely heavily on eBPF to capture and analyze the data moving through your cluster. Today, we’re looking at an example where our eBPF code failed and — by diving deep into the intricacies of eBPF implementation in the Linux kernel — share the tale of how we fixed it using even more eBPF.

Why you should monitor microservice mediator APIs

Microservice mediator APIs provide a flexible, scalable, and decentralized approach to microservices communication, enabling organizations to build robust, modular, and maintainable applications. They shield microservices from the details of the other implementations and promote loose coupling, helping to ensure autonomy, scalability, and independence among microservices.

Discovering the 24 Best Comprehensive Network Visibility Tools

In today's world, networks are crucial for businesses to communicate and share data smoothly. But keeping networks running well and staying ahead of performance issues can be tricky. That's where network visibility tools come in handy. These tools give a complete view of a network, helping IT pros see everything that's happening and fix any issues quickly.

Advantages of an AI-Powered Observability Pipeline

The expenses associated with collecting, storing, indexing, and analyzing data have become a considerable challenge for organizations. This data is growing as fast as 35% a year, multiplying the problems. This surge in data comes with a corresponding rise in infrastructure costs. These costs often force organizations to make decisions about what data they can afford to analyze, which tools they must use, and how and where to store data for long-term retention.

Network Technician Guide: Key Roles, Tools, and Career Growth

In the ever-evolving landscape of the digital era, the backbone of our interconnected world is woven together by an intricate web of networks. Behind the scenes, ensuring the seamless operation of these networks are the unsung heroes known as network technicians. These skilled professionals wield their network toolkits to maintain, troubleshoot, and optimize the complex systems that keep our data flowing and communications thriving.

Continual Learning in AI: How It Works & Why AI Needs It

Like humans, machines need to continually learn from non-stationary information streams. While this is a natural skill for humans, it’s challenging for neural networks-based AI machines. One inherent problem in artificial neural networks is the phenomenon of catastrophic forgetting. Deep learning researchers are working extensively to solve this problem in their pursuit of AI agents that can continually learn like humans.

How to Implement Cookie Consent Management (Consent Mode v2) for Free

If your website is visited by users from the European Economic Area or the United Kingdom, you must obtain their consent not only to collect their data but also to store cookies in their browsers. Consent applies not only to cookies used by your site but also to third-party cookies – such as Google Analytics.

How to allow non owner (users) to create Rollbar projects

Discover, predict, and resolve errors in real-time. Go beyond crash reporting, error tracking, logging and error monitoring. Get instant and accurate alerts — plus a real-time feed — of all errors, including unhandled exceptions. Our automation-grade grouping uses machine learning to reduce noise and gives you error signals you can trust.
Sponsored Post

Considering SAP RISE? Consider this!

RISE is one of the hottest topics around SAP. It's almost difficult to read or discuss SAP without the topic present. But with any topic as complex as SAP, the question of where to run SAP and ultimately RISE as an option isn't without opportunity for questions. This blog tries to clear up some of the most common questions, especially for companies considering RISE coming from an existing expertise of either operating SAP themselves or having experience with SaaS solutions and cloud services.

Implementing Azure Cost Circuit Breakers for Budget Protection

Recently when recording an episode of the FinOps on Azure podcast with Rik Hepworth which will be out soon we discussed a scenario where we have a cost issue because something went wrong with an Azure solution. In this article we will explore that problem and how you can implement some protection for it.

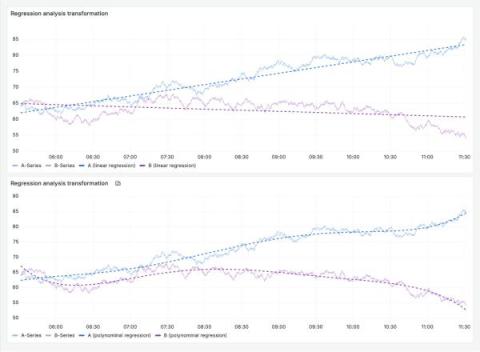
How to surface trends and make sense of your data with Grafana

There is a Polish proverb: “Co za dużo to niezdrowo,” which more or less translates to “Enough is as good as a feast.” (Or, translated verbatim: “Too much of something can be unhealthy.”) Sometimes this is true for data as well. At Grafana Labs, we’re always introducing products and features that help you make sense of that abundance of data, either by efficient visualizations, adaptive observability, or apps dedicated to specific workflows and use cases.

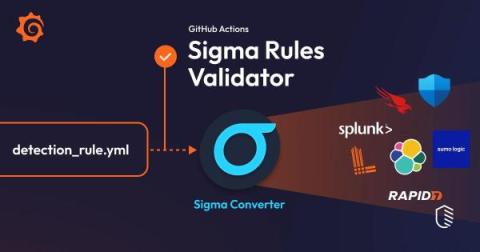
How to validate Sigma rules with GitHub Actions for improved security monitoring

Monitoring your identity provider’s logs is critical to identify potential security threats. These logs are vital for a security team, who may store them in a specialized tool like Grafana Loki for enhanced accessibility and analysis. The ability to pinpoint specific patterns within these logs is key — and by crafting these patterns into Loki queries, you can conduct focused searches across logs.

Deploy Site24x7's monitoring agent on multiple servers (over 20k) using Active Directory

Enterprises employ tens of thousands of servers for their IT infrastructure. An ideal server monitoring tool should be cross-platform adaptable and require minimal manual intervention during setup. Utilize the instructions in this post to monitor all of your servers from just one interface in Site24x7.

Low effort image optimization tips

“A picture is worth a thousand words”. So if a picture takes more than 4 seconds to load, does it mean that your website’s content fails to communicate a thousand words? In this blog post, we’ll learn how to identify unoptimized images, how to fix them, and how to validate the fix — so your website can speak volumes with highly-optimized images.

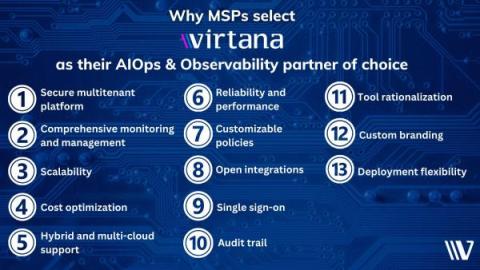
Why MSPs Are Choosing Virtana for AIOps and Observability

If you are an MSP, AIOps can be a game changer for your business. By leveraging AI-driven automation, analytics, and insights across your managed IT services portfolio, you can drive operational excellence, improve service quality, and deliver greater value to your clients. But there are many AIOps and observability tools in the market. Here are 13 reasons why many MSPs select Virtana as their AIOps and observability partner of choice.

Mastering Performance Optimization: A Deep Dive into Troubleshooting with Progress Flowmon

Description: Watch our webinar and learn more about troubleshooting performance issues with Progress Flowmon! We’ll showcase the powerful Flowmon Monitoring Center and delve into advanced analysis techniques for investigating performance issues reported by clients. Pavel Minarik, VP of Technology at Progress, will guide you through real-world scenarios, providing practical tips and strategies to streamline your troubleshooting process and maintain optimal network and application performance.

Swift: Transforming product instrumentation with Elastic Observability

As the leading global provider of secure financial transactions and payments, it's vital for SWIFT to stay relevant. With more than 45 million messages flowing through its systems every day and being at the heart of the financial industry, SWIFT is at the forefront of secure, frictionless financial services including sanctions screenings, compliance analytics, KYC (Know Your Customer) registry, and payment controls.

The Ultimate CPU Alert - Reloaded, Again!

It’s been nearly ten years since “The Ultimate CPU Alert – Reloaded” and its Linux version were shared with the SolarWinds community. At that time, managing CPU data from 11,000 nodes, with updates every five minutes to a central MSSQL database, was a significant challenge. The goal was to develop alerting logic to identify when a server was experiencing high CPU usage accurately.

Shedding Light on Network Visibility: Don't Wait for End Users to Report Issues

Imagine driving a car at night without headlights. It's risky, right? Without them, you can't see where you're going, and you might crash. Well, the same goes for visibility in enterprise networks. If you can't see how they're performing, you might run into problems with important apps, slow Internet, and unhappy customers. That's why having the right tools to see what's happening on your network is crucial. It's like turning on those headlights to make sure you're going in the right direction.

Perfmatters vs NitroPack - Which One Is Better?

Speeding up your website can feel like a complicated task. You might not understand all the technical terms you come across, like “leverage browser caching.” And if you are trying to fix everything yourself, it can take up a lot of time. Which I am sure you would not get into! So, you must be trying to decide between NitroPack and Perfmatters to speed up your WordPress website. As these are the two most commonly used plugins for speed optimization of WordPress sites.
Sponsored Post

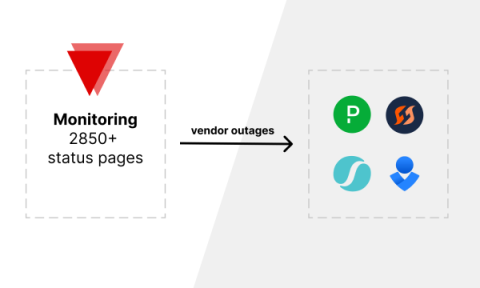
Streamline Vendor Outages to Incident Management Tools

Digital operations are now the backbone of almost every business. The ability to respond to and manage incidents is more critical than ever. Incident management tools like FireHydrant, Opsgenie, SquadCast, and PagerDuty have become essential in helping companies minimize downtime and maintain operational efficiency. However, when vendor outages occur, integrating these incidents seamlessly into your management tools can be a challenge. This is where IsDown steps in.

Mapping Precision: The Role of Land Parcel Insights in Agriculture

In today's changing world, technology plays a major role in transforming various industries. Agriculture is one sector that has greatly benefitted from progress. The introduction of specialized tools and techniques has provided farmers with insights and data that can revolutionize their farming methods. Among these tools, land parcel insights have emerged as a game changer in the sector.

A 7-Step Guide to IT Cost Reduction in 2024

As per the latest forecast by Gartner, worldwide IT spending is projected to amount to $4.6 trillion in 2023, up by 5.1% from 2022. The demand for IT will be strong in 2023 as enterprises launch digital business initiatives to respond to global economic challenges. In a downward economy, conventional wisdom warrants reducing costs.
Deep Dive - Time Series Panel Visualizations: What Are They? How to Get Started? | Grafana

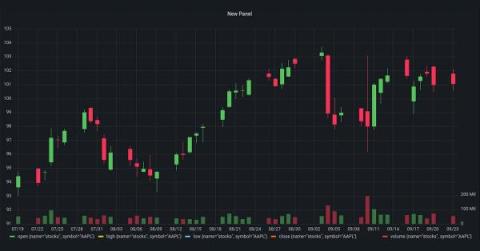
In this video, Grafana Developer Advocate Leandro Melendez describes Time series visualizations, the default and primary way to visualize time series data as a graph. They can render series as lines, points, or bars. They’re versatile enough to display almost any time-series data. — Found this video useful? Be sure to give it a thumbs up and subscribe to our channel for more helpful Grafana tutorial videos.

Elevating Data Sovereignty with Stackify Self-Hosted Retrace

Stackify’s commitment to serving a broad array of industries is evident from its varied customer portfolio. From BigBank and Big Pharma to Logistics Supplier and Retail Bank, the Self-Hosted Retrace has proven adaptable and essential across different sectors. This versatility not only demonstrates the solution's robustness but also its capacity to meet your industry-specific demands, affirming Stackify's role as a critical tool in the optimization of IT infrastructures globally.

Five improvements to Make Debugging Less Terrible

Over the past year, we released a couple of new offerings, like Session Replay and Cron Monitoring. But in addition to building new products, we’re constantly looking for ways to improve our core platform to help you debug software issues faster. As you hopefully saw during Sentry’s Launch Week, we shipped five quality-of-life improvements addressing the following problems: Here’s the latest.

Present-day IT Challenges Addressed by AIOps

The increasing rise of Artificial Intelligence for IT Operations (AIOps) in information technology (IT) is rapidly emerging as a transforming force that will redefine the operational paradigms. Essentially, AIOps fuses machine learning, big data analytics, and various IT tools to automate and improve IT Operation processes, including event correlation, anomaly detection, and event causality.

Major Improvements Coming for Linux Users

Linux®-based operating systems are becoming increasingly common among software developers. A whopping 45 percent were using Linux in 2022, according to Statista, which is not far behind Windows. Over the last months we have been focusing on improving the Tracealyzer experience for Linux users and the upcoming v4.9 release will bring major improvements.

How shipping/third-party logistics companies reduce MTTR and increase uptime with the Grafana LGTM Stack

These days, everything can be tracked: transportation, deliveries, food orders. . . For consumers, knowing the location of a package or courier is a bonus, but for companies in the business of shipping, delivering, and third-party logistics, it’s a necessity. And so is having the right observability system to ensure everything gets where it needs to go. After all, errors, downtime, or anything that causes delays will end up delivering unhappy customers and lost revenue.

Webinar Recap: Myths and Realities in Telemetry Data Handling

Telemetry data is growing exponentially, but the business value isn’t increasing at a similar pace. Getting the right telemetry data is hard, so I recently had a conversation with Matt Aslett, Director of Research at Ventana Research, now a part of ISG, about five myths and realities in telemetry data handling.

Best practices for end-to-end service ownership with Datadog Service Catalog

In order to grow your organization effectively, you need to ensure the scalability of your systems. In a broad, distributed architecture, critical processes like incident triage, security response, and large-scale configuration changes can be difficult to execute without a programmatically accessible registry of what’s running in production and who owns it.

Last Day of The Quarter - Smooth Sailing?

You’re 24 hours away from the next quarter. Have you achieved everything in this one that you wanted to? Got a last-minute deal you need to get over the line? That’s ok, your favorite customer is just a quick video call away from signing on the dotted line – that’ll help you hit your target. Be a real problem if the call kept dropping out though – especially if they asked to reschedule. Oh, no, suddenly, your Teams is acting up!

Turning Logs into Metrics with OpenTelemetry and BindPlane OP

Turning logs into metrics isn’t a new concept. A version of this functionality is implemented in most agents, visualization tools, and backends. It’s everywhere because converting logs to metrics has many practical applications and is one of the fundamental mechanisms for controlling log volume in a telemetry pipeline. In this post, I’ll briefly overview log-based metrics, explain why they matter, and provide examples of how to build them using OpenTelemetry and BindPlane OP.

Effective Monitoring and Alerting Strategies in DevOps

DevOps teams play a crucial role in ensuring the continuous delivery of software applications. One of the key pillars of DevOps success is implementing effective monitoring and alerting strategies. In this blog post, we will explore the importance of monitoring and alerting in DevOps, discuss best practices, and provide insights into building a robust monitoring ecosystem.

How to write and install a custom PowerShell plugin for Windows servers

This video will guide you through the process of writing and installing a custom PowerShell plugin for Windows servers. With Site24x7's Plugin Integrations, you can monitor applications, hosts, devices, services, protocols, and more. Write your own custom plugin script to monitor any application or service in your tech stack in a few simple steps. Related links: Install Site24x7 Windows Server monitoring agent: site24x7.com/help/admin/adding-a-monitor/windows-server-monitoring.html.
Sponsored Post

Cost Benefits of Azure Monitor SCOM Managed Instance

Microsoft has just released the latest news regarding the cost structures for Azure Monitor SCOM Managed Instance. In this recent publication by Aakash Basavaraj on the Microsoft Tech Community, valuable insights have been shared on the benefits and cost-effectiveness of transitioning from the traditional System Center Operations Manager (SCOM) to the cloud-based Azure Monitor SCOM Managed Instance (SCOM MI). This blog post provides a condensed overview, highlighting key considerations and showcasing potential cost savings of up to 44%.

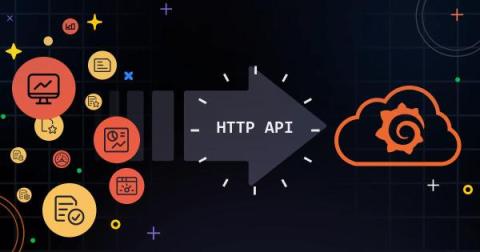
How to use HTTP APIs to send metrics and logs to Grafana Cloud

Integrating monitoring and logging into your application stack is crucial for maintaining performance, enhancing security, and streamlining troubleshooting. Grafana Cloud offers a robust solution for monitoring your applications by collecting metrics and logs using an agent, such as Grafana Agent, but there are many environments where this isn’t feasible.

OpenTelemetry distributed tracing with eBPF: What's new in Grafana Beyla 1.3

Grafana Beyla, an open source eBPF auto-instrumentation tool, has been able to produce OpenTelemetry trace spans since we introduced the project. However, the traces produced by the initial versions of Grafana Beyla were single span OpenTelemetry traces, which means the trace context information was limited to a single service view. Beyla was able to ingest TraceID information passed to the instrumented service, but was unable to propagate it upstream to other services.

Maximize IT efficiency leveraging alert management with Elastic AI Assistant for Observability

Manage and correlate signals and alerts in Elastic Observability As organizations embrace increasingly complex and interconnected IT systems, the sheer volume of alerts generated by diverse monitoring tools has given rise to a critical challenge — how do we efficiently sift through the noise to identify and respond to the most crucial issues? Event management and correlation are two indispensable pillars in the realm of IT service management.

How to enhance network monitoring: 3 anomaly detection use cases

In the LM Envision platform, anomaly detection for metrics is referred to by the feature name “Dynamic Threshold” rather than the more generic machine learning term “anomaly detection.” Dynamic thresholds allow users to identify and set custom alert thresholds based on observed data points. Metric thresholds in rules-based systems are effective when the desired outcome is clear. However, static thresholds may not anticipate emerging issues.

A Comprehensive Guide to IT Capacity Planning

Effective capacity planning and management are fundamental to maintaining a robust IT infrastructure, helping teams optimize available resources to meet performance needs. In this guide, we’ll walk you through everything you need to know about these invaluable processes to ensure your organization’s IT infrastructure is prepared for current and future demands.

Linux Netstat Command - How To Use Netstat For Linux Network Management

Netstat is a powerful command-line tool that provides valuable insights into your computer's network connections and performance. This article will explore what netstat does, how to use it on Linux systems, and ways to leverage netstat for network troubleshooting and monitoring.

The Best Strategy For Microsoft 365 Performance

In today’s lightning-fast world, seamless teamwork and communication are like oxygen for any company. And that’s where having a strategy for Microsoft 365 performance gives you an edge. It’s the epicenter of collaboration within the Microsoft 365 universe. It helps teams connect, build, and crush their goals. But, keeping Microsoft Teams purring like a kitten is essential to avoid revenue hiccups.
Top 15 Linux Monitoring Tools Everyone Should Have!

Linux is a powerful and widely-used operating system used by individuals, businesses, and organizations around the world. With its open-source nature and customizable features, Linux has become a popular choice for those seeking a reliable and efficient system for their computing needs. However, with this power and flexibility also comes the need for proper monitoring and management.

Break Production Less: Introducing Codecov's Pre-release Focus

While there are several solutions that try to help you improve your testing practices and tooling, we believe that high-quality software is not just limited to how well it’s tested. That’s why we’re expanding beyond code coverage and building the foundation for the first of its kind pre-release platform with Bundle Analysis, Test Analytics, and AI-Powered Code Review.

The Business Critical tier becomes the optimal choice for mission-critical SQL workloads
Microsoft has recently announced the Business Critical service tier in Azure SQL Database Managed Instance in the general availability. Being a new deployment option in the SQL Database, Managed Instance streamlines SQL Server workloads migration from on-premises to the cloud. It also combines the native SQL server features and capabilities with the benefits of a fully managed database service.

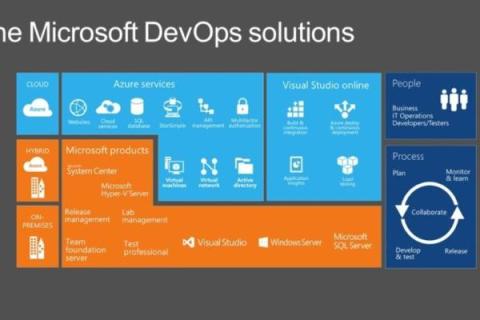
What are the Benefits of Azure DevOps Project?

Latest technologies help the organizations to market their products in a comprehensive manner while they also develop and integrate their product at a faster pace without wasting their time and efforts. Azure DevOps project is a similar application developed to bring ease for the customers. The app is available on the Azure service and it allows the users to develop, deploy, and monitor your code. No need to open multiple interfaces as you can manage all of this from one view.

Netreo adds support for Azure Application Gateway monitoring and automation

Azure Application Gateway provides application-level routing and load balancing services that let customers build scalable and highly-available web front ends in Azure. Traditional monitoring setup creates challenges as it involves defining parameters based on the expected behavior, setting up dashboards to visualize the data and configuring alerts and notifications. This approach has its limits and the additional layer of automation becomes necessary.

Decoding SaaS Customer Cost: A Guide to Calculating Cost per Customer in Azure

In the SaaS era, especially in the B2B segment, the business’s profitability will vary from customer to customer. It is usual to observe that there would be a few “expensive customers” who use the platform heavily, which could also mean they are profitable customers. But we cannot take plain guesses! As a business, ensuring that the revenue we receive from each customer is appropriate for what it costs us to deliver the value is significant.

Implementing OpenTelemetry OTLP in .Net

The.NET framework is a powerful platform for creating various applications, from web-based services to comprehensive enterprise solutions. Its extensive libraries, support for multiple programming languages, and powerful development tools enable the creation of high-performance, scalable applications that can be customized to suit various needs. This framework continuously evolves to meet the demands of modern software development with a complete ecosystem of add-ons created by an enthusiastic community.

Mastering Log Retention Policy: A Guide to Securing Your Data

The strategic implementation of a security log retention policy is critical for safeguarding digital assets and key company data. This practice is foundational for detecting and analyzing security threats in real-time and conducting thorough post-event investigations. Integrating the nuances of log analytics system costs, which escalate with data volume due to the infrastructure needed for storage and processing, highlights a critical aspect of security log retention.

Tame the Complexity of Software-Defined WANs and Hybrid Networks

As organizations increase their dependence on the cloud, they also add pressure on their wide area network (WAN) infrastructure. Software-defined wide area networking (SD-WAN) comes as an ideally suited solution for implementing distributed networking over commercially available Internet access.

What is Telemetry?

Each software performs and responds differently in dynamic and distributed networks. In fact, as more and more technologies are developing, it is becoming difficult and challenging for businesses to understand the needs and concepts. Hence, it has become essential to get a better understanding of how the software performs in real-world scenarios and tracks all the advancements made on several products.

Is Poor Microsoft Teams Performance the Reason your Team is Struggling?

If you are managing a revenue generating or customer facing team the highs and lows of poor Microsoft Teams performance can be frustrating. See why a top-notch Microsoft Teams experience is so critical to your team’s success.

AI realism (part one)

Emotions are running high about AI technologies. In this 2-parter, I do my best to make a rational case on the reality of AI, and how we can respond to it. This is part one; part two next week. We seem to be struggling to have pragmatic discussions about advancements in Artificial Intelligence. It’s hard to hear calmer voices over the detractors and breathless enthusiasts.

9 Best Remote Desktop Alternatives

With hybrid and remote work environments, many employees need to access their office desktop computers from another device. IT admins also need an efficient IT help desk available to help them troubleshoot and quickly resolve issues with the end users from any location. As a result, a number of organizations have turned to network communication protocols such as remote desktop protocol (RDP). While RDP gets the work done, more comprehensive remote access solutions exist.

Cloud migration vs modernization - What's the difference?

Cloud migration vs modernization – What are the nuances? Cloud migration involves moving applications and data to the cloud often with minimal changes to their architecture. Cloud migration projects usually aim to leverage cloud infrastructure for benefits such as scalability, flexibility and reduced on-prem maintenance.

AI-powered Autofix debugs & fixes your code in minutes

Sentry knows a lot about the inner workings of an application’s codebase. So we got to thinking, how can we use this rich dataset to make debugging with Sentry even faster? Many generative AI (GenAI) tools (e.g. GitHub Copilot) improve developer productivity in their dev environment, though few have the contextual data Sentry has to help fix errors in production.

Machine Learning and Infrastructure Monitoring: Tools and Justification

In the rapidly changing world of technology, effective monitoring is critical for maintaining your infrastructure and ensuring it performs effectively. While traditional monitoring methods are effective, they can fall short as systems scale and become more dynamic and complex. This article aims to bridge the gap by introducing software engineers to the power of machine learning (ML) in infrastructure monitoring, outlining not just the ‘how’ but the ‘why’ of its application.

Grafana Cloud updates: cool visualizations, log monitoring made easier, simplified alert routing

We are consistently releasing helpful updates and fun features in Grafana Cloud, our fully managed observability platform powered by the open source Grafana LGTM Stack (Loki for logs, Grafana for visualization, Tempo for traces, and Mimir for metrics). In case you missed it, here’s a roundup of the latest and greatest upgrades for Grafana Cloud this month. If you’re not a Grafana Cloud user, what are we waiting for?

AIOps as a Service for MSPs: What to Look For

AIOps is a game changer for MSPs. But how do you implement AIOps to ensure you get those game-changing benefits? Chances are, you’re not interested in spending the resources and time required to build it yourself with all of the development, testing, maintenance, etc. that entails. Instead, AIOps as a service provides you with the capabilities to better manage the IT infrastructure and operations of multiple clients.

How to Propagate OpenTelemetry Trace Headers Over AWS Kinesis: Part 2

In the first article of our series, we explored the importance of trace headers and the complexities involved in their propagation. Now, we shift from theory to practice. This second installment will take you through a hands-on baseline scenario and our initial strategy of propagating the OpenTelemetry trace context in AWS Kinesis by using the PartitionKey parameter.

Optimizing Barracuda SecureEdge: How to Proactively Monitor Your Barracuda SASE Network

With many SASE vendors prioritizing security over performance, businesses are left with a gap in their network management strategies. Before implementations, SASE vendors make promises about the performance of their SASE services, but, how can customers ensure they’re getting what they paid for? And how can they avoid slow or sluggish networks leading to frustrated users, decreased productivity, and even financial losses?

Top 11 Website Performance and Availability KPIs You Should Care About

The availability and performance of a website is critical to achieving success for the business behind it. That’s why website owners must deeply concentrate on monitoring and sweetening their website’s Key Performance Indicators (KPIs). In our post today, we aim to get to know the top 11 availability and performance KPIs website owner should be aware of. We will categorize these indicators into three segments: availability KPIs, performance KPIs, and user engagement analytics.

Monitoring Software-Defined, Cloud, and ISP Networks

For decades, the data center has been the core hub for applications, routing, firewalls, processing, and more. Now, the enterprise is highly reliant upon distributed workplaces, cloud-based resources, and third-party-operated networks. In this context, modern networks encompass more diverse infrastructures, requiring IT organizations to contend with the added demands of managing and maintaining these expanding environments.

Receive Cribl Notifications on a Distribution List or Group Email Alias

IT and security teams have several products they use and in turn, have many admins. Some have wide privileges, while others have focused responsibilities for the various tools and touch points in an IT and security data path. Not all admins are members of all tools. But they are all typically part of a larger group bound by an email alias (aka a distribution list).

SaaS, PaaS & IaaS: The Ultimate Guide To Cloud Service Models

The emergence of cloud computing. Arguably the biggest change in technology in decades, cloud computing changed how technology would now develop and how businesses and organizations would operate. Indeed, the enormous popularity of cloud services is due precisely to that: you can get different models depending on your operational needs. To properly utilize these cloud service models, you should understand the differences in their functional capabilities and the ideal use cases for each model.

How to Propagate OpenTelemetry Trace Headers Over AWS Kinesis: Part 1

Welcome to our series on navigating the complexities of trace header propagation with OpenTelemetry in AWS Kinesis. In this 3-part exploration, we'll dive into the critical role of trace headers in distributed systems, discuss the unique challenges presented by AWS Kinesis, and explore innovative solutions that keep your data tracking robust and consistent.

Beyond Traditional Defenses: Integrating IDS and NDR for Improved Detection Capabilities

AI-powered Network Detection and Response (NDR) solutions have become a staple for identifying the subtle indicators of unknown threats, a crucial element in the constant battle against cyberattacks. While NDR excels in unveiling the shadows of the unfamiliar, it is the traditional signature-based Intrusion Detection Systems (IDS) enabling security teams to maximize protection and facilitate targeted responses, particularly when confronting well-known malware.

Instrumenting using the Java OpenTelemetry OTLP

Java has long been a foundational pillar in application development, its versatility and robustness serving as key drivers behind its widespread adoption. Since its inception, Java has evolved to meet the ever-changing demands of scalable deployments, offering a reliable platform for creating everything from web applications to complex, server-side systems.

How to Configure a State Timeline Panel | Grafana

💡 Do you want to know how and when to use state timeline visualizations? Join Senior Developer Advocate Marie Cruz in this beginner-friendly tutorial to learn how to configure a state timeline panel in Grafana. ☁️ Grafana Cloud is the easiest way to get started with Grafana dashboards, metrics, logs, and traces. Our forever-free tier includes access to 10k metrics, 50GB logs, 50GB traces and more. We also have plans for every use case.

Annotating Events with Grafana | Grafana for Beginners Ep. 10

As we observe our system, we are bound to come across some interesting events or failures. By flagging these events and adding context, we can communicate whether further investigation is needed or if action should be taken to address these events. This is known as annotating events. Join Senior Developer Advocate, Lisa Jung to learn how to annotate events with Grafana. ☁️ Grafana Cloud is the easiest way to get started with Grafana dashboards, metrics, logs, and traces. Our forever-free tier includes access to 10k metrics, 50GB logs, 50GB traces and more. We also have plans for every use case.

What is Network Quality of Service (QoS) and How Can I Achieve It?

Quality of service (QoS), in network and telephony, parlance has both specific and less precise but more practical meanings. In general, quality of service can be viewed as measuring the performance of a network or telephone service, thereby providing an indication of its quality.

Top 9 Observability Tools of 2024

The ability to peer deeply into the inner workings of software and systems isn’t just advantageous – it’s essential. Observability, a term that’s gaining traction among tech professionals, stands at the forefront of this shift, empowering software engineers and DevOps teams with the clarity and insight needed to steer complex systems toward optimal performance.

How "Cloud Repatriation" Adds Flexibility and Power to Your Digital Transformation Playbook

The notion of moving assets out of the cloud may sound like a step backward in an era where digital transformation is driven primarily by migration efforts into the cloud. But it turns out deliberately shifting cyber assets away from the cloud– known as “cloud repatriation”– can be a highly strategic option for CIOs and enterprise IT teams looking to strike the optimal balance of cost, security, performance, and scalability in their IT environments.

Cron Jobs In Linux - How To Use Cron Jobs To Automate And Schedule Tasks

Cron is a job scheduling utility included in most Unix-like operating systems. It allows users to schedule and automate the execution of repetitive tasks at specific intervals. The crond daemon is the background process that enables cron functionality. It continuously runs in the background, checking for predefined scripts or commands to run in crontab files.

Insanely Powerful Tool for Microsoft 365 Performance Issues

Are you tired of troubleshooting Microsoft 365 performance issues with a blindfold on? Whether you’re dealing with the frustrating slowness of Office 365 or facing Microsoft Teams audio and video quality issues, you’re not alone. In this blog, we’ll explore a new report produced by research analyst EMA, tailor-made for IT Managers, revealing a critical IT blind spot when it comes to Microsoft 365 performance issues.

Using Syslog with DX NetOps

For IT operations teams, syslog messages continue to be a vital source of intelligence for network events. By tapping into this data, teams can manage their environments more efficiently and effectively. In this post, we offer an introduction to syslog, and examine how DX NetOps enables teams to fully harness the intelligence from this data.

Early Detection of Network Issues: Keys to Success

Regardless of which sandwich is their favorite, your customers and end users are highly reliant upon your organization’s network-powered business services. When issues arise that affect the delivery of these services, fast and effective response is a must. The costs of performance issues and downtime can mount by the minute, so sooner is definitely better than later.

What are networks? Part 1: A guide to networking fundamentals

Are you intrigued by the world of networks and how they work? Do you want to know how your devices communicate with each other? Well, you're in the right place! In this blog series, we're here to help you gain a better understanding of networks, starting with the basics. We'll cover everything from the different types of networks to how they function, so you can better plan for capacity and take decisive action when issues arise.

VictoriaMetrics Machine Learning takes monitoring to the next level

Today we’re happy to announce our new VictoriaMetrics Anomaly Detection solution, which harnesses machine learning to make database alerts more relevant, accurate and actionable for enterprise customers. VictoriaMetrics Anomaly Detection lightens the load on overworked data engineers, focusing their scarce resources on the alerts that matter most to their organization.

Configuring Alert Notifications and Policies in WhatsUp Gold

WhatsUp Gold Alert Center detects and notifies you of critical messages, failures, and other key events happening within your environment. Watch this video to learn how to set up alert notifications, so you can generate an email message when a problem occurs, or escalate an ongoing issue via a series of emails.

Mastering Cloudflare One: How to Proactively Monitor Your Cloudflare Zero Trust SASE Network

As organizations transition to distributed work environments and adopt cloud-based applications, the demand for secure, agile, and high-performing networks intensifies. As a result, many businesses have decided to implement Secure Access Service Edge (SASE), which integrates networking and security functions into a unified cloud-native platform.

Network Troubleshooting: A Guide for IT Professionals

Imagine your organization’s network suddenly goes down, halting operations and causing revenue loss by the minute. While this scenario is unsettling, it goes to show why network troubleshooting skills are essential for today’s IT professionals. The smooth operation of network infrastructure not only supports your organization’s day-to-day operations, but also safeguards against disruptions and downtime.

Maximizing Network Performance Monitoring: Key Strategies

In today’s interconnected world, network performance and network management is critical for businesses to function seamlessly. Whether it’s ensuring smooth communication, efficient data transfer, or secure transactions, a well-monitored network is essential. This article delves into the importance of network monitoring in maintaining optimal performance.

Caught in 4K! New Splunk Features Help Find Problems Faster With Full Visibility of Your Tech Stack

As environments have become more complex and digital user expectations are at an all-time high, organizations are under more pressure than ever to keep their digital systems secure and reliable. At Splunk, we’ve been hard at work building features that help ITOps and engineering teams thrive amid digital disruptions and build resilient systems.

What is Application Performance Monitoring?

In this "Observability in Action" video, Andreas Prins, CEO of StackState, unveils the significance of Application Performance Monitoring (APM) and the results delivered. APM is pivotal for maintaining service levels, detecting application issues, ensuring customer satisfaction, and achieving a swift Mean Time To Repair. Andreas explores how StackState's APM solution transcends typical monitoring tools by offering.

Graylog Appoints Ross Brewer as Vice President and Managing Director EMEA to Support its Strong International Growth

Graylog announces Ross Brewer's appointment as Vice President and Managing Director in EMEA, based in the company's London office. This strategic executive appointment will help the Hamburg-born company build upon its strong momentum across the EMEA region.

Maximizing Operational Consistency in Modern Networks

With increasingly large, complex, and dynamic network environments, operational consistency is essential for network teams to effectively mitigate disruptions, improve performance, and ensure optimal resource utilization. However, many organizations still struggle to establish an effective mix of people, processes, and technology.

Linux CPU Utilization - How To Check Linux CPU Usage

CPU utilization is a crucial metric for measuring system performance and identifying potential bottlenecks in Linux systems. This article explores the concept of CPU utilization, factors contributing to high CPU usage, and various command-line tools and graphical utilities for monitoring and troubleshooting CPU utilization in Linux environments.

Introducing Metrics for Developers | Launch Week | March 2024

Today, Sentry metrics in beta and free to use – eligible users will now see Metrics in their Sentry accounts. This isn’t just another tool; it’s your new best friend for tracking the data points that matter most to you over time. With Metrics, you can pinpoint and resolve issues with correlated traces, ensuring your product/service/code is always running as intended.

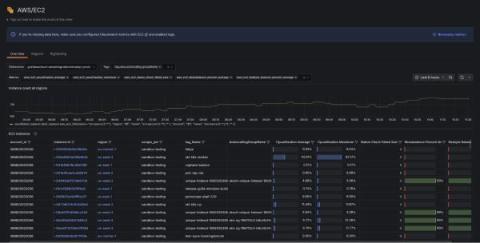
AWS Observability in Grafana Cloud: A simpler, more intuitive cloud monitoring app

We know monitoring your AWS environment can be difficult, which is why we’re thrilled to tell you about a new application we’ve built to make the entire process easier, more efficient, and more intuitive. We’ve offered AWS monitoring capabilities for some time, but with the AWS Observability application in Grafana Cloud, we’ve distilled our collective efforts into a more integrated and potent solution.

The Business Case for OpenTelemetry - APM for Modern Applications

DevOps professionals know that ensuring optimal application performance is paramount. More and more customers and prospects interact with companies online, and any hiccup can impact your bottom line. What’s more, companies continue to leverage cloud-native apps for improved flexibility and resource optimization. All of which means that Application Performance Monitoring (APM) tools need to evolve.

Transforming Financial Services with Modern Observability: Moov's Story

As a new company poised to transform the financial services industry with its modern money movement platform, Moov wanted an equally modern observability platform as part of the company’s operational tech stack. With Moov's platform hosted in Google Cloud, it uses a diverse range of technologies to allow clients to accept, store, send, and spend money. The integration of numerous software providers further amplifies the complexity of each transaction.

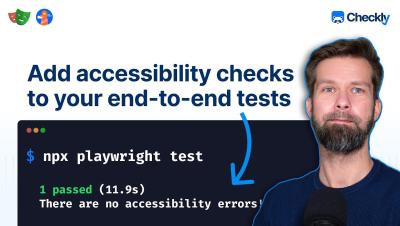
Add accessibility checks to your Playwright end-to-end tests

Join us in today's video as we dive into the world of web accessibility testing with "axe-core". "axe-core" is used in Google Chrome's lighthouse and is quickly integrated in your Playwright end-to-end tests. We'll integrate "axe-core/playwright", detect accessibility issues, attach these to test reports and even integrate accessibility checks in Checkly's synthetic monitoring thanks to a new beta runtime.

Observability vs. Monitoring: How Do They Work?

As organizations increasingly depend on distributed system architectures to provide modern applications and microservices, their legacy monitoring tools struggle to keep pace. These outdated systems are often based on predictable failures, but when an unforeseen performance issue occurs, it can lead to outages and unplanned downtime that impacts your customers and your business.

The Top 10 Web Application Monitoring Tools

Wherever end-user success is critical to a business, your website’s functionality needs diligent testing. Therefore web application monitoring is required for many organizations. Conducting web application monitoring can also offer a whole host of additional advantages to organizations. For example, tracking user interactions and behaviors within the web application aids your organization in understanding how users engage with your application.

Measure what matters and fix issues fast with Metrics: now in beta

Four years ago, we stepped on some big toes with our developer-first performance monitoring. Since then thousands of software teams have adopted our modern APM solution. But while Performance checks off a lot of boxes, some dev teams juggle separate tools for metrics, leading to a fractured experience. And honestly, what good is a metric without all the context you get from Sentry? Not very – it makes tying problems back to underlying errors or performance issues unnecessarily difficult.

Optimizing Performance and Reliability in Messaging Systems

In today’s digital landscape, the performance and reliability of messaging systems are paramount for business operations. Systems like IBM MQ play a crucial role in ensuring seamless communication between different parts of an application, impacting everything from transaction processing to customer experiences. To optimize these systems, it’s essential to focus on robust monitoring, efficient troubleshooting, and effective tuning techniques.

How LM Envision removes the logs blindfold

Rules are excellent when you know precisely what you want to match, typically based on experience. Yet rules only let you observe what you have learned to look for. This is where artificial intelligence (AI) and machine learning (ML) contribute significantly to observability – detecting errors and early warning signs that were previously unobservable. LM Envision supports metric and log anomaly detection. This blog discusses how LM Envision Log Anomalies uncovers previously unknown anomalies.

Top 13 Cloud Cost Management Solutions of 2024

As of 2023, 89% of companies are using a multi-cloud approach. The race to the cloud might feel truly like that – a race – but the finish line isn’t hybridization or even a full migration. Even after you’ve made it to the cloud, there’s still more work. Namely, determining cloud costs. Microservices, containers, Kubernetes made resource costs, associated costs and more are near-impossible to sort though.

Mastering SNMP Traps: Understanding, Implementing, and Best Practices

Effective network monitoring and management are essential for maintaining optimal performance and ensuring business continuity in today’s complex IT environments. One of the key tools for achieving this is the Simple Network Management Protocol (SNMP), which can be used with SNMP polling or SNMP traps.

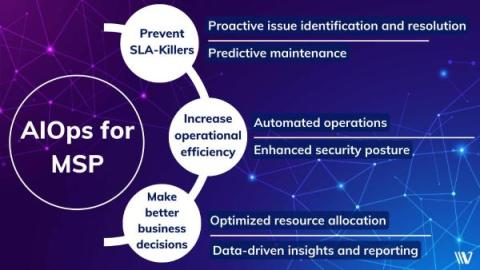
6 Ways AIOps Is a Game Changer for Managed Service Providers

The managed service provider (MSP) model delivers tremendous value for clients. They benefit from expertise and implementation that would be difficult and cost-prohibitive to build and manage themselves. The MSPs take on those responsibilities, which means they are on the hook for delivering the services to their clients in an effective and efficient manner.

IT Directors - Are You Blind to this Silent Productivity Killer?

Hybrid work models have taken center stage as the new norm for global enterprises, and Microsoft Teams has become the leading collaboration platform to keep hybrid and remote teams connected and collaborating. However, as return to office has grown, the Teams user experience in the office hasn’t been as solid as it was for many employees at home, with friction in the user experience resulting from in-office network constraints.

Nexthink: Innovation from the Swiss Alps - a Pioneering Proactive IT Solution

Near Lausanne, at the heart of the Swiss Alps where innovation meets tradition, Nexthink is developing a ground-breaking proactive IT solution. Founded in the early 2000s at EFPL’s Artificial Intelligence Laboratory, Nexthink opened its first offices at Lausanne and quickly gained global recognition for its efforts to optimize IT based on the user perspective and to proactively enhance the IT experience – and the working life – of workforces everywhere.

Scanning the Edge: Expand Your Visibility to New Heights

Data is born at the edge, and the traditional approach is to collect it, then ingest it into one or more systems of analysis — or at least as much as you can afford to. And now the deep dive analysis begins. This might be the perfect solution for some datasets, but what about all the other data being collected on the edge? All the logs, metrics, and state information you seldom (if ever) retrieve?

Mastering FortiSASE: Your Ultimate Guide to Proactive Network Monitoring for Fortinet SASE Solution

As organizations embrace distributed work environments and cloud-based applications, the need for secure, agile, and high-performing networks has never been more pressing. That’s where SASE comes in! Secure Access Service Edge (SASE) networks converge networking and security functions into a unified cloud-native platform, making them extremely popular for large enterprises nowadays.

NoSQL Databases: The ultimate Guide

Today, many companies generate and store huge amounts of data. To give you an idea, decades ago, the size of the Internet was measured in Terabytes (TB) and now it is measured in Zettabytes (ZB). Relational databases were designed to meet the storage and information management needs of the time. Today we have a new scenario where social networks, IoT devices and Edge Computing generate millions of unstructured and highly variable data.

Top 3 Data Removal Tools for Ultimate Cyber Hygiene

Every click, search, and download leaves a trace. Scary, right? Or do you not think about it until you’re part of a data leak? It’s probably the second one. Yet, our digital footprint is something we should all focus on. In 2023, IT Governance studies showed 8,214,886,660 records of data breaches. And that’s only the ones logged on record. There will be more than that. It’s called cyber hygiene, and data removal is one essential part of it if you spend your days online.

Application observability: Maximizing uptime and performance

In this blog post, we'll dive into the critical role of application observability in maintaining optimal performance and uptime. We'll explore how it works, why it's essential, and how it transforms challenges into opportunities for growth and improvement. So, if you're looking to elevate your application's performance and reliability to new heights, you're in the right place.

Splunk Joins Cisco: Our Partner Ecosystems Just Got Even Stronger

What do you get when you combine the full power of the network with market-leading security and observability solutions? More customer value and an amazing partner ecosystem. It’s official! Today, with the closing of the acquisition, Splunk became part of Cisco. We’re looking forward to this exciting new chapter of our journey together – and it couldn’t have come at a better time.

Ways to Reduce IT Costs with Observability

Imagine you are driving a car with no dashboard. You can't see the speed, fuel level, or engine temperature. You are flying blind, hoping everything is okay until something goes wrong. This is what it's like to manage complex IT systems without observability. Observability is the key to understanding the internal state of a system. It is crucial for detecting and resolving issues efficiently, reducing downtime and costs.

How to mitigate common user experience issues by effectively monitoring key NGINX metrics

Delivering optimum user experience is critical for any organization. The performance of web servers plays a pivotal role in determining the quality of your online platforms. And the smooth delivery of content and seamless interactions in websites and web-based applications are crucial for gaining engagement and retaining users.

Running Your Playwright Tests in Parallel or in Sequence

Playwright offers robust capabilities for automating browser tests. A common question among developers, however, revolves around the best practices for structuring Playwright projects, especially when tests involve significant environment changes, resource creation, or database updates. This blog post describes strategies for running Playwright tests either in parallel or in sequence, optimizing your testing workflow for efficiency and reliability.

MTTR Demystified: Mean Time to Recovery, Repair, or Respond?

You might have heard of MTTR or MTBF. They are all important factors that make up incident management. Incident management refers to all the managerial processes behind bringing a site back to its uptime when it suddenly encounters any unplanned fault. And that is precisely why managing them is important. We must keep our site up-to-date so that downtimes are reduced, and customers can access any information with the least wait time.

Forward and reverse DNS lookups: What they are, why you need them, and how to configure them

Effectively managing the dynamics of domain name lookups through the DNS is crucial for boosting the speed and security of network connections. Forward and reverse DNS lookups, the yin and yang of network connections, translate human-friendly domain names into machine-readable IP addresses and vice versa, ensuring secure connections within both public and private networks.

5 Top Network Scanning Tools in 2024

Network device scanning effectively ensures connected devices and applications to your network perform as per the expected standards without any vulnerabilities. Regular network scanning allows you to gather data from the connected devices and applications to check their uptime and performance. It can also allow you to safeguard your network devices and applications from cyberattacks.

AI Explainer: Supervised vs. Unsupervised Machine Learning

Machine learning is a powerful tool that enables computers to learn from data and make predictions or decisions without being explicitly programmed. Two fundamental approaches to machine learning are supervised and unsupervised learning. In this blog post, we'll explore the key differences between these two approaches, along with examples of their applications.

Why Cloud Migrations and Repatriations are so Important and How to Get Them Right

Cloud computing has transformed the landscape of IT and business over the past several years, offering unparalleled speed, scalability, flexibility, and cost-efficiency to organizations of all sizes. However, amidst the widespread adoption of cloud technologies, there's a noteworthy phenomenon that's also gaining attention and traction: cloud migrations and repatriations.

How Azure cost anomaly detection shields billing shocks

One of the fundamental promises of the cloud, when organizations embrace it, is significant cost savings compared to its on-premises costs. However, organizations to realize savings is required to proactively plan and monitor the application’s cost at a granular level. Azure cost anomaly detection involves promptly identifying, rectifying, and analysing unexpected Azure cost events to minimize their impact on the business.

NodeJS Instrumentation with the Lumigo OTLP endpoint

As software systems become more complex, navigating their inner workings has become increasingly difficult due to the evolution of more advanced architectures. While distributed systems, such as microservices and cloud-native architectures, offer benefits in scalability and agility, they also make it more challenging to pinpoint and resolve system issues. Traditional methods for tracking errors are often insufficient in these multifaceted environments.

Kubernetes CronJob: Complete Guide to CronJobs

Kubernetes CronJobs are a feature that lets you automate tasks in a Kubernetes cluster. They let you schedule and run jobs on a regular basis, making them good for tasks like data backups, database maintenance, log rotation, and more. CronJobs help make operations easier and reduce manual work, letting you focus on other important parts of your application. In this guide, we will explain what CronJobs are and how they are different from regular Kubernetes Jobs.

Simplify production debugging with Datadog Exception Replay

Debugging errors in production environments can frustrate your team and disrupt your development cycle. Once error tracking detects an exception, you then need to identify which specific line of code or module is responsible for the error. Without access to the inputs and associated states that caused the errors, reproducing them to find the root cause and a solution can be a lengthy and challenging process.

Top 10 Reasons Why Every K-12 School Needs StatusGator

K12 school districts often depend on 40+ services to deliver education and run operations since their usage of ed tech increased by 99% during the past 4 years. Managing K12 software and services can be challenging due to the limited human resources and budget that the school IT teams typically have. As a result, many tools and services are designed to help K-12 schools manage their digital services.

Diving into Observability Platform: OpenTelemetry vs Datadog

Imagine you're leading a team of engineers responsible for monitoring and optimizing the performance of a cloud-based application used by millions of users worldwide. As the application continues to scale, you recognize the pressing need for a robust observability solution to learn about its distributed architecture. In this scenario, you're faced with an essential decision: choosing between OpenTelemetry and Datadog for distributed tracing and observability.

Aspire Insights in Production with Sentry and OpenTelemetry

With the release of.NET 8, Microsoft released a new framework called.NET Aspire that’s shaking up the way distributed applications are crafted. Aspire makes it painless to configure and deploy distributed apps in.NET. You can check out the Aspire docs for a full rundown.

Expanding the AWS partnership Amazon Timestream for InfluxDB

InfluxData CEO, Evan Kaplan, discusses the company's expanded partnership with AWS. Open source InfluxDB is now available as a managed service on AWS. Discover what this means for InfluxDB and AWS users, and what additional offerings are in the works to help uers improve their Time to Awesome.

Improve Your Playwright Documentation with Steps

When you’re implementing automated testing, clarity and maintainability of test scripts are as crucial as the tests themselves. Playwright offers a feature that enhances the readability and ease of debugging of your tests: test steps. This article explores how to use test steps in Playwright to document your test cases effectively.

Mastering Citrix SD-WAN Monitoring for Maximum Network Efficiency and Visibility

As more and more companies seek to enhance their network infrastructure, the adoption of SD-WAN solutions has become increasingly common. These solutions offer promising benefits, from optimizing application performance to reducing costs associated with traditional WAN architectures. However, while many SD-WAN vendors tout monitoring capabilities, they often fall short of providing comprehensive network visibility and proactive monitoring. So, what's the missing link?

Insights Into Our Marketing Playbook

This week, Josh and Ben dive deep into the marketing strategy for their new product, Insights, in response to a listener question. They talk about what groups they are targeting first, some of the planned marketing tactics for reaching each group, and how they are building awareness within the Honeybadger app without annoying existing users.
Sponsored Post

CloudFabrix at Cisco Live EMEA - Highlights

Cisco’s one-of-a-kind conference, Cisco Live EMEA 2024 in Amsterdam, marked a pivotal milestone in illuminating the path forward with a spotlight on AI, operational simplicity, and security. Bringing key network telemetry and correlating it with the business outcomes has become quite essential for Modern Enterprises and CloudFabrix addressed this by launching three new modules for the Cisco Observability Platform.

Deep Dive - Table Panel Visualizations: What Are They? How to Get Started? | Grafana

Here is the video that will show you every little component of the Table Panel Visualization so that you can include incredible Tables in your dashboards. This deep dive shows you all the little perks you can modify in your tables, even common details like colorize single columns, hide them or make them outstanding from the other columns.

Securing your digital fort: Why firmware vulnerability management is essential

Think of your network device firmware as a fortress that can withstand attacks and protect you from potential threats in the digital world. It acts as a guardian, keeping hackers and malicious software at bay so you can be confident that your data is safe. However, any imposing medieval fortress standing tall and proud with seemingly impenetrable walls, no matter how strong it seems, can't keep up with a relentless barrage from the latest weaponry.

What is Observability and Why It's Essential to Effective AIOps

Modern hybrid IT estates generate huge volumes of data at velocity, a testament to today’s digital reality. But for IT Operations Management (ITOM) teams charged with keeping tabs on system health, this data proliferation can be a nightmare scenario. Tool sprawl, alert storms, manual analysis, and disconnected insights make maintaining a current state, let alone supporting better business outcomes, a perpetual challenge.

The 7 Most Common Python Debugging Challenges and How to Handle Them

According to PYPL (PopularitY of Programming Language), Python has been the most popular programming language worldwide from 2018 to the present. Remarkably, Python’s popularity has grown by 2.5% over the last five years. In contrast, Java, the previously most popular language, has seen a 4.8% decrease in its popularity. While Java is typically faster than Python, Python is easier to read with its simpler syntax.

Integrating OpenTelemetry Instrumentation with FastAPI

What do we gain when we integrate OpenTelemetry with FastAPI? Integrating OpenTelemetry with FastAPI offers many benefits that greatly improve the observability and monitoring capabilities of applications built on this high-performance web framework. By integrating OpenTelemetry's instrumentation capabilities into FastAPI projects, you can understand your applications' inner workings, enabling them to monitor, analyze, and optimize performance.

Scheduling Python Scripts with Cron Jobs

Scheduling tasks to run automatically at set times or intervals is important in web development, system administration, and software engineering. This article shows how to schedule cron jobs in Python, making them work in different environments. Cron jobs help automate tasks like data backups, sending emails, generating reports, and more.

4 Reasons Why Your Business Needs Network Detection and Response Solutions

Endpoint protection has long been fundamental to cybersecurity. But in today’s evolving and expanding digital landscape, with endpoints spanning a wide variety of devices, is traditional endpoint security enough? The ongoing frequency of successful cyberattacks suggests not. Cloud proliferation, remote work and expanding system access add to the challenge. Can you truly trust users to keep their devices secure amidst this shifting landscape?

New Teams Client Challenges Draining Valuable IT Time? Vantage DX Can Help

Microsoft has pushed the end of availability for the classic Teams client from March 31, 2024 to July 1, 2024. This move will give administrators more time to address any issues they have encountered while transitioning to the new Teams app. Since its general availability in October 2023, enterprises have migrated users to the new Teams client and many have experienced both performance and functionality issues that have impacted user productivity and consumed considerable IT resources.

Network Automation: Are You the Only One Not Doing It?

In this lively webinar, Corey Quinn from the Duckbill Group, alongside Kentik's Rosalind Whitley and Phil Gervasi, explore network automation, pondering the question, "Am I the only one not doing it?" They explore the current landscape of network automation, discussing tools, value, and the realness of Net DevOps. The trio also considers the future role of AI in networking, debating its potential beyond hype. This conversation sheds light on the cultural and technological factors influencing network automation's adoption and evolution.

AIOps vs. Observability: Which Is Better and Why?

If you’ve been keeping up on what’s buzzing in the IT operations and software development space in the past few years, then you know that the concepts of AIOps and observability have been getting a lot of attention. And while they are related, they each address a different aspect of managing and monitoring IT systems.

The engineering on-call experience: misconceptions, lessons learned, and how to prepare

The on-call experience is sometimes a dreaded one for software engineers. Those late-night alerts and frantic Slack messages, after all, don’t exactly sound pleasant. But what’s an on-call shift really like? Is that perception of constant fire-fighting and 3 AM wake-up calls actually realistic? Michael Mandrus and Owen Smallwood, both senior software engineers here at Grafana Labs, wanted to set the record straight.

InfluxData Collaborating with AWS to Bring InfluxDB and Time Series Analytics to Developers Around the World

SAN FRANCISCO – March 14, 2024 – InfluxData, creator of the leading time series platform InfluxDB, today announced a collaboration with Amazon Web Services (AWS) to deliver Amazon Timestream for InfluxDB, a new managed offering for AWS customers to run InfluxDB open source natively within the AWS Management Console.

AWS Partners with InfluxData to Bring InfluxDB Open Source to Developers Around the World

Today, AWS announced Amazon Timestream for InfluxDB, a new managed offering for AWS customers to run single-instance open source InfluxDB natively within the AWS console. This partnership represents a significant multi-year commitment by AWS to combine its global reach and accessibility with our industry-leading time series database, InfluxDB. AWS adding InfluxDB as a preferred time series database reflects the demand from AWS customers for InfluxDB and evidence of the time series market acceleration.

OpenTelemetry Best Practices #2 Agents, Sidecars, Collectors, Coded Instrumentation

For years, we’ve been installing what vendors have referred to as “agents” that reach into our applications and pull out useful telemetry information from them. From monitoring agents, to full-blown APM tools, this has been the standard for many decades. With OpenTelemetry though, the term “agent” isn’t used as much, and in most scenarios means something slightly different.

Reduce alert noise, automate incident response and keep coding with AI-driven alerting

Noisy monitors can lead to alert fatigue, which frustrates engineers and hinders innovation. With our patent-pending anomaly detection capabilities built on the power of AI, you can eliminate 60-90% of alerts. A unique differentiator, Sumo Logic’s alerts can also trigger one or more playbooks to drive auto-diagnosis or remediation and accelerate time to recovery for application incidents. Faster issue remediation means engineers can focus more time on development and releasing software.

Conquering Data Lakes and Searching Google Cloud Storage Buckets With Cribl Search

What might you accomplish if you could easily search your data lakes without paying to move the data first? The most likely outcome is that you address a critical security incident quicker than ever, save your organization millions of dollars, get a promotion, and then go down in history as the best-looking, most talented analyst to have searched a storage bucket.

How to Detect & Troubleshoot Internet Brownouts

So, you've invested in a high-bandwidth Internet line for your business, complete with a service level agreement (SLA) ensuring consistent uptime. Sounds foolproof, right? Not quite. Despite meeting the SLA requirements for uptime, you might encounter performance issues severe enough to disrupt your cloud-based applications. Sure, technically, the connection is still up, but it's practically unusable. The frustrating part?

Progress Flowmon Monitoring for Kubernetes Applications

From the perspective of network administrator and operator, the fundamental requirements for network applications are the same regardless of the environment they are running in. They need to have their network communication fast, reliable and secure. To meet these requirements, we need to have relevant data about the application traffic.

eG Enterprise Monitoring Now Available on the IGEL App Portal

For several years, eG Innovations has been providing advanced AIOps-powered monitoring and observability to customers leveraging IGEL-powered devices in VDI and DaaS environments. Our out-of-the-box metric thresholds, alerting, dashboards, and reporting ensure IT teams can proactively avoid end-user support calls and tickets and ensure organizations get optimal performance from their IGEL investment. IGEL and eG Innovations recently announced the availability of eG Enterprise on the IGEL App Portal.

How to decide between cloud and on-premise monitoring

Application performance monitoring systems tend to be available in two modes: on-premise and cloud-based SaaS. Which is the “right” choice? Well, it depends on your situation, but overall cloud-based SaaS offerings have significant benefits when compared to on-premise. However, it’s not always so simple. The right selection depends on the facts on the ground.

IPAM and SPM: The missing piece for advanced network management

Phrases like “networks are the backbone of a business” are now ubiquitous, finding their way into many network-related blogs. We are not here to say the same thing again. Instead, we’re here to discuss managing your IP address space within OpManager. This blog explains how adding the IP address manager (IPAM) and switch port mapper (SPM) module within OpManager will enhance your monitoring game. Keep reading and we will tell you how to enable the add-on for free.

Server Health and Health Checks: A Beginner's Guide

Why do we go for server health checkups? Well, think of it like this: just as we schedule regular checkups for ourselves to make sure we're healthy and functioning optimally, our servers need the same level of care. After all, they're the backbone of our digital infrastructure, tirelessly handling requests, serving data, and keeping our applications running smoothly.

An OpenTelemetry backend in a Docker image: Introducing grafana/otel-lgtm

OpenTelemetry is a popular open source project to instrument, generate, collect, and export telemetry data, including metrics, logs, and traces. OTel, however, does not provide a monitoring backend — and this is exactly where the Grafana stack comes in. Here at Grafana Labs, we’re fully committed to the OpenTelemetry project and community.

Coralogix and observability at the edge

Observing Edge & WAF solutions is challenging. There are a host of unique problems to overcome, including security complexities and traffic intent identification. Let’s explore the complexities of observing edge data and how Coralogix’s revolutionary features take an entirely new approach to edge observability.

Four reasons to consider a new economic model for log management

Today's data and log analytics solutions are centered on the volume of data ingested. But as businesses continue to grow, the applications at the heart of that growth continue to increase in complexity. With modern applications, attempting to scale investments in observability and security by log volume isn’t possible, until now. Sumo Logic's VP of Product Marketing, Michael Cucchi, talks about some of the cost barriers associated with managing log analytics and the top four reasons to consider a modern unlimited ingest pricing model as part of your log management strategy.

Tale of the Tape: Data Historians vs Time Series Databases

It’s easy to pitch technology buying decisions as black or white, where one camp is the promised land and the other is a dystopian wasteland where companies and profits go to die. But that doesn’t match reality. Instead, organizations need to balance technical trade-offs with their needs. So, while it’s easy to stand atop the “rip and replace” mountain and shout the virtues of your new technology, that’s not something that most organizations are willing to do.

Top 8 Free Status Page Tools & Services for 2024

Your website is your digital storefront, and keeping it running smoothly is key to your success. This applies to your online reputation too. With the right tools, you can keep your audience in the loop about your site’s health and performance. To help you get started, we have put together a list of the top 9 free status page tools and services. These are essential not just for businesses, but for anyone looking to offer clear, consistent updates about their website’s uptime.

Schedule Cron Jobs in PHP

Automating tasks is important in web development. It saves time and lowers the risk of mistakes. Cron jobs in PHP are a good way to automate tasks on your server, like sending emails every day, making reports, or backing up databases. This article will show you how to schedule and manage cron jobs for different web development tasks using PHP. Whether you're new to cron jobs or want to improve your knowledge, this guide will help you automate server-side tasks with PHP efficiently.

Easy Guide to monitoring uWSGI Using Telegraf and MetricFire

It's important to monitor uWSGI instances to ensure their stability, performance, and availability, helping to identify and address issues promptly before they affect the overall application performance. Monitoring uWSGI instances also provides insights into resource utilization, request throughput, and potential bottlenecks, enabling proactive optimization and efficient scaling of the application infrastructure.

How personalized time zone notifications elevate the digital user experience

A status page without the ability to customize notifications based on individual user time zones poses significant challenges; for example, users may receive critical updates at inconvenient times, their workflow may be disrupted, or they may miss important information. This lack of visibility reduces overall user satisfaction and causes a n impact on business operations.

Your Roadmap to Identifying and Troubleshooting Network Brownouts

Imagine walking with a couple of small stones in your shoe. At first, you might barely notice them, tolerating the discomfort for a minute or two. But as time passes, the discomfort grows, and eventually, you realize that if you don't remove those stones, you won't be able to walk the next day.

Top 14 Synthetic Network Monitoring Tools: Unleashing the Power of Digital Guardians

As organizations increasingly depend on flawless network performance in today's linked world, it is critical to make sure networks are operating smoothly. Network monitoring tools act as digital guardians, keeping a watchful eye on the intricate web of connections and ensuring optimal performance. Among these tools, synthetic network monitoring tools stand out as powerful allies, capable of proactively simulating and detecting network issues before they escalate into a full-blown crisis.

Analyzing OpenTelemetry apps with Elastic AI Assistant and APM

OpenTelemetry is rapidly becoming the most expansive project within the Cloud Native Computing Foundation (CNCF), boasting as many commits as Kubernetes and garnering widespread support from customers. Numerous companies are adopting OpenTelemetry and integrating it into their applications. Elastic® offers detailed guides on implementing OpenTelemetry for applications. However, like many applications, pinpointing and resolving issues can be time-consuming.

RIP Xamarin: Adding .NET MAUI to Real User Monitoring

We’re constantly seeing frameworks evolving and churning, and in May 2024 we’ll see the end of Xamarin after 12 years. The deprecation of Xamarin means we need to ensure that MAUI is equipped with the tools and functionalities that developers have come to rely on Xamarin for. At Raygun, that’s Real User Monitoring (RUM).

Effective Monitoring for VPN Gateways

As the use of VPNs (Virtual Private Networks) becomes increasingly prevalent, ensuring their efficient, speedy, and reliable performance is crucial. Synthetic monitoring allows organizations to create simulated scenarios to evaluate and measure VPN performance, enabling them to optimize user experience and troubleshoot any issues that may arise. Exoprise provides a suite of products which work together for highly effective VPN performance gains.

System Hardening: Why the Need to Strengthen System Cybersecurity

Today, digital trust is required inside and outside the organization, so tools must be implemented, with cybersecurity methods and best practices in each layer of your systems and their infrastructure: applications, operating systems, users, both on-premise and in the cloud. This is what we call System Hardening an essential practice that lays the foundation for a safe IT infrastructure.

Integration roundup: Monitoring your container-native technologies

Container-native technologies increase the scalability and speed of deployment offered by containerized infrastructure, but they also present new monitoring challenges for organizations that adopt them. For example, because containers are ephemeral and share resources, tracking resource provisioning in container-native tools is essential to ensure consistent application performance.

Analyze multiple user journeys with the Datadog Sankey visualization

Funnels can be powerful tools for analyzing your UX, but figuring out exactly which user journeys you want to study can be challenging. Even if you have an ideal journey in mind, users often take steps you don’t expect. As a result, your funnels—and therefore, your optimization efforts—can easily miss the most influential pages in your application. Indeed, how do you build the best possible funnel when there are thousands of paths users can take after any given page?

Enhancing IT Operations: Exploring End-to-End Observability

Organizations like yours are increasingly reliant on complex IT infrastructures to support their operations. Pervasive use of Kubernetes and microservices architectures continues to up the ante. Amidst this complexity, achieving comprehensive visibility into systems and applications has become both imperative for ensuring performance, reliability, and security, while also becoming ever-more challenging to achieve.

Proactive Insights: How to Go from Reacting to Preventing Network Issues

If you’re an IT or network operations leader, consider the following questions: Network operators know how frustrating it can be to constantly contend with pressing network issues and outages. These team members spend copious amounts of time putting out fires, rather than focusing on efforts like making plans to optimize the network. These teams have to deal with high volumes of false alarms as well real incidents that affect network performance and availability and the user experience.

Focused Labs & Honeycomb: Better Together

We're excited to unveil a new collaboration with Focused Labs, a leap forward in our shared commitment to advancing modern observability practices and enhancing the robustness of legacy systems. This partnership is not just about scaling our service offerings but also about integrating Focused Labs' deep engineering expertise with our observability platform to deliver unparalleled customer experiences.

5 key takeaways from the Grafana Labs' 2024 Observability Survey

Regardless of the industry they operate in or the number of people they employ, businesses with mature observability practices can respond to incidents faster — and save time and money in the process, according to the second annual Grafana Labs Observability Survey. Organizations are making observability a critical part of their software development lifecycles as they grapple with the complexity of modern applications.

Signs You Are Suffering From Alert Fatigue

In an IT environment with multiple alerting channels and notifications, it is easy to become overwhelmed and desensitized to alerts. This tendency to avoid or respond negatively to incoming alerts is alert fatigue. Alert fatigue is a crucial issue in IT teams, with the sheer volume of alerts generated by modern IT systems. You might prioritize the first five alerts you receive in a workday. Maybe even up to the tenth alert. But is the twentieth alert as important?

The cost of inaction: A CIO's primer on why investing in Internet Performance Monitoring can't wait

When John Wanamaker famously declared, “When a customer enters my store, forget me. He is king,” he unknowingly coined a mantra that remains as relevant today as it was in the 1900s. This philosophy, rooted in the customer service ideologies of his time, holds true not just for brick-and-mortar stores but also for eCommerce.

SolarWinds Observability helps you troubleshoot faster with New Log Patterns feature

SolarWinds® Observability now brings more intelligence to issue identification to help you troubleshoot smarter and faster. When an entity alert is triggered, Log Patterns automates an AIOps / ML-based analysis of events surrounding the triggering event. Using Log Patterns, you can skip the hours spent manually scrolling through event messages looking for unusual or significant patterns.

The Value Hosted Graphite brings to the Heroku Marketplace

Hosted Graphite is a time-series metrics monitoring tool used for application, systems, infrastructure and network monitoring. HostedGraphite is a Hosted Graphite service that offers the full capabilities and benefits of Graphite, without any of the hassle of trying to set up your own open-source Graphite installation.

How to Monitor ClickHouse With Telegraf and MetricFire

Monitoring your ClickHouse database is a proactive measure that helps maintain its health and ensure that it continues to meet the needs of your applications and users efficiently. It allows you to address issues before they become critical, ensuring that your database environment is secure, reliable, and performing optimally. In this article, we'll detail how to use the Telegraf agent to collect performance metrics from your ClickHouse clusters, and forward them to a datasource.

Improving your on-call schedule with runbooks

Incidents are a stressful time for your team: your service isn't working the way you expect and your customers/stakeholders want to know what's going on. The last thing you want to do is let your team improvise everything when it comes to responding to incidents. Google's own SRE book has great overall tips for incident management, part of which involves "develop(ing) and document(ing) your incident management procedures in advance", which this article dives into.

Evolving Corporate Sustainability Solutions: An Interview with Sebastien Duprez & Nina Zellweger

As the world continues to feel the pressure of climate change, more and more actors in the private sector are implementing solutions to reduce their carbon emissions and slow down global warming. For many organizations, technology is a major focus in their carbon reduction strategy. And most emissions are linked to digital workplace equipment. In fact, the workplace represents 70% of overall IT-related emissions.

Schedule Cron Jobs in Node.js with Node-Cron

Cron jobs are tasks set to run by themselves at certain times or intervals. They help with doing repetitive tasks automatically, like backing up data, sending emails, and updating systems. In Node.js, cron jobs can make tasks in applications run by themselves, making things more efficient and reliable. Node.js gives a good way to set these tasks through different libraries and tools.

OpenTelemetry and Elastic: Working together to establish continuous profiling for the community

Profiling is emerging as a core pillar of observability, aptly dubbed the fourth pillar, with the OpenTelemetry (OTel) project leading this essential development. This blog post dives into the recent advancements in profiling within OTel and how Elastic® is actively contributing toward it. At Elastic, we’re big believers in and contributors to the OpenTelemetry project.

Instrumenting Lumigo for Python using OpenTelemetry

Standardized frameworks play a fundamental role in leveling the playing field and setting the standard within the tech industry, ensuring that everyone has access to the same tools and practices. These frameworks promote best practices and foster innovation and collaboration across different sectors. One example of such a framework is OpenTelemetry, a project that has rapidly gained traction and continued to flourish as an open-source initiative under the Cloud Native Computing Foundation (CNCF).

Part 3: Infrastructure Monitoring Tools

From networking and servers to databases and applications, the infrastructure is the backbone of an organization's operations. With the rise of digitalization, the need for reliable and efficient infrastructure has become more important than ever. Whether it be transportation systems, communication networks, or energy grids, infrastructure plays a vital role in keeping our society functioning smoothly.

APM Metrics: The Ultimate Guide

How your software applications perform is an extremely important factor in determining end-user satisfaction. APM metrics are the key indicators that help business-critical applications achieve peak performance. This article explains APM metrics, their importance, and the core APM metrics used by modern software systems to measure and optimize the performance of their applications.

Scalability in IT: The Complete Guide To Scaling

Somewhere in the IT multiverse, a perfect balance has been achieved between demand for IT services and installed system capacity. Unfortunately, that isn’t our world. IT systems operate in swing periods of idle capacity and overloads, as the ebb and flow of demand is influenced by various internal and external factors.

NetOps Expert ep 11:Top 5 Ways to Troubleshoot Issues in Modern Networks

In this latest episode of the NetOps Expert, Nestor Falcon, from the NetOps by Broadcom product team, explains how to troubleshoot issues in modern networks in five easy steps. He will walk us through examples of how a network operations team can use DX NetOps by Broadcom to determine the root cause of a network degradation issue that affected users accessing a cloud application.

NetOps Expert ep 12: AI/ML and NetOps - A Conversation with EMA

In this episode, I talk to Shamus McGillicuddy, VP of Research at EMA about how IT organizations are improving network management with intelligent systems based on artificial intelligence (AI) and machine learning (ML). Sometimes known as AIOps, these AI/ML technologies are helping organizations optimize their networks, streamline operations, and reduce security risk. We break down his research and get to real use cases that network teams can utilize today.

Why it's critical to monitor websites from multiple global locations

multiple global locations One of the primary considerations when organizations search for a website monitoring solution is whether the solution can monitor websites from various locations. This feature not only aids in comprehending the availability and performance of their website across multiple global locations but also provides insight into the worldwide end-user experience of their website.

AI Pipeline: Surfing from Concept to Product Reality - SolarWinds TechPod 084

In this conversation, hosts Sean Sebring and Chrystal Taylor talk with Derek Daly, Principal AIOps Product Manager at SolarWinds. He discusses his career journey and the role of AI and machine learning in the company's products. He shares insights into the process of introducing AI and machine learning into product features, the impact of AI on jobs, and the considerations for on-premises vs cloud deployment.

Introduction to AWS Observability in Grafana Cloud | Grafana

Grafana Cloud's streamlined approach to collecting and configuring your AWS data makes it easier to manage your cloud environment and improve performance. ☁️ Grafana Cloud is the easiest way to get started with Grafana dashboards, metrics, logs, and traces. Our forever-free tier includes access to 10k metrics, 50GB logs, 50GB traces and more. We also have plans for every use case.

Does Your Network Monitoring System Support Streaming Telemetry?

Are you frustrated that your current network monitoring solution still doesn't support streaming telemetry? Kentik supports both SNMP and streaming, so you can monitor any device in your network with no visibility gaps. We make it simple for you to modernize your visibility strategy and take advantage of what streaming telemetry has to offer.

The Top 29 PRTG Alternatives of 2024 (Open-Source, Enterprise, Performance Monitoring, and More!)

Had enough of wading through alternative listings that leave you scratching your head? We feel your frustration! It's downright exasperating when recommendations are based solely on review counts, random algorithms, or pay-per-click arrangements. We've all seen it: a behemoth software editor inexplicably crowned as the top alternative to a network performance monitoring software, even though they have absolutely no shared features. It just doesn't add up!

Integrating Accessibility Checks in Playwright Tests with Checkly

Ensuring your web application is accessible is not just about compliance; it's about inclusivity. Tools like Google Chrome's Lighthouse provide a starting point for accessibility checks. but integrating these checks into your development workflow can significantly enhance the quality of your product. This post explores how to perform automated accessibility checks using Playwright and Checkly, leveraging the power of the axe-core library.

Building Resilient Foundations: System Design Strategies for Robust Website Monitoring

In the vast expanse of today's digital landscape, where websites serve as the cornerstone of business and communication, the importance of website monitoring cannot be overstated. As the internet becomes increasingly integral to our daily lives, ensuring that websites are functioning optimally, securely, and reliably is paramount. The complexity of web systems has grown exponentially, driven by advances in technology and the demands of users for faster, more secure, and continuously available services.

OpenTelemetry Collector - A Beginner's Guide

In the fast-pace world of technology, keeping an eye on how well our applications are doing is crucial. Indeed, opentelemetry offers a comprehensive framework designed to capture the nuances of software applications. At the core of this framework lies the opentelemetry Collector, responsible for aggregating, processing, and exporting telemetry data. Why is this important?

The Top 10 IoT Monitoring Tools

IoT (Internet of Things) is the overarching term used to describe the extensive network of devices connected to the Internet. This term covers a broad range of objects or ‘things’ from consumer technology such as smart home lighting to crop management in agriculture. IoT allows everyday devices to effectively connect and exchange data with one another.

How IT monitoring software and AIOps drive efficiency

Embracing digital transformation means increasing your reliance on a variety of IT systems, applications, and networks. Organizations are adopting advanced solutions like IT monitoring software and Artificial Intelligence for IT Operations (AIOps) to manage this complexity. These tools provide real-time insights into IT ecosystem health and performance, using AI and machine learning to support proactive decision-making and automation.

Best Blockchain Monitoring Practices for 2024

In the volatile world of blockchain technology and cryptocurrencies, even a downtime of just a few minutes can mean a significant loss of earnings for you as a chain validator. In this article, we aim to examine the best practices for monitoring your nodes and demon apps. A reliable uptime monitoring service helps to improve the stability of the whole blockchain and minimizes losses that can occur during unexpected downtimes.

How AIOps Helps Federal Agencies Combat IT Technical Debt

When it comes to federal IT modernization, technical debt presents a catch-22. CIOs, IT administrators, and developers know they must modernize their legacy infrastructures to whittle down their technical debt. However, modernization necessitates the need to purchase new solutions, which can end up adding to the technical debt load and create an even more complex IT landscape.

How to use PGO and Grafana Pyroscope to optimize Go applications

Profile-guided optimization (PGO) is a compiler feature that uses runtime profiling data to optimize code. Now fully integrated in Go 1.21+, PGO is a powerful tool to boost application performance — and with Grafana Pyroscope, our open source continuous profiling database, you can significantly magnify the value of PGO. In this post, we’ll explore what PGO is, how the Pyroscope team has used it internally to improve performance, and how you can use PGO to make your own programs faster.

What is OpenTelemetry?

At observIQ, we are big believers and contributors to the OpenTelemetry project. In 2023, we noticed project awareness reached an all-time high as we attended trade shows like KubeCon and Monitorama. The project’s benefits of flexibility, performance, and vendor agnosticism have been making their rounds; we’ve seen a groundswell of customer interest.

Automating Azure Cloud Unit Economics Generation: The Turbo360 Advantage

The scalability of the cloud and its inherent variable cost has created financial and operational challenges, which demand the process of tracking varying costs in the dynamic Azure infrastructure at a granular business context level. Unit economics is a process of profit maximization in the cloud based on objective measurements like cost per product. This approach assesses how the organization is performing against its business goals.

How to build the ideal engineering team dashboard

Toggle topic hub menu Engineering teams of today use a plethora of tools to perform different functions in the software development life cycle. While tools like Slack, Teams, etc. are great for quick notifications, they rarely give you a comprehensive view of the things in current state. Sure, you can switch between tabs for all your tools but an "Engineering dashboard" that brings this all together makes it much easier to consume quickly and effectively.

Evidence-Based Threat Detection With Corelight and Cribl

Organizations today face a growing list of obstacles as they try to improve their detection, coverage, and accuracy. For one, data proliferation is happening at an astronomical rate. When was the last time your network bandwidth went down? What about your license costs for data storage or your SIEM? Difficulties arise from overlapping and poorly integrated tools that generate disparate data streams and several operational efficiencies.

What is INP and why you should care

On March 12th 2024, Google is launching a new Core Web Vital metric, Interaction to Next Paint (INP). INP will replace First Input Delay (FID) and will change the way your sites are assessed for performance by Google, which ultimately affects how your sites rank in search engine results. TL;DR: You need to start optimizing for INP today so your sites are not negatively impacted after March 12th.

How to Display Grafana Alerts to Your Dashboards | Grafana

💡 Did you know you can display Grafana alerts on your dashboards? Join Senior Developer Advocate Marie Cruz in this quick tutorial to learn how to configure a Grafana alert and link it to your dashboard and panel. ☁️ Grafana Cloud is the easiest way to get started with Grafana dashboards, metrics, logs, and traces.

Observe, Automate and Optimize | SolarWinds Day Virtual Event

You can’t manage what you can’t monitor and observe. IT ecosystem complexity is a part of operating in a hybrid multi-cloud, containerized microservices, digital transformation world, and the complexity is not magically going away. This virtual event shows how SolarWinds is solving what others can’t – abstracting the complexity, increasing visibility, and automating remediation across on-premises, hybrid, and cloud-native estates.

Easy Guide to Monitor Jenkins Jobs Using Telegraf and MetricFire

Monitoring Jenkins jobs and nodes is foundational to maintaining a robust, efficient, and secure CI/CD pipeline. It enables DevOps teams to stay proactive about system health, optimize performance, manage resources effectively, and adhere to security and compliance standards. In this article, we'll detail how to use the Telegraf agent to collect performance metrics from your Jenkins environment, and forward them to a datasource.

Application Troubleshooting with Automated Root Cause Analysis

In the complex and fast-paced world of application deployment, getting a handle on the tangle of services and resources can sometimes feel like trying to find your way through a maze without a map. And if something goes wrong, trying to find out what's happening where is even more difficult. With alert emails flooding in and questions flying left and right, identifying the glitch that's causing issues can seem like a Herculean feat.

What is MongoDB? Its Architecture and Monitoring

Ever wondered how popular websites manage millions of users and interactions without crashing? The answer lies in MongoDB, a NoSQL database, document-based model. This is particularly useful for applications like social media platforms, where users can have multiple posts, comments, and interactions. MongoDB is also highly scalable, able to handle large amounts of data and traffic by distributing the workload across multiple servers.

Site24x7 Alternatives - Best Alternatives To Site24x7 For Website Monitoring In 2024

Uptime monitoring is necessary for website owners and IT professionals to keep their websites available for users. Site24x7 offers an all-in-one monitoring for websites' availability, performance, and health. However, it may not meet every organization's needs. This article will review and find the best Site24x7 alternatives in 2024 for uptime monitoring, focusing on options that might better meet your requirements.

The ITOM Spotlight featuring Nutanix: Navigating the evolving infrastructure and operations landscape

In our recent ITOM Spotlight, experts from Nutanix and ManageEngine’s ITOM team delved into the transition of enterprises towards cloud platforms and hybrid solutions. They emphasized the crucial role of full-stack observability and AIOps in ensuring efficient IT management, and they covered the strategy for achieving comprehensive visibility into an enterprise’s stack through ManageEngine-Nutanix integration.

Optimizing SD-WAN Monitoring and MSP Team Productivity in Co-Managed Environments with Obkio's MSP Plan

At Obkio, our mission is to provide comprehensive network monitoring and troubleshooting solutions tailored specifically for MSPs (Managed Service Providers), ensuring the proper functioning of their networks and services for their clients. MSPs are a big part of our client base and we've had the chance to chat with numerous business owners and network admins to really get to the core of their needs. Why?

The Leading Observability Tools

Now, many teams are incorporating microservices architecture, with this trend only continuing. This allows them to employ their applications across distributed environments. Whilst this is advantageous as it makes it much simpler to build, scale, and deliver it can also become much more challenging to monitor and troubleshoot the components that make up the environment.

Three Ways to Gain End-to-End Network Coverage and Visibility

Network operations teams face many challenges in ensuring optimal network performance and availability in today's complex and dynamic environments. These teams need to monitor and manage multiple devices, technologies, and vendors, while contending with huge amounts of data and significant complexity. How can your teams get a clear and accurate picture of your network performance and health?

How to overcome Failover Cluster performance issues

In the final portion of our two-part blog on Failover Clusters, we'll utilize a helpful checklist to uncover resolutions for performance and cluster compromise issues, and explore practical solutions provided by MangeEngine Site24x7. Failover Clusters are advantageous when it comes to maintaining high-availability levels. But they do come with their set of challenges which we have already covered on our blog on the Failover Cluster performance issues.

Prometheus vs. Elasticsearch

In the field of data management, Prometheus and Elasticsearch are popular names. They have proved to be quite effective when coming to monitoring applications and websites and providing reliable feedback. While Prometheus offers metrics monitoring at a good level, Elastic Stack is a comprehensive platform offering complete collection, storage, and analysis of data from start to finish. This and a few other minor differences sets these two monitoring solutions apart.

A Guide to Log4j for Logging in Java

Log4j is a logging framework for Java, facilitating the systematic recording of runtime information in software applications. Developed by the Apache Software Foundation, Log4j has become a standard tool in Java development since its inception in 1996. Its primary purpose is to generate log messages that provide insights into the application's execution, aiding developers in debugging, monitoring, and analysing software behaviour.

Understanding FinOps: Principles, Tools, and Measuring Success

FinOps is a cultural practice that brings financial accountability to the world of cloud computing. It’s a strategic approach that aids organizations in understanding their cloud costs and making informed business decisions. FinOps is a new way of managing costs in an IT environment that is increasingly shifting towards the variable cost model of cloud services. It combines the best of the technical and financial worlds, resulting in an effective model for managing cloud costs.

Modernizing financial services: A deep dive into Elastic Cloud on AWS for Observability, Security, and more

In the dynamic landscape of financial services, data is not just currency; it's the key to innovation and operational excellence. Data is constantly streamlining from devices, logins, transfers, transactions, and much more, and it’s bound to increase with an ongoing reliance on digital channels. This creates a massive opportunity and responsibility for financial institutions, as their customers (and regulators) demand more from banking providers.

UptimeRobot Alternatives - Best Uptime Robot Alternatives for Uptime Monitoring in 2024

Looking for alternatives to UptimeRobot can help improve your website and service monitoring. Other platforms may offer different features, like a free plan or a free trial, so you can test them before choosing a paid plan. Monitoring your website's uptime is crucial for keeping your services reliable. Whether you need uptime checks with alerts or more advanced features like root cause analysis and response time tracking, there's a range of options available.

New in Playwright: detect and close unpredictable overlays with "addLocatorHandler"

Discover the latest feature of Playwright 1.42 — `page.addLocatorHandler`. If you're tired of randomly appearing cookie banners breaking your end-to-end tests or want to automatically close all these intercom widgets, this method is right up your alley. With `addLocatorHandler`, handling elements that randomly pop up becomes a breeze! In the video, we'll show you how the new Playwright method works in practice and why it makes end-to-end testing and synthetic monitoring so much easier.

Datadog on Data Science

In this episode we'll visit the world of predictive analytics and machine learning and uncover how these cutting-edge technologies are transforming the way Datadog monitors and improves its services. We’ll focus our conversation on two key aspects: using advanced statistical methods for proactive monitoring and the strategic implementation of machine learning for algorithm enhancement.

What is an API Gateway

When people bemoan the complexity of interconnected IT environments, they usually mean that an organization has a lot of applications that all share data with each other. As your organization adds more applications, you need to make sure that they securely share data with each other. In short, security and development teams find themselves working to deploy and protect the Application Programming Interfaces (APIs) that enable applications to talk to each other.

Two-Factor Authentication Enforcement Now Available On All AppSignal Plans

We recently announced AppSignal Business Add-Ons, our alternative to pricy enterprise plans. The add-ons offered HIPAA BAA, Long-Term Log Storage, and Two-Factor Authentication Enforcement for an additional fee. However, after listening to feedback from our customers, we decided that Two-Factor Authentication Enforcement is a core feature that should be available to all organizations on all plans for free.

Automate status updates with monitoring tools

Offering users proactive and timely updates during downtime events is the key to effective incident management. However, imagine a status page that lacks integration with a monitoring tool. T he challenges become apparent with the need for manual intervention with every update. Without the efficiency and reliability offered by automation, you may struggle to provide users with timely updates, which can increase their frustration.

Microsoft Defender Endpoint Logs and Cribl Stream - Quick Start Guide

Microsoft Defender offers everyone comprehensive threat prevention, detection, and response capabilities—from individuals looking to protect their families to the world’s largest enterprises. Microsoft Defender allows IT and Security teams to prevent, detect, and respond to attacks across devices, identities, apps, email, data, workloads, and clouds. Have you ever wondered if you can use Cribl Stream to help manage your Microsoft Defender for Endpoint logs? The answer is Yes (plus benefits)!

Docker Logging: Effective Strategies for Docker Log Management

Docker is a platform that makes creating, deploying, and running containerized applications easier. Containerization is a lightweight and portable application deployment technique involving packaging an application and its dependencies inside a container. A container is a standalone, executable software package that includes everything needed to run a piece of software, including the code, runtime, system tools, libraries, and settings.

Dissecting MySQL Debugging with Node and Python - Part 2

In Part 1 of this blog, we prepared our demo container environments using Docker for the Node Express and Python Flask applications. Now, we move on to the more complex phase of our exploration, where we will dissect and explain the inner workings of our applications. This sequel is designed for those who want to improve their web development skills, offering a comprehensive guide to debugging and tracing.

What are Network KPIs, Why Should You Care? 16 Metrics/KPIs to Chase

A network key performance indicator (KPI) is a measurement and a benchmark to achieve optimal network performance goals. To support these goals, measuring actual performance against the KPI goals helps the network team make decisions to improve and sustain network performance and service levels and meet the KPI objective.

OpenTelemetry Best Practices #1: Naming

Naming things, and specifically consistently naming things, is still one of the most useful pieces of work you can do in telemetry. It’s often overlooked as something that will just happen naturally and won’t cause too much of an issue—but it doesn’t happen naturally, it does cause issues, and you end up having to fix the data in pipelines or your backend tool.

What happens when you can afford to ingest all your log data?

Sit down with Joe Kim, Sumo Logic's CEO, and Michael Cucchi, VP of Product Marketing, for a fireside chat (minus the fire) about Sumo Logic's new flex licensing plan. They'll discuss how removing the cost of ingesting log data across an enterprise: Tune in for a 20-minute chat about what happens when you can finally log everything with $0 ingest.

Introducing Honeybadger Insights

I'm pleased to announce a new feature that we've been building for over a year: Honeybadger Insights. Insights is our take on logging and performance monitoring, helping application developers gain deeper visibility into what's happening with their applications. It goes beyond application monitoring and responding to exceptions and downtime. Insights lets you drill down into the details and step back to see patterns in your data.

Network Monitoring for Education Institutions and Universities: Ensuring Network Connectivity in Schools

As networks of educational institutions continue to get more complex, so does the demand for robust network monitoring and security measures. Without a secure and optimized network, student records become vulnerable to hacking, bandwidth congestion disrupts essential services, and online assignments remain unfinished. When lesson plans heavily rely on video-conferencing for seamless education delivery, the margin for errors or outages is slim.

The Ultimate Guide to API Monitoring in 2024 - Metrics, Tools, and Proven Practices

According to Akamai, 83% of web traffic is through APIs. Microservices, servers, and clients constantly communicate to exchange information. Even the Google search you made to reach this article involved your browser client calling Google APIs. Given APIs govern the internet, businesses rely on them heavily. API health is directly proportional to business prosperity. This article covers everything about API monitoring, so your API infrastructure’s health is always in check ✅.

TCP/IP: What It Is & How It Works

Network protocols are necessary for data transmission and networking over different devices. One of the most common protocols is the TCP/IP framework, which builds connections through our internet. In fact, if you check email, watch Netflix, or stream music from Spotify, you’re relying on TCP/IP in the background. In this article, you’ll learn about the TCP/IP protocol layers and how they function.

How we improved ingester load balancing in Grafana Mimir with spread-minimizing tokens

Grafana Mimir is our open source, horizontally scalable, multi-tenant time series database, which allows us to ingest beyond 1 billion active series. Mimir ingesters use consistent hashing, a distributed hashing technique for data replication. This technique guarantees a minimal number of relocation of time series between available ingesters when some ingesters are added or removed from the system.

Significance of Infrastructure Monitoring into Your Business Operations

In the initial stage of the digital era, only a few businesses were using digital tools and technologies to enhance their performance and efficiency. But now, things have changed and almost 90% of businesses use top-rated technologies to stand out from their competitors. In fact, some of them rely heavily on robust IT infrastructure for seamless delivery of quality service and applications. As a result, infrastructure is becoming more complex and open to threats.
Sponsored Post

Beyond reviews & ratings : Users perspective driven infographic on ManageEngine's ITOM solutions

ManageEngine offers a number of IT operations management (ITOM) solutions designed to streamline and enhance the management of IT services within organizations. Advanced capabilities, like enhanced full-stack observability, enterprise management, robust security and compliance, and tailored support for MSP ITOps, make ManageEngine's ITOM solutions adaptive for modern IT environments.

An Introduction to Microservices Monitoring-Strategies, Tools, and Key Concepts

Users have higher expectations than ever when it comes to performance and reliability in the apps they use every day. A critical part of meeting these expectations is having a robust monitoring system in place. This article focuses on monitoring applications using a microservice architecture—it will go over key concepts, common challenges, and useful tools every engineer should know.

Emerging trends in observability: GAI, AIOps, tools consolidation, and OpenTelemetry

See the results of our 2024 survey of over 500 observability decision-makers to find out where the industry is headed As technology evolution continues at its rapid pace, so does observability. Observability is becoming critical to driving positive business outcomes, and we wanted to understand how users are evaluating trends and their impact over the coming years.

Recent Outage of Meta and Google Ads: How to Prevent Potential Loses

On Tuesday, March 5th, Facebook, Instagram and Google Ads experienced widespread outages that lasted for nearly two hours, affecting thousands of users worldwide. More than 550,000 reports poured in from Facebook users, and Instagram received 92,000 similar complaints, as reported by Reuters. As Meta stated on their newest platform, Threads: ”Earlier today, a technical issue caused people to have difficulty accessing some of our services.

Dissecting MySQL Debugging with Node and Python - Part1

This is the first post in a series of two looking at debugging and tracing MySQL, which has been a foundation stone of the tech industry, utilized by applications big and small, from personal blogs to complex e-commerce platforms. MySQL has demonstrated adaptability and robustness countless times, making it a critical part of the Internet’s infrastructure. This adaptability has helped MySQL remain relevant amidst the constantly evolving technological landscapes.

New Streamlined Plan Structure

As the landscape of real-time monitoring evolves, so does the diversity and complexity of use cases that our community brings to Netdata. Our mission has always been to democratize monitoring by making it accessible, powerful, and scalable for everyone. With the rapid growth of our user base and their expanding needs, it's become clear that our plan structure must evolve to maintain this mission sustainably.

Alternatives to Pingdom - 16 Best Pingdom Alternatives in 2024 for Website Monitoring

In today's digital world, how fast a website works is very important for any business. If a website loads slowly, is often not available, or has errors, it can make users unhappy, lower its visibility on search engines, and affect profits. As we enter 2024, many people are looking for better tools to check their websites. They are thinking about other options besides the popular Pingdom. They want tools that provide more benefits, are more cost-effective, or both.

Driving Culture Change: Phorest's Observability Transformation

Phorest wanted a tool to help foster a culture of observability among the engineers at an affordable and predictable price. With their application stack hosted on AWS, Phorest delivers a premier software solution that empowers their salon and spa business customers to thrive. Ensuring every engineer has access to an observability tool is integral to the company's success model, enabling them to deliver great code for their designated software services.

Grafana 10.4 release: Grafana Alerting improvements, visualization updates, new plugin, and more

Grafana 10.4 is here! The latest version of Grafana introduces feature updates, a new plugin, as well as provides a preview of functionality we intend to make generally available in Grafana 11, which will be featured at GrafanaCON 2024 in April. Download Grafana 10.4 Until then, the Grafana 10.4 release includes upgrades to the canvas, geomap, and table visualizations. There is also a quicker way to set up alert notifications in Grafana Alerting and a new UI for configuring SSO.

Reduce context switching while troubleshooting with Datadog's IDE plugins

Visibility into the production performance of code iterations helps developers verify that application releases and updates are working as intended. However, when variables such as large-scale user requests and increased server load create issues that were absent during testing, developers will often need to pivot from investigating production data back to their coding environment to address errors and vulnerabilities.

Introducing Self-Serve Configuration Options for OAuth in 10.4 (UI, Terraform & Via API) | Grafana

Grafana 10.4 introduces self-serve configuration options for OAuth, to make setting up SSO for your Grafana instance simple and fast. All of the currently supported OAuth providers are now available for configuration through the Grafana UI, Terraform, and via the API. In this video, we show you how to configure Oauth in Grafana’s UI. ☁️ Grafana Cloud is the easiest way to get started with Grafana dashboards, metrics, logs, and traces. Our forever-free tier includes access to 10k metrics, 50GB logs, 50GB traces and more. We also have plans for every use case.

Apache Spark at Scale #datadog #shorts #security #observability

Datadog is an observability and security platform that ingests and processes tens of trillions of data points per day, coming from more than 22,000 customers. Processing that amount of data in a reasonable time stretches the limits of well known data engines like Apache Spark. In addition to scale, Datadog infrastructure is multi-cloud on Kubernetes and the data engineering platform is used by different engineering teams, so having a good set of abstractions to make running Spark jobs easier is critical.

Best Method to Monitor Your ELK Stack Using Telegraf and MetricFire

The ELK stack, which stands for Elasticsearch, Logstash, and Kibana, is a powerful suite of tools used for searching, analyzing, and visualizing log data in real time. Within a software company's infrastructure, this stack can be utilized in several key areas to improve operational efficiency, debug issues, and gain insights into user behavior. The ELK stack provides a centralized platform for aggregating logs from various sources.

Cisco AppDynamics for SAP in Healthcare: an analysis of challenges and solutions

In this video, Matt Schuetze delves into the role of Cisco AppDynamics for SAP in addressing the challenges in healthcare, biotech, and life sciences, including security, privacy, cost management, and the critical nature of patient-facing applications—as well as managing diverse systems across individual medical practices, electronic medical records (EMR), and SAP ERP systems. With App Dynamics, transactions can be tagged, traced, and followed, ensuring sustained connectivity and security in the SAP environment.

Case Study: SaaS Co. Boosts Developer Productivity and Saves 45% on Datadog Costs

Saas Software is immensely popular because it allows customers to get the latest enhancements and feature upgrades faster without having to install updates or migrate to newer software versions. That’s why a Major SaaS Software Development company was so eager to improve their developer productivity to deliver software faster and more reliably.

20+ Examples of Best Public Status Pages of Top Online Brands

Status pages have evolved significantly since their inception. They are no longer mere indicators; instead, they serve as critical communication channels for companies embracing transparency. If you’re running a SaaS (Software as a Service) business, having a public status page is essential. Here’s why.

Log it all and eliminate visibility gaps

Doing security and observability by budget sucks. Choosing where to limit your visibility and deciding which logs and data you may need before you actually need them is backward logic in today’s AI-driven world. The plain reality is that log management and analytics shouldn’t be based only on what you can afford to ingest.

Streamline Incident Analysis in QRadar by Using the Progress Flowmon QRadar Application

Flowmon QRadar integration provides a single pane of glass to detect and respond to Flowmon ADS events directly in IBM QRadar. The integration packages were updated to support the latest version of Flowmon products and the IBM QRadar platform. Security Information and Event Management (SIEM) systems are considered foundational elements in a company's security toolkit.

How to visualize SurrealDB data with Grafana

Whether your data is on the moon or in your basement, Grafana has got you covered. As the go-to platform for monitoring and observability, Grafana has been your trusty sidekick for data visualization for years, in part because we’re always looking for new ways to support our users, no matter where they keep their data. That’s why we’re excited to tell you about our latest supported data source — SurrealDB.

How to make a chatbot: Dos and don'ts for developers in an AI-driven world

Every day the world is becoming increasingly powered by artificial intelligence. In fact, you’d struggle to find tech companies that have not announced AI integrations into their tech stack in one way or another. Cynics might say this is a passing phase, but the reason AI is so popular is that it’s a versatile set of capabilities that can help solve a lot of problems.

How to Collect IoT Data Through Cribl Stream and Cribl Search

Cribl’s suite of products excel at collecting and organizing your IT and security event data. Did you know it can also help with IoT data collection and analysis? If you can get the text of the data into Cribl, in most cases, we can process it, transform it, and send it to where you want it to go. A few years ago, I bought a weather station. I immediately hooked up some home automation gear to show me the temperature, humidity, and air quality. But the geek in me wants more.

What's New at Kentik, Episode 4

Kenik NMS and AI are the big news this month! Join Leon Adato as he unveils the groundbreaking Kentik NMS (Network Monitoring System) and Kentik AI, designed to enhance network observability with advanced metrics and intelligent, natural language query capabilities. This episode introduces these powerful tools and shares insights into their significance in modern network monitoring. Discover how Kentik is redefining network management with these innovations, promising "phenomenal cosmic power" to IT professionals!

Beyond APM: What Datadog Won't Tell You with Leon Adato of Kentik

APM tools promise a unified observability platform, yet they inherently focus on internal metrics, traces, and logs. This internal focus, while valuable, misses critical dimensions of the user experience and network performance that are essential for a complete understanding of application behavior in real-world scenarios. With Kentik you can dive deep into your network performance and find problems before they affect your users.

Understanding Failover Clusters and their performance issues

In part 1 of this two-part blog about utilizing Failover Clusters in your network to improve performance and availability, we'll uncover how they work, why they are popular for large-scale organizations, and discuss several of the most common issues with them. In part 2, we'll discover the best troubleshooting strategies to address Failover Cluster performance issues, and we'll review a helpful checklist that streamlines the process for fixing these issues.

Scaling success: Navigating the challenges of autoscaled applications with Site24x7 APM Insight

Have you ever found yourself wishing for a magical solution to handle the unpredictable ebb and flow of user traffic on your cloud-hosted platforms? Organizations today face the ever-present challenge of effectively managing fluctuating levels of traffic on their platforms. Enter application autoscaling, a concept in modern resource management that allows organizations to seamlessly adjust their resources in response to spikes or lulls in user activity. But what exactly is autoscaling?

The Role of APM in DevOps and SRE Practices

As the software development world becomes faster, enterprises must adapt to customer demands by increasing their application’s deployment frequency. They often rely on DevOps and Site Reliability Engineering (SRE) methodologies to achieve this. These approaches ensure high system availability amidst frequent deployments and prioritize delivering a seamless user experience.

Accelerate AIOps with Hollywood's Human-Friendly AI Insights

AI has emerged as a major inflection point in the technology industry, driving providers to rush to introduce AI-enhanced products and services. The remarkable momentum surrounding AI, fueled by its perceived value and excitement, is evident, with businesses reporting an average return on investment of 3.5 times or 250%, according to IDC. Consequently, it comes as no surprise that IDC anticipates a shift in IT spending toward AI.

Mastering FinOps: The 7 Essential KPIs

Navigating the complexities of cloud financial management requires more than just tracking costs – it demands a strategic approach to measure and optimize cloud spend. We have put together our top 7 KPIs, ranging from allocatable cloud spend and average hourly costs to sophisticated forecasting, to effectively gauge your FinOps solution success. Each KPI offers unique insights, helping businesses manage and maximize their cloud investments.

Creating visualizations with Grafana | Grafana for Beginners Ep. 9

Creating visualizations is one of the most effective ways to understand your data. Join Senior Developer Advocate, Lisa Jung to learn how to create gauge, time series line graph, stats, logs, and node graph visualizations using Grafana. The following are covered in this episode: ☁️ Grafana Cloud is the easiest way to get started with metrics, logs, traces, dashboards, and more. We have a generous forever-free tier and plans for every use case.

Best Method to Monitor Kibana Using Telegraf and MetricFire

Monitoring Kibana instances is crucial to ensure optimal performance, identify potential bottlenecks, and promptly address issues that may impact the accessibility and functionality of the platform. Regular monitoring allows for proactive maintenance, enabling organizations to deliver a seamless and responsive user experience while ensuring the stability and reliability of their ELK stack.

Understanding User-Centric Metrics in Digital Experience Monitoring (DEM)

User experience holds the utmost importance, and closely monitoring the digital experience from the user's standpoint is essential for achieving success. User-centric metrics offer invaluable insights into how users interact with digital platforms and enables businesses to optimize performance, enhance satisfaction, and drive growth. In this blog, we'll delve into the significance of user-centric metrics in digital experience monitoring and explore the key metrics that businesses should prioritize.

IT Ticketing System: A Comprehensive Guide

Over the years, the global pandemic has brought about significant shifts in our lives and business, especially in the IT sector. Since the pandemic, many organizations have moved to working remotely and leveraging technology for most operations. In places where it has been a great benefit, remote operations have also been challenging for organizations as managing and tracking IT-related issues from different locations was never simple.

New Slack app is now in Beta

We’re excited to announce our new Slack app, now available in beta with awesome features including an in-app status page, reporting and upvoting issues, improved status checks, notifications, and more. Let’s review main improvements: 1. Notifications: Receive instant notifications in your selected Slack channels, ensuring timely awareness of service incidents. 2. Check Service Status: Access real-time status updates for any connected service or website directly from Slack 3.
Sponsored Post

How to improve INP (the newest Core Web Vital)

From the first introduction of Core Web Vitals, Google has maintained that these user experience metrics will keep evolving. Since 2022, the Google team has been testing Interaction to Next Paint (INP), a new interactivity metric, and asking for feedback from the development community. Late in 2023, they announced that INP would replace FID as a Core Web Vital. The transition to INP is effective from March 2024.

Achieve a positive digital end user experience with proactive website monitoring

In the modern era of technology, customers have high expectations for websites to be quick, dependable, and user-friendly. As the virtual representation of a company, a website plays a vital role in its success, making it essential for businesses to prioritize its efficient operation and top-notch performance. Any instances of downtime or sluggish loading speeds can result in end user frustration and a negative impression of the company. To guarantee a seamless and satisfactory experience for users visiting your site, it is crucial to have a strong website monitoring solution in place.

Applications Manager extends support for Azure network management and delivery monitoring services

Applications Manager provides out-of-the box support for Azure Network management and Delivery monitoring by enabling you to obtain in-depth visibility into the performance of your network management and content delivery resources in real-time. It serves as a single pane of glass to keep a close watch on network management resources hosted on Azure by providing monitoring support for the following services.

Applications Manager provides out-of-the-box support for Azure network infrastructure management services.

Applications Manager offers monitoring support for a wide range of Azure services that can help you to track your network resource performance in real-time. It enables DevOps admins to keep a close watch on their Network Infrastructure resources hosted on Azure by offering monitoring support for the following services.

Grafana vs Splunk - Key Features and Differences

Grafana and Splunk are both used as monitoring tools. But while Grafana is majorly used as a data visualization tool, Splunk is an enterprise security and observability platform. Monitoring tools are essential for any business that wants to have visibility into its IT infrastructure. They provide real-time data that can be used to identify and troubleshoot problems. Grafana and Splunk are two of the most popular monitoring tools on the market. So, which one is better for your business?

Compare Tests In RapidSpike

Last year we released the “Failure Analysis” dashboard to allow you to compare a failing result with the latest successful one. The feedback was universally positive: users loved being able to compare tests! So we have now released a full comparison tool to allow you to compare any two User Journey or Page Load test results on your website(s). Website test comparison can be useful for analysing and testing website changes.

SEO monitoring trends to watch in 2024

2023 was a landmark year in SEO, and not for entirely positive reasons. After the emergence of OpenAI and ChatGPT and the realization that AI-powered search was the future focus of major search players like Google and Microsoft, SEO monitoring professionals were rightly thrown into an uncertain landscape. Would traditional search, and all of its standard practices and strategies, disappear within months? What about the ideas of “content is king” and the importance of link-building?

8 Kubernetes application performance monitoring challenges and how to solve them

Kubernetes is a widely-adopted platform that manages the containers that host an application. Instead of handling nodes and containers individually, it groups all workloads as orchestrated layers. This abstraction simplifies the overall complexities involved, making the application easier to manage.

Launch Week, Upgrades to Metrics & Query Builder & Access Token Management - SigNal 34

Welcome to the 34th edition of our monthly product newsletter - SigNal 34! Last month was full of action. We did our first launch week, and we were thrilled to see the response. We have shipped some amazing features recently. Let’s see what humans of SigNoz were up to in the month of February 2024.

AI-Assisted Network Monitoring: Real or Hype?

Networking experts Chris O'Brien and Nina Bargisen join Capacity Media's Jack Allen to explore the evolving role of AI in network monitoring. They delve into historical applications of AI and machine learning in network observability, the integration of large language models for enhanced troubleshooting, and the significance of diverse data sources. The session includes a live demonstration of the AI-assisted query features of Kentik NMS (Network Monitoring System) and highlightings the advantages of streaming telemetry over SNMP. There's also an insightful Q&A session at the end.

Streaming Telemetry and SNMP Monitoring with Kentik NMS

Packet Pushers host Ethan Banks gets an overview of Kentik's new Network Monitoring System, Kentik NMS, from Chris O'Brien, Sr. Principal Product Manager at Kentik. Chris demonstrates key features including how Kentik NMS allows network engineers to take full advantage of streaming telemetry. Faster access to network device data using streaming telemetry over SNMP, ensures that NetOps professionals don't miss critical events that happen between traditional polling intervals.

The Recipe for Speeding Troubleshooting in Modern Networks

I love cooking. I find it to be a very creative outlet. I enjoy being able to combine various ingredients, which each add a specific flavor, color, and even texture. When these ingredients come together in a complementary way, it can result in a tasty, satisfying dining experience. If you think about it, network operations troubleshooting is not much different. Isolated data sets from various siloed tool sets are like the separate ingredients in a recipe.

Telegraf Configuration Migration

In v1.30.0, Telegraf will remove a few long-standing deprecated plugins. These plugins have been deprecated for a number of years, and plugins with better support and configuration options now replace them. This version of Telegraf also removes a number of configuration options. The full list of deprecated plugins includes: Starting from v1.30.0 Telegraf will show an error message and stop running if any of the plugins or options are present in your configuration.

How to Visualize Splunk with Grafana Cloud | Grafana

Visualize logs & metrics from Splunk using Grafana Cloud and the Splunk plug-in. Connect securely to a private Splunk server using Private Datasource Connect. This video covers: ☁️ Grafana Cloud is the easiest way to get started with metrics, logs, traces, dashboards, and more. We have a generous forever-free tier and plans for every use case.

How to Visualize Datadog Metrics with Grafana Cloud | Grafana

This video covers visualizing Datadog metrics using Grafana Cloud and the Datadog plug-in. Grafana Cloud allows you to visualize data from all of your observability tools in a single place. ☁️ Grafana Cloud is the easiest way to get started with metrics, logs, traces, dashboards, and more. We have a generous forever-free tier and plans for every use case.

How to perform multi-step API calls with Grafana

With its versatile palette of plugins and built-in integrations, Grafana empowers you to visualize your data, regardless of where that data is stored. Even if you need to make a direct request to a custom API, you can do that using the Infinity data source plugin, which is now officially maintained and managed by Grafana Labs. However, there’s a very specific use case that often sparks questions within the community: multi-step API calls.

17 Best Website Monitoring Tools of 2024: Find the Best Monitoring Software

The market for website monitoring tools is growing every year and choosing the right tool can be challenging. This guide will help you to choose a tool that can ensure your website stays up and helps to protect the integrity of your website. There is a variety of tools to monitor the uptime and performance of your website. Click here to jump straight to the first tool if you are already familiar with how website monitoring tools work.

How to Monitor SASE Networks: From Cloud to Endpoint

In modern connectivity, the advent of Secure Access Service Edge (SASE) has ushered in a new era of network architecture. But most network admins and IT pros understand the critical importance of not just adopting SASE but ensuring its continuous, secure, and optimized operation. In this blog post, we’ll explore the ins and outs of monitoring SASE networks —a crucial aspect that separates a robust, responsive infrastructure from potential bottlenecks and performance issues.

Step-by-step Guide to Monitor Logstash With Telegraf and MetricFire

Monitoring your Logstash service is crucial for several reasons, especially given its pivotal role in log processing and data pipeline architectures. Logstash often operates as part of the Elastic Stack (formerly known as ELK Stack, for Elasticsearch, Logstash, and Kibana), ingesting data from various sources, transforming it, and then outputting it to a storage and visualization layer.

Solve UC Problems Before They Cost Money

In this webinar, we discuss the high cost of UC&C application issues, and the impact these issues have on organizations. We'll be doing a deep dive of the amount of tickets organizations receive, the amount of time these tickets take to resolve, some real customer examples, the typical steps taken with and without Exoprise, and the ROI of real-user monitoring.

Rapid telemetry for Windows with OpenTelemetry and BindPlane OP

At observIQ, we’ve seen continuous customer interest in scalable and performant observability solutions for Windows environments. As of 2023, Windows is estimated to be deployed to 75% of desktops worldwide. Unsurprisingly, we commonly speak to CTOs, DevOps, and IT managers responsible for managing fleets of thousands of Windows-based end-user and point-of-sale systems in the Financial, Healthcare, Insurance, and Education sectors.

Part 2: Infrastructure Monitoring Metrics

Infrastructure monitoring metrics ensure the smooth operation and optimal performance of modern-day systems and networks. In today's fast-paced and highly competitive business environment, organizations rely heavily on their IT infrastructure to support their operations and deliver quality customer services. As such, any downtime or performance issues can significantly impact their bottom line.

How AppNeta Complements CASBs for Network Monitoring

In today's cloud-centric IT landscape, cloud access security brokers (CASBs) have become pivotal in managing and securing cloud applications. CASBs act as gatekeepers, enabling enterprises to extend their security policies beyond their own infrastructure and into the cloud. CASBs work by performing various kinds of network monitoring—they track user activities, data movement, and application usage within cloud environments.

How to detect, test and monitor your Next.js API endpoints with the Checkly CLI

In this video, we explore how to use the Checkly CLI to programmatically test and monitor Next.js API endpoints. We'll create a dynamic setup that detects new API GET URLs and use GitHub actions to test preview API deployments and deploy API monitoring after production deploys.

10 Best Open-Source Monitoring Tools for DevOps in 2024

We're StatusPal. We help DevOps and SRE streamline incident and maintenance communication with a powerful status page that integrates nicely with your monitoring and observability tools. Check us out!. In 2024, monitoring is essential to modern DevOps teams' work. DevOps teams need reliable and flexible tools to effectively monitor and manage complex systems that can provide real-time insights into system performance, availability, and security.

SigNoz Launch Week - Day 5 - Access Token Mgmt & Onboarding

Welcome to last day of SigNoz Launch Week! We will start with a chat with Ankit (CTO, SigNoz) about the evolution of SigNoz, our focus on OpenTelemetry and belief in open-source. Post that we will deep dive into recently released Access Token management feature which will help users programmatically access data stored in SigNoz and unlock powerful use cases. Then we will showcase our new SaaS onboarding flow which makes getting started with SigNoz much easier. We will also discuss the process we follow for improving our documentation & onboarding flow.

OpUtils MAC address tracker: We have got your network's back!

The missing piece in your effective resource management strategy is MAC address tracking. Using IPs to track network resources can be unreliable since they are not permanently associated with a specific device. MAC addresses, on the other hand, are unique and permanently associated devices offering inherent stability. Here’s a quick refresher on MAC addresses.
Sponsored Post

Analyzing SASE DEM Solutions

Vendors across security sectors are now offering their own digital experience monitoring products, especially when the security products can impact customer networks and performance at various levels. While these monitoring tools can provide valuable information to customers, it raises concerns about whether there is a potential conflict of interest between the vendor and the customer. If the SASE platform or security tools are introducing latency and slowing response times, how can the monitoring tools be trusted to accurately reflect their overhead?

Harnessing the power of AI in uptime monitoring for predictive analysis

In the digital age, uptime monitoring has become a cornerstone of business operations, ensuring websites and servers are always accessible to users. It's not just about keeping the lights on; it's about preserving reputation, ensuring customer satisfaction, and minimizing revenue loss. Enter Artificial Intelligence (AI), a game-changer in the way we approach uptime monitoring.

AI Explainer: Continuous Space

I wrote a previous blog post, "AI Explainer: What's Our Vector, Victor?," to scratch the surface on vector databases, which play a crucial role in supporting applications in machine learning, information retrieval and similarity search across diverse domains. From that blog arose the topic of embeddings, which I addressed in a subsequent post, "AI Explainer: Demystifying Embeddings." In explaining embeddings, the notion of continuous space was presented, which is the topic of this blog.

How do you build resilient systems to manage the IPL with 30+ million concurrent users?

The Indian Premier League is a unique sporting event for a dozen reasons. But for engineers in India, it’s one of a kind. Very few companies can boast of managing 30+ million concurrent users. Every year, this number grows. Last year, we witnessed ~60 million concurrent users. And things get bigger and larger every year.

Fixing Slowdowns: The Story of E-Banking System's Quick Recovery

In the world of digital banking, maintaining a seamless and efficient online experience is paramount. However, even the most robust systems can encounter issues that disrupt service and degrade performance. Let us delve into a recent incident that impacted eBanking services of one of our customers, highlighting the criticality of database management and the steps taken to resolve the issue.

Network Monitoring Tools Explained

Ensuring the reliability and performance of your network is essential for success in the modern software industry. In this article, you’ll learn about the basics of network monitoring and get an overview of some of the most popular tools used for network monitoring. Whether you’re managing a sprawling enterprise network or your home lab, understanding and deploying the right tools can mean the difference between smooth sailing and unforeseen downtime.

Docker Monitoring with ELK Stack

Dockers are containerization platforms where you can store multitudes of data in a single package ( by dividing them into different containers). Since these are high-volume entities, managing and monitoring them should be a top priority. I’ll tell you why. Because when it grows out of our capabilities, we won't be able to control any errors popping up in it. So, as the saying goes, prevention is better than cure.

Are Your Automations Doing Enough? 3 Signs Your Automation Strategy Falls Short

Are your task automations requiring too much manual intervention? Today, task automations help IT solve issues by automatically executing tasks or processes. With task automations today, each step needs to be manually run, checked, and depending on the outcome, followed up by another action. While this kind of automation can streamline operations and improve efficiency, it fails to address more complex issues. That’s where an orchestration engine, like Nexthink Flow, comes in. With orchestration.

How Complyt is using Datadog APM and distributed tracing to reduce application response times

Learn how Complyt is using Datadog Application Performance Monitoring (APM) and distributed tracing to turn data into knowledge and reduce application response times by more than 80%, which enabled them to meet SLAs for their largest customers.

Easy guide to Monitor Elasticsearch Using Telegraf and MetricFire

Monitoring Elasticsearch is crucial for ensuring optimal performance and reliability of the search and analytics engine, as it helps identify issues related to query performance, resource utilization, and system health before they impact users. It also provides insights into the efficiency of data indexing and retrieval processes, enabling timely adjustments to configurations, scaling decisions, and optimization of search queries to maintain high availability and fast response times.

Collectd Pandora FMS: Maximizing Monitoring Efficiency

Collectd is a daemon (i.e. running in the background on computers and devices) that periodically collects metrics from different sources such as operating systems, applications, log files, and external devices, providing mechanisms to store values in different ways (e.g. RRD files) or makes it available over the network. With this data and its statistics you may monitor systems, find performance bottlenecks (by performance analysis) and predict system load (capacity planning).

Network Risk Assessment: What Is It & How to Perform One

In an era where cyber attacks occur every 40 seconds and ransomware attacks, where hackers demand money to unlock your company’s files, are increasing by 400% each year. This means it's super important for your organization to protect its network. But do you know if you're spending enough resources on checking how safe your network is? Is your network performing well enough to protect from cyber-attacks? Are you monitoring the performance of core network security devices like firewalls?

Top Distributed Tracing Tools [updated for 2024]

Distributed tracing tools are essential in modern software development and operations for monitoring, troubleshooting, and optimizing complex distributed systems. The best tracing tools can help you eliminate performance bottlenecks and recover from incidents faster. Use this guide to pick the right one for you.

SigNoz Launch Week - Day 4 - Logs Pipeline

For day 4, we will showcase the recent work we have done in Logs Pipeline. With Log Pipelines, you can transform logs to suit your querying and aggregation needs before they get stored in the database. Pipelines provide a way to modify the structure and content of log data without needing to change application code or redeploy components. By extracting relevant attributes from logs, pipelines enable more efficient analysis.