

Operations | Monitoring | ITSM | DevOps | Cloud

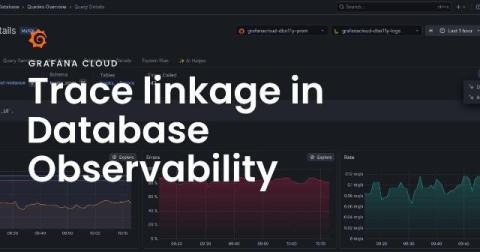
Trace linkage: connect the dots between your app traces and database queries

When an application request slows down, a trace can show a database call. Finding the database query behind it can be tedious, requiring you to switch between traces and database telemetry, as well as match timestamps or query text by hand. In Grafana Cloud, the Database Observability app already provides a window into all of your database telemetry, including query samples, performance history, and explain plan.
Bridging Alloy and OpenTelemetry: the OTel engine is now in Public Preview

Many Grafana Cloud customers love what Alloy offers them, but we're also seeing a growing base of users who feel the same way about the OpenTelemetry Collector. We want to make it easy for customers to make the decision that makes the most sense, regardless of their preference.

Finding performance wins in our own traces with a coding agent

For the last few weeks I’ve used a coding agent to find and fix backend performance issues in Sentry, starting from the traces Sentry sends to itself. Most of the fixes only changed a line or two. But together, they removed hundreds of millions of queries a week, and some expensive lookups became hundreds or thousands of times faster (more details on that below).