The latest News and Information on Containers, Kubernetes, Docker and related technologies.
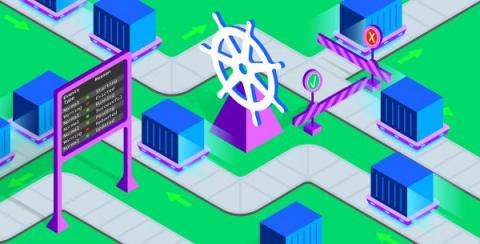
When Kubernetes components like nodes, pods, or containers change state—for example, if a pod transitions from pending to running—they automatically generate objects called events to document the change. Events provide key information about the health and status of your clusters—for example, they inform you if container creations are failing, or if pods are being rescheduled again and again. Monitoring these events can help you troubleshoot issues affecting your infrastructure.
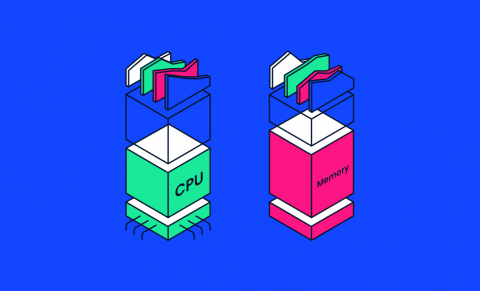
A containerized approach to software deployment means you can deploy at scale without having to worry about the configuration of each unit. In Kubernetes, clusters do the heavy lifting for you—they’re the pooled resources that run the pods that hold your individual containers. You can divide each cluster by namespace, which allows you to assign nodes (ie the machine resources in a cluster) to different roles or different teams. Resource quotas limit what each namespace can use.
In my previous blog post, I discussed how transitioning from legacy monolithic applications to microservices based applications running on Kubernetes brings a range of benefits, but that it also increases the application’s attack surface. I zoomed in on creating security policies to harden the distributed microservice application, but another key challenge this transition brings is observing and monitoring the workload communication and known and unknown security gaps.
Want to monitor all of your application's services? Our Standalone Agent allows you to monitor processes our standard integrations don't monitor by default, helping you effortlessly expand your monitoring capabilities. To help simplify the process of configuring our standalone agent, we're excited to announce the launch of our Standalone Agent's Docker image, available on Docker Hub under the name appsignal/agent.
Health checks for cloud infrastructure refer to the mechanisms and processes used to monitor the health and availability of the components within a cloud-based system. These checks are essential for ensuring that the infrastructure is functioning correctly and that any issues or failures are detected and addressed promptly. Health checks typically involve monitoring various parameters such as system resources, network connectivity, and application-specific metrics.
June 27, 2023 We were excited to learn last week that GigaOm named Densify as both a Leader and an “Outperformer” in its new report “Radar for Cloud Resource Optimization”. This was particularly meaningful to us for a few reasons.
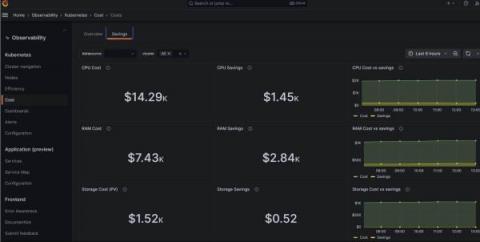
As your Kubernetes infrastructure — and your business — grows, so too does the headache of managing your stack. And since controlling costs is crucial for your organization’s well-being, you need visibility into your complex system to ensure you’re spending your money wisely. That’s why we’re excited to introduce Kubernetes cost monitoring as a new feature in Grafana Cloud.
As we are now 6 months into the year, I thought this would be a great time to sit and reflect on everything that has happened at Civo so far (and some of the plans we have in the pipeline). If you’re interested in taking a look at our previous roadmaps.