Avantra handles RISE with SAP security monitoring for the layer that stays with the customer under the RISE with SAP shared responsibility model. SAP operates the infrastructure, network, database, and operating system, while the customer still owns application configuration, users and authorizations, custom code, and requesting the SAP Security Notes that SAP doesn’t apply proactively.
Avantra monitors SAP security patch status across entire landscapes, checking each newly published SAP HotNews note against every managed system and tracking which systems still need it. It covers the patch side of SAP vulnerability management, which is a different job from code-level vulnerability scanning.
The faster teams deploy, the more releases fail, and burnout climbs right with it. What 700 engineers told Harness about delivery at AI speed. Lenny's Newsletter put out its 2026 tech workforce survey this year, and you should read the whole thing. The headline stats: significant burnout jumped from 44.7% to 55.7% of tech workers in a year. Career optimism dropped from 54.8% to 48.7% over the same period of time.
An AI agent and digital certificate inventory is a record of every AI agent and digital certificate an organization runs, with what each one does, who owns it, what it connects to and when it expires or needs a review. IT and IT Asset Management (ITAM) teams build one because both kinds of asset keep critical services running with no hardware to scan, no purchase order to trace and, very often, no owner on record.
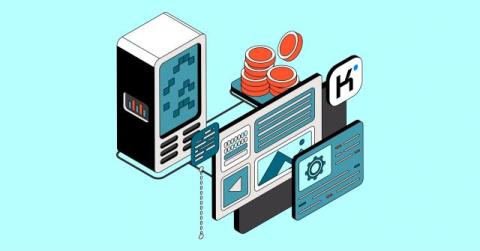
Kimi API pricing, per million tokens: the flagship Kimi K3 costs $3 input and $15 output with a $0.30 cache-hit rate and 1M context. Kimi K2.6 and the coding-tuned K2.7 Code both run $0.95/$4.00 on 256K context. Kimi K2.5 and the legacy V1 family were retired August 31, 2026.
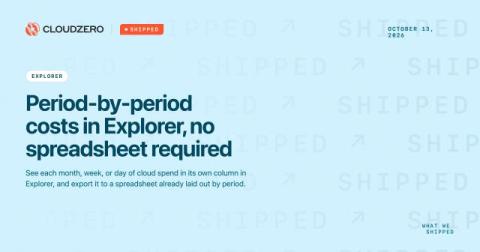
Finance teams reconcile cloud spend period by period. They want each month, week, or day in its own column, so they can scan across a row and see how a service or team changed over time. Explorer’s Aggregate view already answers “what changed and by how much.” But when the question is “what did we spend in June, July, and August, line by line,” that summary needs to become a grid.
Across a same-store panel of 422 CloudZero customer organizations, AI reached 3.02% of the median company's cloud bill in September 2026, up 37 basis points from 2.66% in August, the largest monthly gain since we began tracking. The 75th percentile rose to 12.55%. The share of organizations spending at least $1,000 a month on AI barely moved, to 68.0%. Companies already spending drove the growth. Last month we called the median the least informative number in this report. September proved us wrong.
To manage cloud alerts effectively, define which conditions require immediate action, include useful incident context, and route critical notifications to the engineer currently on call. Add escalation rules for unanswered alerts and test the entire path from detection to response. This process applies whether your team uses AWS, Azure, Google Cloud, or several providers. Cloud monitoring can tell you something is wrong.
IT incidents do not follow a 9-to-5 schedule. A server can go down overnight, a critical application can fail on a weekend, or a high-priority support ticket can arrive when the IT team has already left the office. For IT teams, the challenge goes beyond simply providing after-hours IT support. They need a reliable on-call process that identifies the right responder, delivers critical alerts and ensures timely escalation when necessary.