What is a Pod? Kubernetes for Beginners
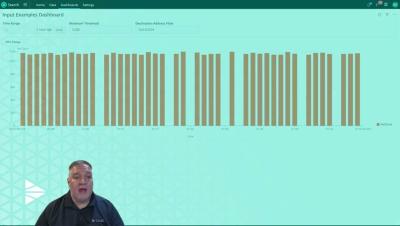
In this short clip, we look at what a pod is and the basic architecture of Kubernetes. To learn more, check out these resources: Chapters.


The latest News and Information on Log Management, Log Analytics and related technologies.
As a Site Reliability Engineer (SRE) or DevOps professional, you are well aware of the importance of observability in ensuring the smooth functioning and performance of your applications. Observing and monitoring your applications can help you identify and resolve issues in real-time, resulting in increased reliability and improved user experience. Logs play a crucial role in this process as they provide detailed information about the activity and behavior of your applications.
In the world of modern business, data drives decision-making. Every interaction, every transaction, and every click generates a series of data in the form of logs. These logs, often seen as plain text records, have the potential to unlock valuable business insights when analyzed correctly. In How to Create Log-Based Metrics to Improve Application Observability, we described the process of creating log-based metrics to improve application observability using Sematext Cloud.
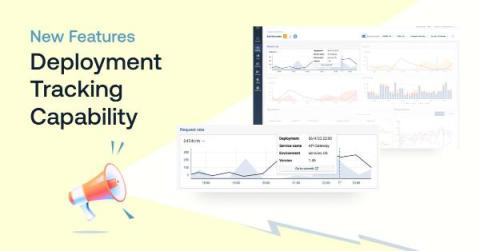
When things go wrong, we’d all love the ability to go back in time, return things to the way they were, and fix whatever issues pop up at the start so they never happen in the first place. This is no different when maintaining complex microservices-based architectures. With any complex system, things are bound to go wrong from time to time.