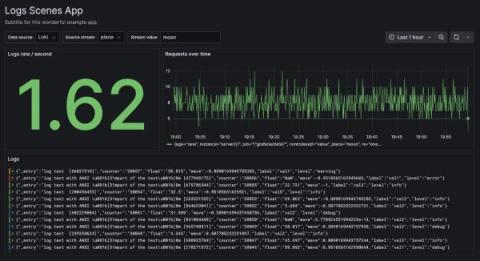
Grafana’s plugin tools help developers extend Grafana’s core functionality and create plugins faster, with a modern build setup and zero configuration. Grafana Scenes, meanwhile, is a new front-end library, introduced with Grafana 10, that enables developers to create dashboard-like experiences — such as querying and transformations, dynamic panel rendering, and time ranges — directly within Grafana application plugins.
Cribl Search is reshaping the data search paradigm, empowering users to uncover and analyze data directly from its source. Cribl Search can easily reach out and query data already collected in Amazon S3 (or S3 compatible), Amazon Security Lake, Azure Blob, Google Cloud Storage, and more. By searching data where it lives, you can dramatically speed up your search process by avoiding the need to move data before analyzing it.
Today, more than ever, as IT environments become more diverse and complex, the need for an effective network monitoring solution has become paramount. However, with the digital environment, it’s constantly ever-evolving, so, these tools must keep pace with these changes to ensure they are still effective for users diagnosing issues and identifying bottlenecks within their network.
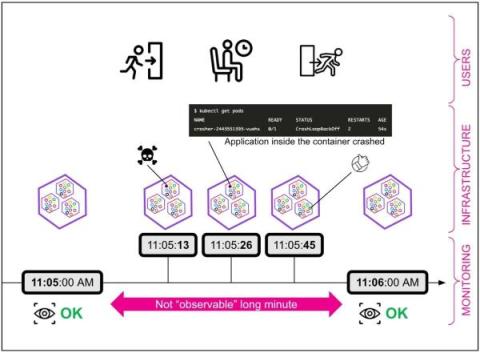
Do you find yourself lying awake late at night, worried that your greatest observability fears will materialize as one of the most horrific specters of Kubernetes-driven chaos reaches up through your mattress to consume your very soul?
Today's enterprise networks are diverse and complex. Rather than the simple network perimeter of old, bad actors can attack through multiple entry points, including cloud-based applications. Not to mention, these networks generate massive amounts of transactional data. Because enterprise networks have become larger, they're more difficult to secure and manage. As a result, IT operations teams and security analysts seek better ways to deal with the massive influx of information to improve security and observability.
In the first part of our 2023 PromCon recap, we spent OpenObservability Talks exploring the Perses open source project. We found heavy users of open source Grafana who found themselves grappling with issues arising from managing a vast number of dashboards, and the need to manage dashboards as code in a GitOps fashion.
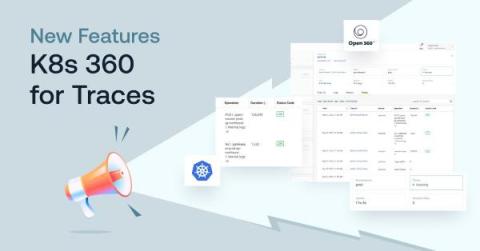
In the intricate web of modern software systems and full-stack observability, knowing how requests flow and interact across distributed components is paramount. Distributed tracing tools can help you. To better understand how distributed tracing works and benefits, here’s our selection of top distributed tracing tools to choose from.
I have worked as a helpdesk specialist, cyber security analyst, information systems security engineer, professional services consultant, etc. At this point in my career, I have seen enough to relate with anyone in the IT world. Let’s narrow our focus and chat about monitoring system health and troubleshooting. Tool sprawl is the standard.
The term Server Monitoring, whilst put simply can be defined as the practice of obtaining into the behavior of your servers both physical and virtual, can be deemed complex. This is purely due to the vast range of servers that exist. Due to this, it is difficult to place a ‘one size fits all’ approach to Server Monitoring.
Modern distributed applications are composed of potentially hundreds of disparate services, all containing code from different internal development teams as well as from third-party libraries and frameworks with limited external visibility. Instrumenting your code is essential for ensuring the operational excellence of all these different services. However, keeping your instrumentation up to date can be challenging when new issues arise outside the scope of your existing logs.
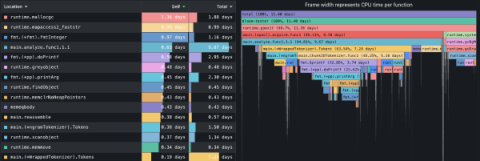
Recently, Elastic Universal ProfilingTM became generally available. It is the part of our Observability solution that allows users to do whole system, continuous profiling in production environments. If you're not familiar with continuous profiling, you are probably wondering what Universal Profiling is and why you should care. That's what we will address in this post.
The World Wide Web’s transmission system is built on HTTP. To ensure an application that uses the HTTP transmission works, you must monitor it constantly. This is where an HTTP monitor comes in. In this tutorial, we’ll cover the fundamentals of HTTP monitors, including what they are, why they matter, and how to set one up.
Solr is widely adopted by startups and enterprises alike. It’s powerful and open-source, so it’s very appealing to just about everyone looking for a search platform to build off of. Being easily accessible, many people overlook the importance of monitoring Solr. Even when that importance is put into question, a lot of people continue with the trend and use an open-source tool for their monitoring needs.
As the second largest and active Cloud Native Computing Foundation (CNCF) project, OpenTelemetry is well on its way to becoming the ubiquitous, unified standard and framework for observability. OpenTelemetry owes this success to its comprehensive and feature-rich toolset that allows users to retrieve valuable observability data from their applications with low effort. The OpenTelemetry Java agent is one of the most mature and feature-rich components in OpenTelemetry’s ecosystem.
In the vibrant atmosphere of PromCon during the last week of September, attendees were treated to a plethora of exciting updates from the Prometheus universe. A significant highlight of the event has been the unveiling of the Perses project. With its innovative approach of dashboard as code, GitOps, and Kubernetes native features, Perses promises a revolutionary experience for Prometheus users, which gained a lot of traction at the conference.
To fully utilize the capabilities of Kubernetes, it’s crucial to have a reliable system for gathering and organizing logs, metrics, and events. With the complex nature of container orchestration, it’s crucial to understand the significance and process behind the data generated in a Kubernetes environment at scale. Cribl Edge works seamlessly with Kubernetes and can cater to various needs.
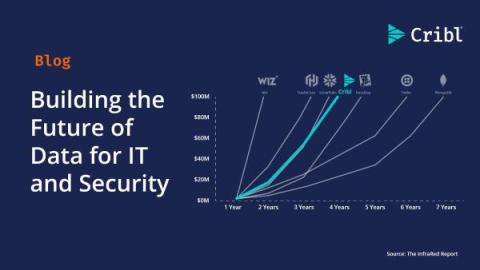
Today, Cribl surpassed $100 million in annual recurring revenue (ARR), becoming one of the fastest companies to ever reach this milestone in under four years––an incredible achievement on our journey to building a generational company. Reaching $100 million in ARR so quickly shows that our unique approach and steadfast focus on IT and Security continues to be validated by the market.
Logz.io is always growing and evolving based on customer usage and feedback. We add new features and quality of life improvements all the time. Here’s the round up of what we released in 2023 Q3.
IT environments can produce billions of log events each day from a variety of hosts and applications. Collecting this data can be costly, often resulting in increased network overhead from processing inefficiencies and inconsistent ingestion during major system events. Google Cloud Dataflow is a serverless, fully managed framework that enables you to automate and autoscale data processing.
Over the last year or so, the unavoidable topic of overwhelming cost has emerged as the number one issue among today’s observability practitioners. Whether it is in conversations among end users, feedback from customers and prospects, industry chatter or the coverage of experts including Gartner, the issue of massive telemetry data volumes driving unsustainable observability budgets prevails.
Cribl’s interface is Super Neato: Reactive, beautiful, and easy to use. But sometimes you need to access settings and configurations programmatically. The good news is that interactive API docs are baked into your Cribl instance. The better news is that everything that happens in the GUI is making API calls. With your browser’s developer mode, you can easily take a peak behind the curtain to see exactly how the API was called and what the payload looked like.
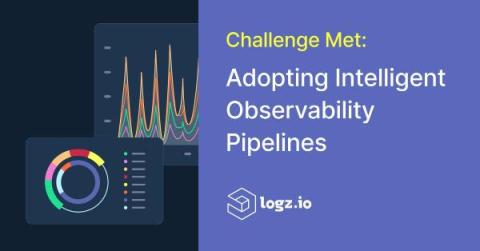
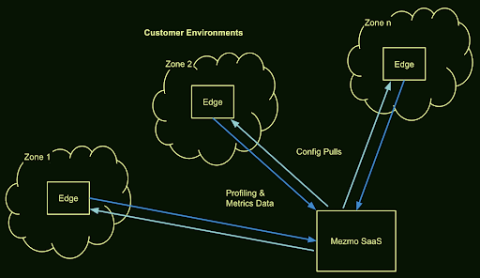
Adapting to efficient ways to build and control pipelines is vital to businesses aiming to ensure streamlined data operations and maintain a competitive advantage. That’s why we’re introducing Mezmo Pipeline as Code—a transformative approach to pipeline management.
Elastic Observability is the optimal tool to provide visibility into your running web apps. Microsoft Azure Container Apps is a fully managed environment that enables you to run containerized applications on a serverless platform so that your applications scale up and down. This allows you to accomplish the dual objective of serving every customer’s need for availability while meeting your needs to do so as efficiently as possible.
At Cribl, we have the privilege of helping our customers achieve their strategic data goals by giving them visibility and control over all of their observability data. The reality today is that data is commonly stored across many places. Whether intentional (such as using Cribl Stream to create a security data lake) or unintentional (because of silos and tool sprawl), organizations desire the ability to access and analyze all of this information at any time.
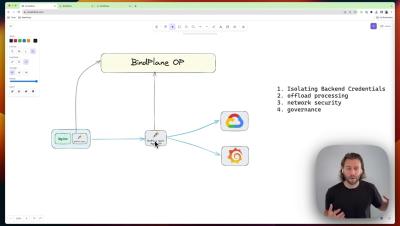
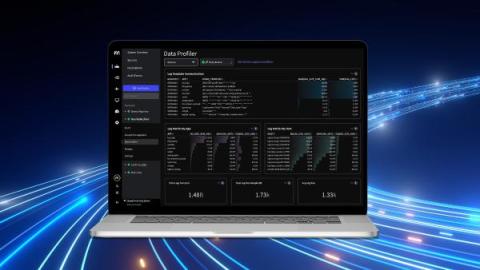
We recently had the privilege of presenting our telemetry data pipelining platform at Cloud Field Day. Today, we'd like to share a recap of our demo with you. In this demo, we explore the transformative potential of data profiling, telemetry pipeline optimization, and incident response. Foundationally, we follow an Understand, Optimize, and Respond workflow.
The way we handle massive volumes of data from multiple sources is about to change fundamentally. The traditional data processing systems don’t always fit into our budget (unless you have some pretty deep pockets). Our wallets constantly need to expand to keep up with the changing data veracity and volume, which isn’t always feasible. Yet we keep doing it because data is a commodity.
We often get questions like: And while the 14-year-old in me is proud to say that we’ve done 24/7 support for clusters of 1000+ nodes holding many PB of data, I am quick to add that.
Imagine you’re piloting a spaceship through the cosmos, embarking on a thrilling journey to explore the far reaches of the universe. As the captain of this ship, you need a dashboard that displays critical information about your vessel, such as fuel levels, navigation data, and life support systems. This dashboard is your lifeline, providing you with real-time insights about the health and performance of various systems within your ship, so you can quickly make critical decisions.
Navigating the realm of Windows observability often referred to as O11y (short for observability), can be a complicated journey. Windows environments are known for their complexity, with various services, applications, and workloads running on each host.
Kubernetes (K8s) is at the forefront of modern infrastructure, but with its capabilities comes a deluge of telemetry data. Efficiently managing and optimizing this data is crucial to harnessing the full potential of your Kubernetes deployments.
The cybersecurity industry is experiencing an explosion of innovative tools designed to tackle complex security challenges. However, the hype surrounding these tools has outpaced their actual capabilities, leading many teams to struggle with complexity and extracting value from their investment. In this conversation with Optiv‘s Randy Lariar, we explore the potential and dangers of bringing advanced data analytics and artificial intelligence tools to the cybersecurity space.
The story of how we simplified database system monitoring for generalists while making it flexible enough for specialists.
Grafana is a powerful open-source platform for monitoring and observability, but what truly makes it shine are its plugins. For technology engineers looking to expand Grafana's capabilities, plugins are the way to go. In this post, we'll dive into the world of Grafana plugins and offer some unique tips to get the most out of them.
While Grafana is one of the better known names in the industry, Coralogix offers a full-stack observability platform. Despite the popularity of the Grafana brand, the cloud based solution lacks in some key areas. This article will go over the differences between Coralogix and Grafana Cloud, from features, customer support, pricing and more.
OK, so you’ve decided to move from Elasticsearch to OpenSearch. Maybe our comparison helped you decide and maybe you’ve checked our guide on how to perform the migration. But how do you know if your new OpenSearch performs as well and functions as correctly as the existing Elasticsearch? Even when comparing old with new versions, upgrades don’t always translate into better performance.
What are the current options to migrate from OpenSearch to Elasticsearch®? OpenSearch is a fork of Elasticsearch 7.10 that has diverged quite a bit from itself lately, resulting in a different set of features and also different performance, as this benchmark shows (hint: it’s currently much slower than Elasticsearch).
Metrics are closely associated with cloud infrastructure monitoring or application performance monitoring – we monitor metrics like infrastructure CPU and request latency to understand how our services are responding to changes in the system, which is a good way to surface new production issues. As many teams transition to observability, collecting metric data isn’t enough.
One of the things I really love about working for Cribl is the ability to help our customers optimize their data. Microsoft Windows Event Logs are something I have always looked to as a proverbial Rosetta Stone to help translate semi-structured, classic-style events into something more efficient and less resource-intensive to search. Extracting field values requires a large number of regular expressions to parse the events, which isn’t ideal.
Today, we released our systemd journal plugin for Netdata, allowing you to explore, view, search, filter and analyze systemd journal logs. Like most things about Netdata, this is a zero-configuration plugin. You don’t have to do anything apart from installing Netdata on your systems.This is key design direction for Netdata, since we want Netdata to be able to help even if you install it mid-crisis, while you have an incident at hand.
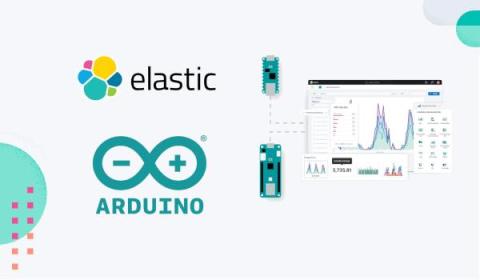
An easy way to communicate with Elasticsearch and Elastic Cloud using Arduino IoT devices At Elastic®, we are constantly looking for new ways to simplify search experience, and we started to look at the IoT world. The collection of data coming from IoT can be quite challenging, especially when we have thousands of devices. Elasticsearch® can be very useful to collect, explore, visualize, and discover data — for all the data coming from multiple devices.
In the world of monitoring and observability, Prometheus has grown into the de-facto standard for monitoring in cloud-native environments because of its robust data collection mechanism, flexible querying capabilities, and integration with other tools for rich dashboarding and visualization.
“Why bother with it? I let it run in the background and focus on more important DevOps work.”— a random DevOps Engineer at Reddit r/devops In an era where technology is evolving at breakneck speeds, it's easy to overlook the tools that are right under our noses. One such underutilized powerhouse is the systemd journal. For many, it's a mere tool to check the status of systemd service units or to tail the most recent events (journalctl -f).
As modern software systems become increasingly distributed, interconnected, and complex, ensuring production reliability and performance is becoming harder and more stressful. Seemingly nondescript changes to our infrastructure or application can have massive impacts on system uptime, health, and performance, all while the cost of production incidents continues to grow.
Throughout the software development process, engineers can use a number of methods and tools to ensure their code is efficient. When using Go, for example, there are built-in tools, including those for benchmarking and CPU/memory profiling, to check how efficiently code will run. Engineers can also run unit tests to validate code quality.
ING Group is a Dutch-based multinational banking and financial services corporation serving more than 38 million customers globally. It’s one of the biggest banks in the world, consistently ranking among the top 30 largest banks globally. At ING, our 20-year-old COBOL-based financial messaging system — which provides electronic instructions to enable financial transactions between banks and customers — is slowly becoming obsolete and difficult to integrate.
Kubernetes is one of the most important and influential technologies for building and operating software today because it’s so incredibly capable. It’s flexible, available, resilient, scalable, feature-rich and backed by a global community of innovators — that’s a pretty impressive list of intangibles to apply to any particular capability.
Getting your organization to invest in a new tool requires telling a story that helps decision-makers understand its benefits. In a recent webinar, our experts discussed how to define an ROI for Cribl Stream. They also shared a sample proposal you can use to craft the story you’ll tell to leadership, and gave some tips and tricks for justifying the purchase of these key tools for your business. Engineers and architects understand core technical problems better than anyone.


OpenSearch is a powerful, open-source analytics and search engine that can be utilized to construct custom search solutions for a broad variety of applications, from websites to enterprise-level systems. It enables flexible search and indexing abilities, making it suitable for a range of uses, a great example of this is scalability. OpenSearch is designed for horizontal scalability, enabling organizations to input additional nodes to their cluster as data volumes and query loads increase.
For many IT organizations, triaging or troubleshooting starts with assessing symptoms. As practitioners investigate the causal factors by answering each of the “5 whys,” logs are often where the actual root cause answers lie. This is even more true for issues related to configuration changes, change management, and security. However, diving into log data can be overwhelming as a first step due to the high volume and velocity of logs and missing context.
Elastic Observability is the premiere tool to provide visibility into web apps running in your environment. AWS App Runner is the serverless platform of choice to run your web apps that need to scale up and down massively to meet demand or minimize costs. Elastic Observability combined with AWS App Runner is the perfect solution for developers to deploy web apps that are auto-scaled with fully observable operations, in a way that’s straightforward to implement and manage.