The latest News and Information on Log Management, Log Analytics and related technologies.
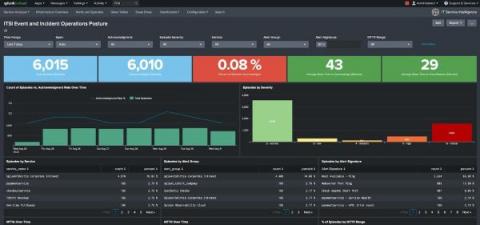
The 1.7 release of the Splunk App for Content Packs comes with a slew of new awesomeness for the Content Pack for ITSI Monitoring and Alerting designed to bolster your IT operations team’s visibility and AIOps posture! Previous versions of the content pack focused on making it easy for you to create and group Notable Events from ITSI Services and third-party monitoring tools.
Stateful, commonly monolithic, and absolutely fundamental to system design, the quality of your database administration and operation is a key determinant of your overall success. Databases are the cornerstone of modern architecture, requiring constant effort, investigation, and iteration to get the most out of a database. This makes it all the more terrifying when an outage occurs.
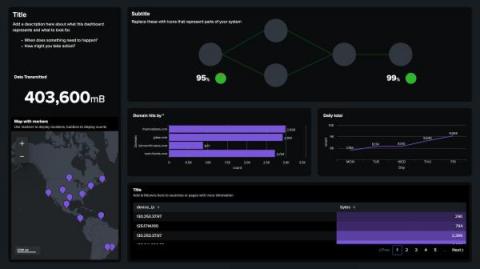
Every day, dashboards are viewed more than 500,000 times at Splunk. They’re what make the sea of data intelligible and help tell a story when working with a team. However, constant net-new dashboard creation is not necessarily a value-add activity — it’s a workflow to rapidly turn data into doing.
We’ve got a lot of OpenTelemetry-flavored honey to send your way, ranging from OpenTelemetry SDK distribution updates to protocol support. We now support OpenTelemetry logs, released a new SDK distribution for OpenTelemetry Go, and have some updates around OpenTelemetry + Honeycomb to share. Let’s see what all the buzz is about this time! 🐝🐝
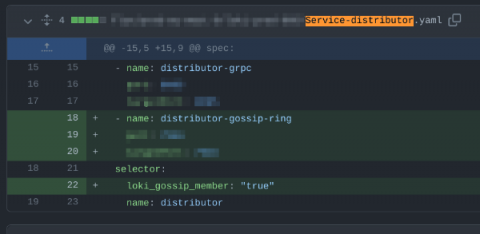
Hello, I’m Callum. I work on Grafana Loki, including the hosted Grafana Cloud Logs offering. Grafana Loki is a distributed multi-tenant system for storing log data — ingestion, querying, all that fun stuff. It also powers Grafana Cloud Logs.