Operations | Monitoring | ITSM | DevOps | Cloud

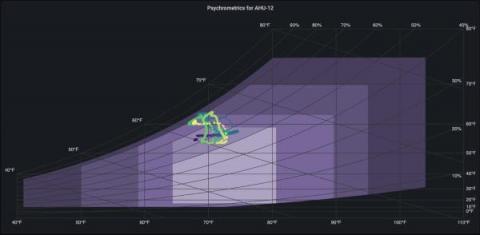
Monitoring HPC system health with Grafana and Psychart

Nicolas Ventura is a critical facilities engineer at NERSC, with experience in both mechanical and computer systems. The National Energy Research Scientific Computing Center (NERSC) is a modern data center that’s home to two powerful high-performance computing (HPC) systems used for worldwide scientific research in genetics, physics, geology, and more. As such, the infrastructure team at NERSC has to closely track the facility conditions to ensure optimal operations.
5 key benefits of Kubernetes monitoring

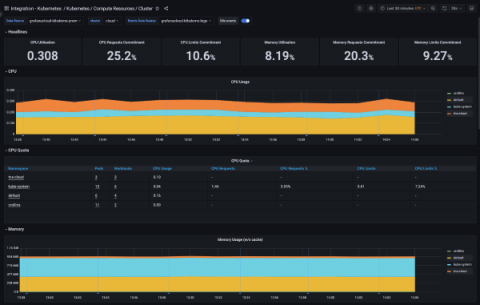
Kubernetes made it much easier to deploy and scale containerized applications, but it also introduced new challenges for IT teams trying to keep tabs on these newly distributed systems. Ops teams need proper visibility into their Kubernetes clusters so they can track performance metrics, audit changes to deployed environments, and retrieve logs that help debug application crashes.

Grafana 9.2 release: New Grafana panel help options, Grafana oauth updates, simplified variable editor for Grafana Loki, and more!

Welcome to Grafana 9.2, a jam-packed minor release with a wide range of improvements to help you create and share Grafana dashboards and alerts. Along with new developments for public dashboards and support for Google Analytics 4 properties, Grafana 9.2 offers new ways to connect with support teams about panel issues, a simplified query variable editor for Grafana Loki, improvements to access control, and much more.

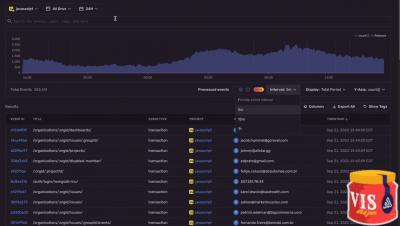
Interval Selector in Sentry Dashboards

Demo of the new time interval selector feature within the Sentry Dashboards tab. These are actual videos submitted by Sentaurs for our monthly Show-N-Tell. We have not edited them except for obscuring personal information that may appear in screenshots. Some videos may include screenshots that contain fictitious usernames or email addresses for illustrative purposes.

Grafana k6 one year later: Lessons learned after an acquisition

A few years ago, I was meeting with venture capitalists and private equity firms about the future of k6, the open source performance testing tool that we created in 2016 and open sourced in 2017. After talking about the k6 product mission — to give modern engineering teams better tools to build reliable applications — one investor challenged us to create an even bigger vision for the company: What if we acquired a company to broaden the k6 story?

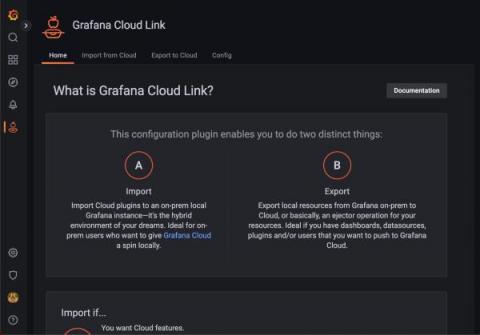
Announcing Grafana Cloud Link, a gateway from any local Grafana instance to Grafana Cloud

If you’ve had a local Grafana instance for any length of time, it’s likely dialed in just how you like it, and that’s a good thing. If you are working within Grafana Cloud, by contrast, you are using a heavily opinionated experience that our teams are building, managing, and provisioning. As a result, we serve up solutions that users can work with out of the box and can use to build their stack.

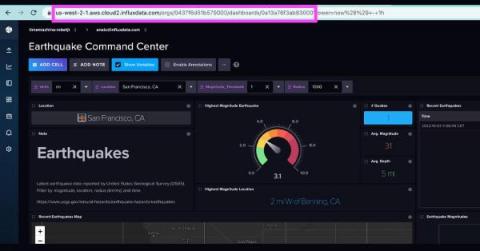
TL;DR Deep Linking Dashboards

If you’re an InfluxDB and InfluxDB UI user, you’ve almost certainly created dashboards. However, if you’re building dozens of dashboards in the InfluxDB UI, you might have come across the need to deep link related dashboards. In this tutorial we’ll learn how we can use the table view with Flux, string interpolation, and variables to deep link users to other dashboards.