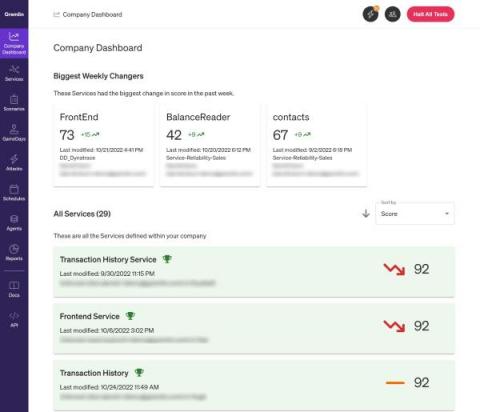
Part of a successful reliability program is being able to monitor and review your progress toward improving reliability. Being able to run tests on services is a big part of it, but how can you tell you're making progress if you can only see your latest test results? There should be a way to track improvements or regressions in your reliability testing practice across your organization in a way that's easy to digest. That's where the Reliability Dashboard comes in.
Today, Grafana Labs announced a strategic partnership with Isovalent, the creators of Cilium, to make it easy for platform and application teams to gain deep insights into the connectivity, security, and performance of the applications running on Kubernetes by leveraging the Grafana open source observability stack.
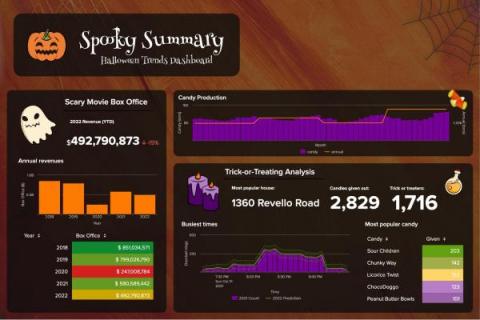
Dashboards are not just tools for businesses and other organizations to monitor and respond to their data, but can be a method of storytelling. All of our data has the potential to be crafted into compelling narratives, which can easily be accomplished with the help of Dashboard Studio’s customizable formats and advanced visualization tools. We can take a series of disparate datasets and bring them together in one place if they share a common theme — in this case, Halloween.
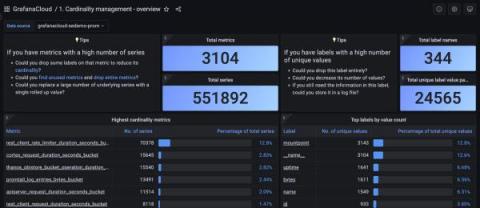
Over the last few months, a common and recurring theme in our conversations with users has been about managing observability costs, which is increasing at a rate faster than the footprint of the applications and infrastructure being monitored. As enterprises lean into cloud native architectures and the popularity of Prometheus continues to grow, it is not surprising that metrics cardinality (a cartesian combination of metrics and labels) also grows.
Grafana Loki is Grafana Labs’ open source log aggregation system inspired by Prometheus. Loki is horizontally scalable, highly available, and multi-tenant. In addition, Grafana Cloud Logs is our fully managed, lightweight, and cost-effective log aggregation system based on Grafana Loki, with free and paid options for individuals, teams, and large enterprises.
Last week, we were thrilled to launch a new website overview dashboard in RapidSpike: the Third Party Management Dashboard.
Varland Plating has been in the electroplating business since 1946. At their industrial job shop in Cincinnati, Ohio, they perform complex electrochemical treatments on steel, brass, and copper manufactured parts to create everything from corrosion-resistant building materials to decorative metals.
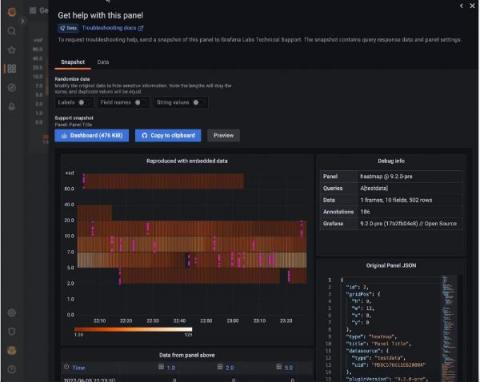
Ever run into issues building a panel in your Grafana dashboards? To help with those issues, the current support process for Grafana, Grafana Cloud, and Grafana Enterprise often requires many cycles where we request more information. This can be slow, frustrating for both our users and our support teams, and the process makes it difficult to reproduce issues without access to similar data.