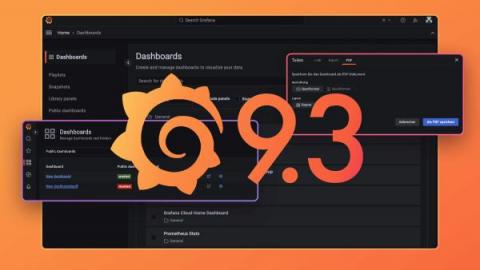
Welcome to Grafana 9.3! Get Grafana 9.3 In our continued efforts to make Grafana more accessible and easier to use, we are excited to showcase new updates to improve navigation, introduce localization, and much more. Read our What’s New documentation to learn all about the latest release and for more details, refer to the changelog.
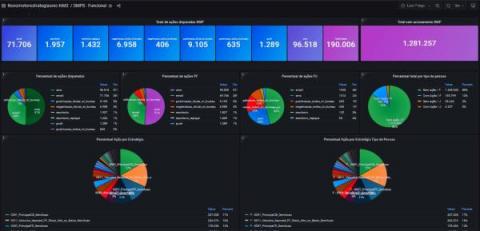
Brazil’s Banco Itaú is the largest bank in Latin America, so when performance and uptime issues impact its applications, the reverberations can be massive. “It can impact the whole economy of Brazil. It can damage other banks’ business too,” Ana Paula Genari Martin, SRE manager at Banco Itaú, said in her recent ObservabilityCON talk. And keeping those applications running is no small feat, considering the size of their digital operations.
It’s hard to think of a use case that Grafana hasn’t been used for. When Torkel Ödegaard launched the Grafana open source project with his first commit in December 2013, “my goal was to make time series data accessible for a wider audience, to make it easier to build dashboards, and to make graphs and dashboards more interactive,” he said.
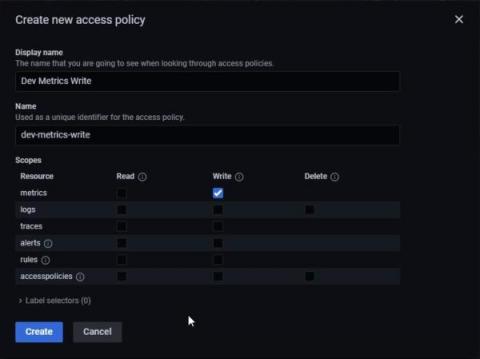
Until recently, Grafana Cloud users had to rely on API keys to read and write data to and from the composable observability platform. These API keys had minimal features, which limited administrators’ ability to manage account access on a granular level. We’re keenly aware of these shortcomings, and we’ve been working to overhaul and replace these API keys with something more flexible, more reliable, and more secure.
Did you know that the visual console editor allows users to design the final look by dragging elements with the mouse? You just have to choose the background and icons that represent the status of each relevant aspect you want to display. We tell you this and much more in the video on our workshop.
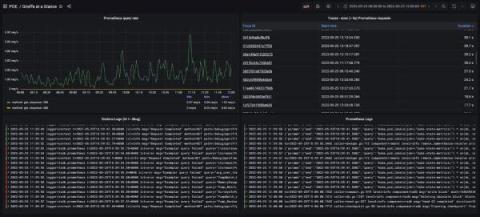
California-based Medallia captures feedback signals — in-person interactions, customer surveys, call centers, social media, etc. — to help businesses improve their customer experience. In much the same way, the company’s Performance and Observability Engineering team captures observability signals to optimize the experience for internal users.
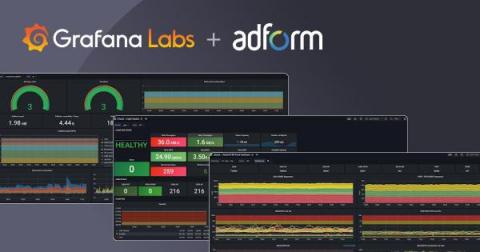
Over the course of two decades, Adform grew from a dream between friends huddled in a basement to a leading advertising tech platform powering more than 25,000 clients worldwide. Success brought external accolades, but it also created the need for internal innovation to support the company’s continued growth. In 2018, Adform was still operating in startup mode, which meant developers and teams cherry-picked the tools that worked best for them.
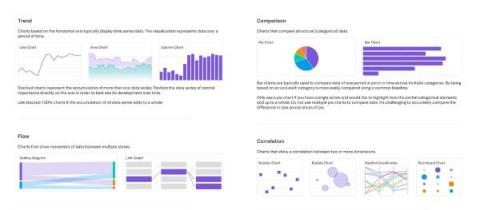
There are many visualization types and configurations available to choose from. In general, keep your visualizations as simple and straightforward as possible to avoid distraction and highlight only the most important information. If there is too much unnecessary information on the page it can be overwhelming and focus can be misdirected to unimportant details.