Operations | Monitoring | ITSM | DevOps | Cloud

Getting started with Prometheus dashboards

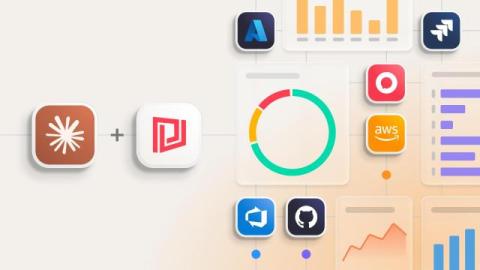
Prometheus is a wildly popular open source monitoring tool typically used for monitoring Kubernetes environments and containerized workloads. But how do you turn the mountains of metrics into a clear picture of health and performance? SquaredUp plugs directly into your Prometheus database to visualize and monitor your data. What sets SquaredUp apart from other Prometheus visualization options like Grafana and Perseus is just how easy it is to visualize, monitor and share Prometheus dashboards.

Grafana Tempo: The distributed tracing journey to 3.0 (June 2026 Community Call)

Our distributed tracing journey from the inception of Tempo to 3.0. Can't comment in the chat? You may need to create a channel. Grafana Cloud is the easiest way to get started with Grafana dashboards, metrics, logs, traces, and profiles.

From API to live dashboard - building a SquaredUp plugin with AI

No matter how fast we build, we'll never integrate with every tool. There are too many, new ones appear constantly, and some are too niche to ever reach the top of our roadmap. So if the tool you care about isn't supported yet, your options have been to wait for us to get to it, or build it yourself with our Web API plugin — a powerful, flexible option, though one that asks you to map out the endpoints, authentication and paging yourself.

Automatically discover and remediate root causes with Grafana Assistant Investigations

You can use Grafana Assistant Investigations to automatically discover incidents and help find root causes—and this AI-powered Grafana Cloud feature recently got a major upgrade to give you even more confidence in its findings. You can read more about the behind-the-scenes effort in our new engineering blog Unprompted, where we get into harness engineering, context compaction, benchmarking, and keeping agents alive and working well in long-running sessions.

Asimov's Zeroth Law of Robotics: testing and observing AI (ExpoQA 2026)

Asimov's Three Laws of Robotics are missing one — and when it comes to testing and observing AI, Nicole van der Hoeven argues that missing rule changes everything: before a robot can avoid harm, obey orders, or protect itself, there has to be a Zeroth Law: a robot must be observable. Because if you can't see what a system is doing, you have no way of knowing whether it's following any rule at all.

Why Engineers Don't Trust Autonomous AI - 4th Annual Observability Survey | Grafana Labs

The 2026 Observability Survey from Grafana Labs heard from over 1,300 engineers and leaders across 76 countries on the real-world role of AI in observability. The data reveals a sharp distinction between intelligence and autonomy — and a critical blind spot most teams have.

AI Observability Deep Dive Demo | Grafana Cloud

Grafana AI Observability is our new database and platform for observing AI Agents. Over the past year at Grafana Labs, we built Agents and we needed a way to understand how they are performing, what are the costs associated with them, what's the error rate or time to the first token as well as how they are behaving. Grafana Staff Engineer, Ivana Hučková provides a deep dive demo on how Grafana AI Observability connects our experience building Agents with our experience building observability systems.