Operations | Monitoring | ITSM | DevOps | Cloud

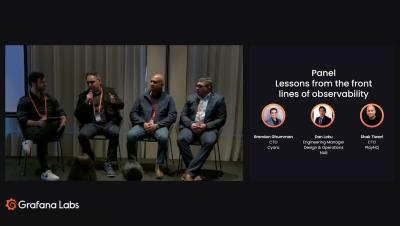
Observability for Healthcare Systems | Grafana Everywhere

Grafana Assistant is going places you might not expect — including healthcare. Golden Grot winner Oren Lion from TeleTracking reveals how Grafana Cloud supports their systems that help keep patient care moving — and how Assistant enables teams to get from “what happened?” to “here’s why” faster. From moon landings to patient care, Grafana is everywhere. Congratulations to Oren, Chris Johnson, Mark Munson, and the entire TeleTracking team on winning this year's Golden Grot Award for Pioneering AI in Observability!

Getting Started with NinjaOne dashboards

If you manage endpoints for a living, you'll know the problem isn't a lack of data. It's that there's too much of it, scattered across too many places. A modern IT team or MSP might be looking after thousands of devices spread across dozens of customer organizations, each generating a constant stream of alerts, patch results, antivirus events and disk warnings. NinjaOne does a great job of collecting all of that.

AI Observability Deep Dive Demo | Grafana Cloud

Grafana AI Observability is our new database and platform for observing AI Agents. Over the past year at Grafana Labs, we built Agents and we needed a way to understand how they are performing, what are the costs associated with them, what's the error rate or time to the first token as well as how they are behaving. Grafana Staff Engineer, Ivana Hučková provides a deep dive demo on how Grafana AI Observability connects our experience building Agents with our experience building observability systems.

How to generate real-world load tests using Grafana Cloud k6 and production telemetry

For many development teams, a load test starts with a set of assumptions. You pick 100 virtual users because it sounds reasonable. You ramp for 30 seconds because that's what the tutorial showed. You set a 500ms threshold because it feels like a good target. The test passes, you ship the release, and production falls over at 6 p.m. on a Tuesday because your synthetic load never resembled how real users interact with your application.

Tempo 3.0 release: a new architecture for scale and lower TCO, TraceQL metrics GA, and more

Tempo started with a simple goal: make distributed tracing easier to run at scale. As tracing adoption has grown, however, so have the challenges, including higher data volumes, more complex architectures, and increasing demand for real-time insights directly from traces. Over the last year, we’ve been evolving Tempo’s architecture to meet that moment. And today, we’re sharing the results of those efforts with the release of Tempo 3.0.

Inside the Grafana AI Team Weekly: AI Observability for the OTel demo and LLMSpec (May 12, 2026)

This is an excerpt from a real AI team weekly meeting where we talk about the stuff we build and occasionally also demo them! In this one, Principal Software Engineer Sven Großmann demos how he integrated AI Observability into the OTel demo, complete with the guards feature he introduced last week, and Principal Software Engineer Yas Ekinci gives a rare glimpse of LLMSpec, the internal counterpart of the o11ybench benchmark that we use to evaluate Assistant.

What's New in Tempo 3.0

Tempo 3.0 introduces a major architectural shift that decouples the read and write paths, with Kafka handling durability on the write side and a new live store serving recent traces on the read side. Blocks are now written at a replication factor of one instead of three, significantly reducing storage overhead. This release also brings TraceQL metrics to general availability, adds comparison operators for filtering metric results at query time, and introduces a new Tempo CLI redact command for removing sensitive trace data on demand without waiting for retention to expire.

The inside scoop on alerting changes in Kubernetes Monitoring

Kubernetes Monitoring in Grafana Cloud comes out of the box with preconfigured alert rules that notify you about issues like CPU throttling, crash-looping pods, and nodes going offline. These rules are installed automatically when you set up the app, and they start evaluating immediately. But if you've recently reinstalled the Kubernetes Monitoring app and your alert notifications stopped arriving, or started looking different, you're not alone.