Operations | Monitoring | ITSM | DevOps | Cloud

Grafana 13 TL;DR - What's New (and Worth Your Time)

Grafana 13 is here! In this video, we walk through the biggest updates and improvements, from faster ways to build dashboards to new features that make Grafana easier to manage at scale. We cover things like: If you’ve ever struggled with broken dashboards, messy layouts, or just getting started from scratch, this release focuses on making those workflows a lot smoother. This is a TL;DR, so we’re just scratching the surface—but it should give you a solid sense of what’s new and what’s worth checking out.

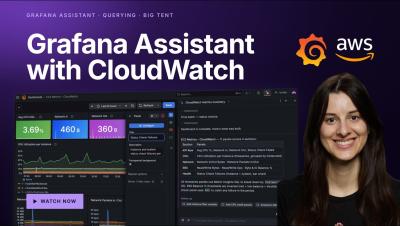
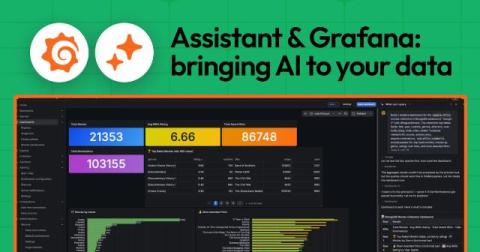
Grafana Assistant everywhere: Customize and connect to the AI agent to fit your specific needs

The ways you and your teams build and observe your systems are changing. It’s no longer just engineers looking at dashboards, or writing queries or config files. More often, it’s an agent interacting with the data, too, helping write code, run applications, investigate incidents, rightsize deployments, and more.

Monitor Databricks with Grafana Cloud for instant visibility into your workloads

If you're running Databricks workloads, you've probably asked yourself these types of questions: How much is this costing me? Why did that job fail last night? Why are my dashboard queries suddenly slow? We've been there, too. Databricks is fantastic for data engineering, ML, and analytics. But once you start running jobs, pipelines, and SQL queries at scale, you need a way to keep tabs on what's happening. That's why we built the Databricks integration for Grafana Cloud.

Grafana Alerting: Respond faster and get situational awareness with alert enrichment in Grafana Cloud

Alerts are meant to help teams respond quickly to problems, but too often they arrive without enough context to be immediately useful. An alert that says “CPU usage is high” still leaves the on-call engineer asking critical follow-up questions: Which service? Which environment? Where do I look next? Validating the alert and triaging the situation is the first step for every engineer. It's a manual step that takes time, extending every potential incident.

How to manage synthetic monitoring checks as code with Terraform and Grafana Cloud

As teams scale, managing synthetic monitoring checks manually in the UI becomes difficult and error-prone. When you're dealing with dozens of checks across multiple environments, teams experience inconsistent configurations, lack of version control, and difficulty tracking changes.