Operations | Monitoring | ITSM | DevOps | Cloud

Automate all the things: How to use Grafana Cloud's AI to relieve the operational burden

Continuous integration and continuous delivery (CI/CD) have dramatically changed how we ship software. But once code reaches production, the operational work is still surprisingly manual. Engineers continually monitor systems, investigate unexpected behavior, and decide which issues require action. And that is where the next opportunity for AI-driven automation lies. For example, in today's CI/CD workflows, someone refreshes the pipeline page to see whether the queue has moved.

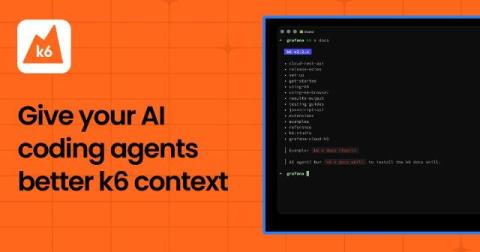
Meet GCX: Give Your AI Coding Agent Production Context

Your AI agents are only as good as the context it has. Without access to what's happening in production, it can only make educated guesses. Chapters: In this video, you'll meet GCX. The bridge between AI coding agents like Claude Code, Codex, Cursor, and your Grafana observability stack. You will learn how GCX securely gives AI agents access to metrics, logs, traces, dashboards, and other production telemetry so they can investigate issues, answer questions, and help you debug with real operational context.

Explore what's next in agentic operations: Introducing AI Week

Observability has traditionally been tacked on after your code hits production, but with agentic operations on the rise, that's no longer sustainable. Agents have dramatically increased the rate of change as they write more code, ship more changes, and operate more systems—all at a speed that compounds scale and complexity.

Meet Assistant Workspace: Full-page experience for Grafana Assistant

Introducing Assistant Workspace, a full-page surface for Grafana Assistant, built for the conversations that outgrow a sidebar. Dig into longer investigations, compare data side by side, and keep your train of thought in one place — then turn what you find into a dashboard without starting over. When a quick question becomes a real investigation, open it in Workspace and keep going. In this video, Ed Poole gives us a demo of how to use Workspace, including the use of canvases to see more information than before.

Smarter onboarding and planning with Grafana Assistant: How to ensure observability is baked in from the start

It's Monday afternoon and that feature you've been working on is mostly done. There's just one item still sitting untouched at the bottom of the ticket: "Add monitoring." You know you should. You also know the sprint ends tomorrow, nobody on the team is an observability expert, and figuring out what to measure—let alone how to write the PromQL for it—feels like a project all on its own. So it gets the same treatment it always does: "We'll add it when it breaks.".

OpenTelemetry eBPF Instrumentation (Grafana OTel Community Call #9)

In this episode of the Grafana OTel Community Call, we're exploring OpenTelemetry eBPF Instrumentation (OBI). OpenTelemetry eBPF Instrumentation (OBI) offers a powerful way to instrument applications at the system kernel level, capturing essential “RED metrics” — request rate, error rate, and duration — and network flows without requiring code changes, rebuilds, or redeployments. We will cover the project's architecture, discuss its origins as Grafana Beyla, and look ahead to the roadmap for language and runtime coverage.

How to monitor your Supabase projects: connect Grafana Cloud in one click

As AI agents accelerate software development and spin up applications at scale, visibility into what's happening behind the scenes, including query performance and database health, has never been more important. Gaining that level of insight requires observability that can keep pace.