Operations | Monitoring | ITSM | DevOps | Cloud

The latest News and Information on Application Performance Monitoring and related technologies.

Swift Package Manager for Raygun4Apple

Raygun4Apple can now be added to your project using the newer Swift Package Manager, instead of Cocopods. Raygun4Apple provides Crash Reporting and Real User Monitoring for iOS, tvOS & macOS. Users of Raygun4Apple can now add it to their project by adding a reference to our GitHub repository. If you are not familiar with Swift, You might also want to check out Apple’s guide on how to add Swift packages in xcode first.

Retrace - Much More Than Your Average APM Tool

Finding the root cause of application performance issues is the crux of every app troubleshooting exercise. So why don’t more APM tools provide great root cause analysis? The trouble is – pun intended – the cause of a slow application can come from different sources, many outside the application itself. So APM tools that focus on the ‘A’ may never truly find the root cause.

Augmenting APM with InfluxDB for Faster Issue Resolution

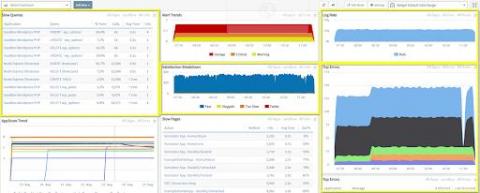
An enterprise IT company hosted a large industry event that drew attendees from all around the globe, including key technology leaders. Organizers knew that their IT offerings needed to be top notch to ensure attendees were happy when it came to event experience. The event application allowed attendees to browse and register for sessions at the event. So, organizers needed to be able to identify issues in real-time and fix them quickly.

What is N+1 query problem and how distributed tracing solves it?

N+1 query problem is a problem in database retrieval where the related entities of an object are queried individually from a database, leading to O(n) queries where n is the number of related entities of the object. Mouthful of words, I agree 🙂 Let’s take an example to illustrate what it means.

Top 15 Key Categories of Monitoring Metrics in Kubernetes and OpenShift Environments

Over the last couple of years, Kubernetes (often called K8s) has become the most popular and well-known container orchestration system for automating application deployment, scaling, and management. Scheduling containers at scale in a cloud-native ecosystem is central to the technology. Kubernetes itself is an open-source project, and as such presents challenges for many enterprises especially in regulated industries with strong security requirements and formal SLA commitments.

Logs Management made available in the latest release, podcasts, office hours & more - SigNal 16

Welcome back to our monthly product updates - SigNal! The latest release of SigNoz is now available with Logs management. You can use SigNoz as your one-stop open source observability solution with logs, metrics, and traces under a single pane of glass. We also participated in podcasts, held office hours, and got featured as one of the top promising startups in the DevOps ecosystem. Let’s see what humans at SigNoz were up to in the month of August 2022!
Sponsored Post

Core Web Vitals e-commerce analysis: part one

In 2021, Google introduced Core Web Vitals, three criteria to measure if a website is fast, stable, and responsive enough to give visitors a good digital experience. These factor into search ranking and have a powerful influence on customer behavior. But while Google has been urging the web performance community to get on board for more than two years, many are still falling short. We pulled data from the Chrome User Experience Report to conduct our own Core Web Vitals analysis, finding that even some of the largest e-commerce brands aren't passing these thresholds.

Building a one-stop Open Source Observability Platform | OpenObservability Podcast

Pranay, one of the the co-founders at SigNoz, was recently invited as a guest speaker by Jonah Kowall, CTO at Logz.io on his OpenObservability Podcast. In the podcast, Pranay talks about the mission behind SigNoz - unifying traces, metrics, and logs in a single platform and interface. He also shared anecdotes about the evolution of SigNoz since its inception, the community adoption, and its contribution to SigNoz.

Splunk APM Expands Code Profiling Capabilities with Several New GAs

We’re excited to share new Splunk capabilities to help measure how code performance impacts your services. Splunk APM’s AlwaysOn Profiling now supports.NET and Node.js applications for CPU profiling, and Java applications for memory profiling. AlwaysOn Profiling gives app developers and service owners code level visibility into resource bottlenecks by continuously profiling service performance, at minimal overhead.