Operations | Monitoring | ITSM | DevOps | Cloud

Claude Opus pricing in 2026: every model, every rate, and whether it's worth it

Claude Opus pricing is $4 per million input tokens and $20 per million output tokens on Claude Opus 5.5, the current model, with cache reads at $0.20 and batch jobs at $2/$10. Opus 5 and the legacy 4-series bill at $5/$25. The 1M context window carries no surcharge. Every Opus model Anthropic shipped in 2026 held the same line: $5 in, $25 out, per million tokens. Opus 4.6 in February, 4.7 in April, 4.8 in May, Opus 5 in July. Four releases, one price. On September 22, 2026, the line broke.

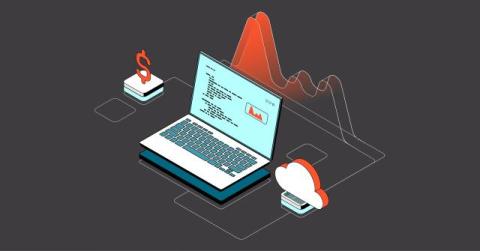
Shipped: Project this month's AI cost before the invoice closes

The question comes up on the 10th, the 15th, and again on the 25th. Where is AI spend going to end up this month? The invoice won’t tell you until it’s closes, and by then there’s nothing left to forecast. “If I’m looking at this on the 15th, I want to know where we’re going to land.” That’s how a finance lead put it during a persona session in September, and it’sthe whole job. You have half a month of real usage behind you.

Reducing Android scope-sync overhead in Sentry Flutter

Our SDK adds work to the app that installs it. It records recent app activity as breadcrumbs and keeps user information and other diagnostic data up to date. Changes to that information are called scope updates. On Android, we send those updates to a worker isolate, which passes them to the Sentry Android SDK. We found that the calling isolate and the worker both normalized the same data. The encoding step also created a JSON string and an extra byte buffer that we could avoid.

Run incident response in your FedRAMP High environment

Earlier this year, Datadog for Government achieved FedRAMP High certification, extending our GovCloud environment (US1-FED) to the federal government’s most sensitive civilian workloads. That certification now covers Datadog Incident Response, bringing paging, incident coordination, automation, and postmortem workflows into US1-FED. When a government system goes down, responders need to reach the right people, coordinate a fix, and keep stakeholders informed.

Define user actions on your web app with visual labeling in Product Analytics

Adding or renaming a product event has traditionally meant creating an engineering ticket. Datadog Product Analytics uses the same SDKs and configuration as Real User Monitoring (RUM), and those SDKs autocapture actions such as clicks and taps. But an automatically generated action name describes the element rather than the user intent behind it.

10 Best AI Agent Infrastructure Platforms in 2026

AI agent infrastructure is the set of platforms that run agents and the code they write. It has three layers: sandboxes that isolate untrusted, model-generated code, runtimes that run the agent and its services in production, and orchestration layers that save an agent’s progress so a long run can resume after a failure. Most production agents need more than one layer. This guide compares 10 platforms across all three, with isolation, state, deployment, and compliance for each.

Where Jev fits in ops

If you're using agents and MCPs to get a better understanding of your environment or work through an investigation, you can get a lot of useful information back. You can pull logs, look at recent changes, and check how services are configured, but you're still the one deciding what to do with all of it. That part of the process still lives in your head. To see where Jev might fit, look at decisions your team already makes and work backwards from them.

How to Monitor Database Backups and Get Alerted When One Fails

To monitor a database backup, make the backup script check its own output (exit code, file size, a table you know must be there) and ping a heartbeat URL only when all of it passed. If that ping does not arrive on schedule, you get an alert. A backup that failed, wrote an empty file, hung, or never started all look the same from the outside: no success ping.

How to Monitor Celery Beat and Catch Missed Periodic Tasks

To monitor Celery beat, give each periodic task its own heartbeat URL and ping it from the worker when the task succeeds, with a task_success signal handler. If beat is down, the message sits in a queue no worker reads, or the task raises, the ping does not arrive and you get an alert. The trap is that beat only publishes messages: its log prints Sending due task on schedule whether or not anything ever runs the task.