The latest News and Information on Monitoring for Websites, Applications, APIs, Infrastructure, and other technologies.
The blessing and curse of cloud computing is flexibility. Now more than ever, companies leveraging the cloud are being revered for their ability to scale up usage of critical applications remotely for employees working from home, while in the same breath lambasted as IT costs sky-rocket. And in the midst of soaring usage, capacity, and cost come budget-cuts to fend off any other necessary evils during this challenging time.
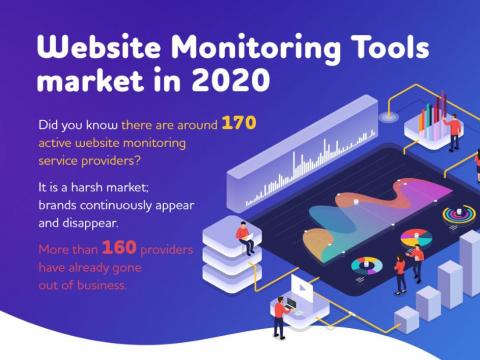
How many website monitoring service providers are there, worldwide? Where are they from? What features do they offer? How much do they charge? You can learn the answers to these questions and much more from our infographic below. In May 2020, we conducted research analysing and comparing website monitoring offers from all over the world. Here is a graphical presentation of what we found out.
The entire country of China’s internet connectivity is shielded by the Great Firewall (GFW). There are three state-owned ISP providers, China Unicom, China Telecom, and China Mobile, that control internet in China. Essentially, all traffic between China and the rest of the world goes through a few national level and a handful of core level access points in different regions.
As InfluxDB continues to grow and improve, more and more developers are using it as the platform of choice for their own solutions. Most of these solutions range from filling niche internal needs to solving common problems faced by entire industries, but some of them are extraordinary for their impact, innovation, or how much they push the boundaries of what is possible with the technology. In order to recognize those, we are launching the InfluxDB Inventors program.
Serverless computing has taken off in recent years with more efficient cloud services. AWS Lambda is a great example of this, where provisioning and management of resources happens from the service’s end. You only have to deal with the code. This article will give a brief overview of AWS Lambda in contrast to EC2 instances, then walk through shipping AWS Lambda metrics to Logz.io.
Today, we’ve added a magic dashboard to the Node integration that shows you the performance and volume of your PostgreSQL queries.
Earlier this year, we added a Dashboard API to Cloud Monitoring, allowing you to manage custom dashboards and charts programmatically, in addition to managing them with the Google Cloud Console. Since then, you’ve asked us to provide more sample dashboard templates that target specific Google Cloud services. Many of you have also asked us to provide a Terraform module to help you set up an automated deployment process.
In this write-up of our special webinar, we'll give you an insider’s look into how we took control of our Azure costs, and how you can do the same. We’ll take you through how we identified the problems and implemented lasting solutions to keep things under control. You’ll get to hear from our key stakeholders involved - Finance, Management, IT, Engineering.