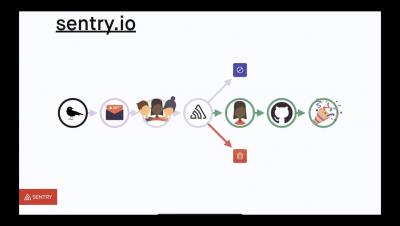
The latest News and Information on Monitoring for Websites, Applications, APIs, Infrastructure, and other technologies.
Using dashboards in Stackdriver Cloud Monitoring makes it easy to track critical metrics across time. Dashboards can, for example, provide visualizations to help debug high latency in your application or track key metrics for your applications. Creating dashboards by hand in the Monitoring UI can be a time-consuming process, which may require many iterations. Once dashboards are created, you can save time by using them in multiple Workspaces within your organization.
Serverless applications, due to their distributed nature, are often stuck having to reinvent the wheel. While small utility scripts and functions are often easily instrumented and monitored, anything of a transactional nature will need to implement special code to provide developers with common tools like stack traces, atomicity, and other patterns that rely on a singular flow of control.
Making sure that your ElastAlert yaml file is formatted and configured correctly. All of the below points will prevent alerts from being fired but there may not be an error message associated with the problem. It is possible you may need to contact support to investigate this issue for you. Make sure to proof read the rule you have written to ensure that it is what you expect to see as most of the issues regarding ElastAlert not working correctly is related to the points above.
In the Data Age 2025 report, worldwide data is expected to grow 61% to 175 zettabytes by 2025. The enterprise sector, in particular, generates more than 30% each year. To be ready for a digital future, consider the scaling strategy of data infrastructure beforehand. Scale-up and scale-out are the main ways to add capacity to your infrastructure.
For all its benefits, Virtualization Desktop Infrastructure (VDI) continues to be a massive headache for many enterprise technology teams. From improper personas and sizing, long logon times, hangs, lost sessions, freezes and crashes—often one small mistake in a virtualized environment can set your entire enterprise ablaze.
Oh man, did I get ahead of myself in my last post! I started chatting tools, and I realize now that I really should have been talking more about why I’m using Sensu and Gremlin. But it didn’t occur to me until last year at Monitorama. John Allspaw gave the keynote talk (Taking Human Performance Seriously). While you can watch the talk here, I’ll highlight a few points...