Operations | Monitoring | ITSM | DevOps | Cloud
July 2022
Lumigo Joins AWS on Air June 2022
Not 3 pillars but a single whole to help customers solve issues faster
Monitor Citrix Hypervisor performance with Datadog
Citrix Hypervisor, formerly known as Citrix XenServer, is a type 1 hypervisor that enables organizations to run and manage an entire virtual infrastructure—including VMs, virtual desktops, and virtual applications. Organizations can also use Citrix Hypervisor to optionally host these virtual workloads with higher availability and flexibility by implementing managed server groups called resource pools.
User Experience (UX) Design: The Definitive Beginner's Guide
The importance of UX design is on the rise. Customer expectations have accelerated in the post-pandemic world. According to PwC, even when people love a company or a product, 17% of US consumers will walk away after just one bad experience. So follow along for the key considerations in this important space.
GigaOm, Again Names Broadcom Leader in Radar Report for Network Observability, 2022
Download your complimentary copy of the 2022 GigaOm Radar Report For Network Observability here. As the 2022 GigaOm Radar Report for Network Observability states, "Network observability is a category of platforms and tools that go beyond device-centric network monitoring to provide truly relevant, end-to-end visibility and intelligence for all the traffic in your network, whether on-premises, in the cloud, or anywhere else.".
StackPod: Jujhar Singh of Thoughtworks on Why Technology Is Always About People
A few episodes ago, we talked with fellow podcaster and tech evangelist Dotan Horovits. During that episode, Dotan shared that he wrote a blog post with Jujhar Singh called “How Much Observability Is Enough?” which is definitely a recommended read if you’re implementing observability and feeling overwhelmed. After reading this article, we were eager to invite Jujhar to the StackPod as well, to dive into this topic a bit more.
Adding Code Tags to Your OpenTelemetry Spans
In this article, I’m going to walk you through adding attributes to your spans in.NET that contain information about the code that generated the span. We’ll also look at ways to do this automatically using a library I’ve created.
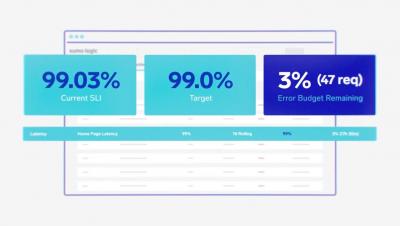
3 reasons why reporting SLOs at scale is hard
I figure you’re doing okay with SquaredUp. It still works for you. Maybe you feel there are a couple of things that could be improved, but it’s not a big deal. So you’ve not upgraded yet. And frankly, because it all works fine and is still doing its job, you haven’t kept up to date on all the latest features rolled out in the SquaredUp updates. But…you’re missing out – on a lot.
Basic Docker Commands | Tutorial for Beginners | Useful List with Examples -Sematext
General Availability: Experience-Driven NetOps, DX NetOps 22.2
DX NetOps 22.2 continues to deliver our industry-leading visibility, scale and modern network coverage...now beyond the network edge to quickly and easily isolate end-user experience impact of managed or unmanaged network changes.
Value Calculator
Introduction to reliability management
Alerts Builder Demo | Setup powerful alerts on the go | SigNoz
How to monitor Apache Flink with OpenTelemetry
3 Ways Educational Institutions Can Avoid IT Tool Sprawl
Improve App Performance with Suspect Spans and Caching | Snack of the Week
Store and manage Datadog configurations as code with Performetriks' offering in the Datadog Marketplace
Performetriks is a service provider that specializes in assessing and improving application performance and security for enterprise clients. To streamline these processes, Performetriks offers frameworks for automation, benchmarking, and security testing, as well as tools that evaluate and improve application performance. This includes their Composer tool, an on-prem piece of software that allows teams to more efficiently manage monitoring settings by storing, tracking, and managing them as code.
3 Pros and Cons of Amazon CloudWatch
How intelligent Automation helps in simplifying the customer service experience?
When running a business, the most crucial aspect for any entrepreneur or organization is to provide an exceptional customer experience (CX) and grow the business efficiently. Not only designing the best product or services but also a lot of things that an organization needs to take care of for delivering quality CX. In today’s digital world, customer retention is as necessary as customer acquisition, and organizations are working towards this path.
How Grafana Mimir helped Pipedrive overcome Prometheus scalability limits
Karl-Martin Karlson has been working on Pipedrive’s observability team for more than four years, implementing and supporting several observability platforms such as Grafana, Prometheus, Graylog, and New Relic. In sales, as in life, you can’t control your results — but you can control your actions. With that in mind, a team of sales professionals set out in 2010 to build a customer relationship management (CRM) tool that helps users visualize their sales processes and get more done.
Making the Most Out of PromQL with VMware Tanzu Observability
Rachna Srivastava contributed to this blog post. Given the popularity of Prometheus and the open source community behind it, it’s no surprise that customers often ask about support for the Prometheus Query Language, PromQL. Many users are already comfortable with PromQL but need the additional performance and scalability of the VMware Tanzu Observability platform.
How Robotic Data Automation Fabric (RDAF) Could Automate Data Pipelines
An Introduction to B-Tree and Hash Indexes in PostgreSQL
How to Scale with DX UIM's Monitoring Configuration Service, Part 2: Key Concepts
To contend with their escalating, intensifying demands, today’s operations teams must constantly be on the quest to boost efficiency. In my prior post, I offered a high-level introduction to DX Unified Infrastructure Management (DX UIM) Monitoring Configuration Service (MCS), outlining how its key features can significantly streamline administration in large-scale enterprise environments. In this follow up post, I’ll provide more details for teams looking to start working with MCS.
What Is Website Regression Testing and How Can Synthetic User Journeys Help?
Website regression testing is a form of software testing that helps to identify and fix problems with website content, functionality, and accessibility. It is a vital part of any testing strategy, as it can help to ensure that the website continues to meet user expectations. Website regression testing typically involves running a series of tests against the website to check for any issues. The tests can be performed by an automated system or manually by testers on the development team.
Research Report Observability at the Speed of Innovation 2022
AppSignal for Ruby Gem 3.1: MRI VM Magic Dashboard
We're very excited to release AppSignal for Ruby gem 3.1, which adds a Magic Dashboard for MRI VM stats. By upgrading to the latest Ruby gem, you'll automatically get this dashboard created in AppSignal as soon as data from the new probe starts flowing in. Here's what you'll see: Magic Dashboards give people amazing insights into applications with zero setup. They work automagically to give your team performance insights into gems like Puma, Sidekiq, ActiveJob, ActionMailer, and others.
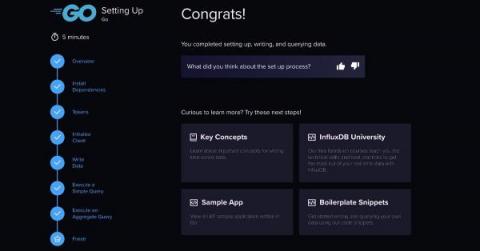
July Monthly Product Update - New Resources to Get Started with InfluxDB and Go
We love to write and ship code to help developers bring their ideas and projects to life. That’s why we’re constantly working on improving our product to meet developers wherever they are, to ensure their happiness, and accelerate Time to Awesome. This is the third in a blog series covering our product’s latest features — features that we think will save you time and effort when building with time series and InfluxDB.
BindPlane OP Build Process - Using Goreleaser
Open Source APM Tools
Application performance monitoring software is a basic need for most tech-related companies in the world. APM software is built by tech companies to help in the performance management of the application. Open Source APM tools are those whose source code is publicly accessible. In fact, for any software which is open source, the source code of the application must be publicly accessible on Github or any other website.
3 ways to prevent mapping explosion in Elasticsearch
Looking Beyond SNMP
In a previous blog post, we dove into the wayback machine and looked at Simple Network Management Protocol (SNMP) Traps – a technology that allows devices (including network devices) to send alerts when specific thresholds have been reached. In this post, we are going to be a bit more forward looking and discuss some technologies that will, in theory, replace SNMP. It is important to keep in mind that the demise of SNMP has been predicted for years (actually decades).
Free Logon Simulator for AVD (Azure Virtual Desktop) - Now Available!
I’m excited to be able to announce the availability of the new eG Enterprise Express Logon Simulator for AVD that now provides any AVD administrator with a no-risk, powerful “synthetic” monitoring tool to track logon performance and failures.Slow logon performance has been one of the most challenging user complaints that VDI and digital workspace administrators and support teams have to deal with.
Quick Bytes - Getting started with Lumigo
Full Stack Visibility to Find the Root Cause of Slow
An app that works as expected is great, but if expected means a beachball for 10 seconds before the page loads, that’s… not so great. Customers want it all; an application that is stable and fast… Luckily, Sentry does more than tell you when something is broken in your code, it also tells you what’s slow and how to fix it.
4 Killer Coralogix Tracing Features
Tracing is often the last thought in any observability strategy. While engineers prioritize logs and metrics, tracing is truly the hallmark of a mature observability platform, but it is also the most difficult to implement. Once tracing is in place, engineers typically discover something else – many tracing solutions aren’t particularly feature-rich.
6 Advanced Tips to Get More From Google Analytics
IBM MQ Interview Questions
IBM MQ is a family of message-oriented middleware products that IBM launched in December 1993. It was originally called MQSeries and was renamed WebSphere MQ in 2002 to join the suite of WebSphere products. In April 2014, it was renamed IBM MQ. The products included in the MQ family are IBM MQ, IBM MQ Advanced, IBM MQ Appliance, IBM MQ for z/OS, and IBM MQ on IBM Cloud. MQ stands for MESSAGING AND QUEUEING.
How I made an impact in my first 100 days at Helios
Joining a new dev team can be an exciting but somewhat intimidating experience. On one hand, you’re jumping into new adventures and opportunities. On the other hand, most onboarding experiences are fraught with stress and a sense of overwhelming from how much you have to learn, fast, to be able to contribute to your new team. To be honest, I’d never worked at a place where the developer onboarding experience was particularly memorable – until I joined Helios.
Why is infrastructure monitoring important?
Infrastructure monitoring is used to collect health and performance data from servers, virtual machines, containers, databases, and other backend components in a tech stack.
Gain unprecedented monitoring visibility with AIOps
AIOps (artificial intelligence in IT operations) in monitoring refers to the convergence of artificial intelligence, machine learning, and data analytics to make IT monitoring a responsive, intelligent, and agile business function. AIOps is not an alternative to DevOps but a great partner to it that provides intelligent insights when integrated with every stage of the cycle.
DEJ Market Study Names Catchpoint a Leading Vendor
Digital transformation has been foundational to any forward-looking business and organizational strategy for many years, but never more so than today. In the digital era, centering an innovative approach to technology at the heart of your business is essential to credibility, impact, growth and efficiency. However, ensuring readiness to adapt to future market, customer or employee needs demands continuous effort and re-appraisal.
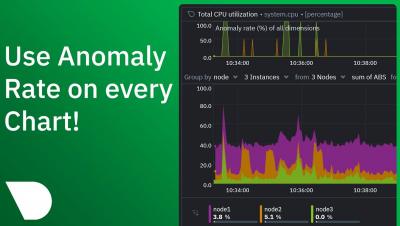
How to use Anomaly Rate on every chart!
Quick Start: Telegraf's Starlark Processor Plugin
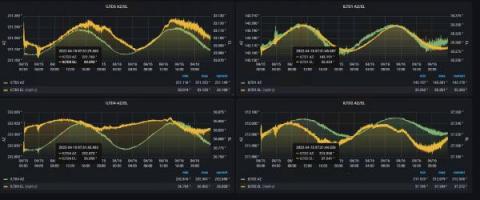
After a mortgage payment, energy costs are typically the largest household expense. In my case it was an easy decision to install solar panels, but I wanted to perform in-depth analyses with historical data. Deploying monitoring sensors was straightforward; collecting and processing the raw data became the main challenge. Telegraf and InfluxDB are ideal choices for managing time series data. Although I had no prior experience, a Docker instance of Telegraf was onboarded in no time.
SOC 2: Data Security For Cloud-Based Observability
As more companies adopt SaaS services over on-premise delivery models, there is a natural concern around data security and platform availability. Words on a vendor’s website can provide insights to prospective customers on the process and policies that companies have in place to alleviate these concerns. However, the old adage of “actions speak louder than words” does apply. Trust in a website’s words only goes so far.
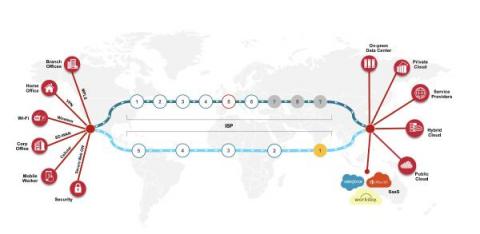
Hybrid Network Triage for the New Enterprise Network
We all know that cloud and SaaS adoption continues to grow rapidly, often outpacing budgets. In fact, spending on IaaS and SaaS exceeded budgets in more than 40% of organizations in 2021. As a result, network traffic is now spending much more time on the internet than in our own data centers. The internet has become the new enterprise network.
solr-reindexer: Quick Way to Reindex to a New Collection
If you’re using Solr, for sure there are times when you change the schema and need to reindex. Quite often the source of truth is a database, so you can use streaming expressions via the JDBC source to reindex. But sometimes that’s not possible or adds too much load to the DB. So how can we use Solr itself as a source?
"Why Are My Tests So Slow?" A List of Likely Suspects, Anti-Patterns, and Unresolved Personal Trauma
“Lead time to deploy” means the interval from when the code gets written to when it’s been deployed to production. It has also been described as “how long it takes you to run CI/CD.” How important is it? It’s nigh-on impossible to have a high-performing team if you have a long lead time, and shortening your lead time makes your team perform better, both directly and indirectly.
Welcome to the Future of Data Search & Exploration
You have more data coming at you than ever before. Over the next five years, the total amount of digital data is going to be more than twice the amount of data created since the advent of digital storage. With the success of your company often determined by how you anticipate and respond to threats – and leverage meaningful insights – you need the ability to quickly search and find insights in your data, despite this increasing deluge of information.
New in Grafana Loki 2.6: multi-tenant queries and targeted log line deletion
Grafana Loki 2.6 is here! In addition to improvements in query performance, we are excited to introduce two key features in Grafana Loki: cross-tenant query federation and targeted deletes.
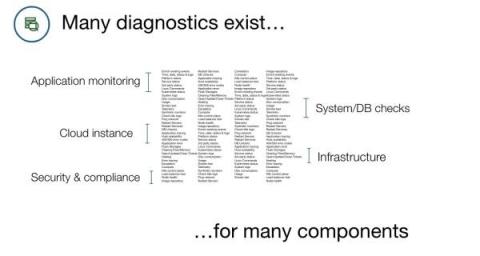
Automating Common Diagnostics for Kubernetes, Linux, and other Common Components
This is the second piece in a series about automated diagnostics, a common use case for the PagerDuty Process Automation portfolio. In the last piece, we talked about the basics around automated diagnostics and how teams can use the solution to reduce escalations to specialists and empower responders to take action faster. In this blog, we’re going to talk about some basic diagnostics examples for components that are most relevant to our users.
Why Digital Employee Experience (DEX) Matters During Economic Downturns
We all know the story by now: we’ve entered a new era of work. And no, we’re not just referring to the pandemic, which forced businesses to accelerate digital transformation projects at an unprecedented speed.
Best Practices to Maximize Cloud ROI
As businesses shift to a digital-first environment, cloud computing will play a dominant role in delivering greater flexibility and faster innovation. In a recent report by Deloitte, nearly 90% of US-based senior decision makers proclaim cloud to be the cornerstone of their digital strategy. Covid accelerated cloud migration initiatives, with no signs of slowing down. Gartner forecasts worldwide end-user spend on public cloud services will grow by 20.4% in 2022 to a total of $494.7 billion.
Exporting Splunk Data at Scale: See a Need, Fill a Need
The Core Splunk platform is rightfully recognized as having sparked the log analytics revolution when viewed through the lenses of ingest, search speed, scale, and usability. Their original approach leveraged a MapReduce approach, and it still stores the ingested data on disk in a collection of flat files organized as “buckets.” These immutable buckets are not human-readable and largely consist of the original raw data, indexes (.tsidx files), and a bit of metadata.
Retrace Power User Tips and Tricks - Advanced Metrics and Reporting
Monitoring and reporting on your most important business metrics is a fundamental part of any APM or ITIM solution. Our Retrace Power User Tips and Tricks series has already looked at “Error and Log Management” functionalities. We’ve discussed useful, advanced features for monitoring app performance in our “Extending APM” post. In this latest edition, let’s take a look at how power users capture advanced server and application metrics.
The Papertrail SaaS Add-On in DigitalOcean Centralizes Everything You Need for Log Management
Monitorama 2022: the good, the bad and the beautiful (Part 1)
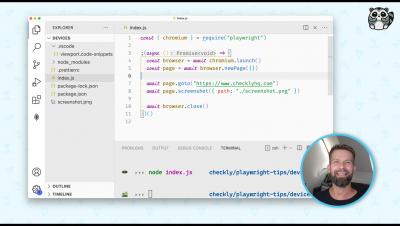
How to speed up your Playwright scripts with request interception
How to update your Pandora FMS environment using RPM and Tarball packages.
Google's outage on the UK's hottest day of the year
We’ve all heard the jokes about how us Brits can’t handle the hot weather but when the UK hit record highs in July this year, we have to admit that we really did struggle. No more so than our friends over at Google. Google isn’t a stranger to the occasional outage and website downtime, after seeing Google Maps go down in May earlier this year. But this time, the outage was apparently due to the soaring temperatures we were experiencing.
Websites that have suffered downtime in July
You might have heard us say it before but downtime really does happen to any website, anywhere. Website downtime essentially doesn’t discriminate; it doesn’t matter if you’re a huge multi-billion dollar company or if you’re a start-up finding your feet in the online world. Downtime happens to the best of us. So to really drive this point home, we’ve put together the websites that have suffered downtime this June and how they dealt with the issue.
5 Reasons to Add Network Monitoring to Your Budget
Predictive Analytics - The What, How and Why?
The Exoprise marketing team sat down with their CEO, Jason Lieblich, to discuss predictive analytics, market trends, and the technology’s usage in troubleshooting network issues.
Kafka Cloud Service: Top 6 Alternatives for Enterprises 2022
Kafka is an open-source program for storing, reading, and analyzing streaming data. It is open-source, which means it’s free-to-use amongst a big community of users and developers contributing to new features, upgrades, and support on a regular basis. Kafka can run on multiple servers as a distributed system, allowing it to take advantage of each server’s processing power and storage capacity.
What is Real User Monitoring (RUM)? Detailed Guide with Use Cases and Benefits
Near-instantaneous performance. Silky smooth user experience. This is what your digital users are expecting from your web application. If they perceive slowness or encounter failures in their user experience, they will readily switch to a competitor. Failures are a fact of life. The SRE (site reliability engineering) movement is helping craft modern digital systems that are engineered for resilience to failures.
Uptime.com's Guide to Weathering Outage Season
It’s already been a stormy quarter with notable outages exceeding 240 hours. This spring saw two substantial cloud provider outages between Atlassian’s 9 day outage and shorter outages with CloudFlare. As reliance on cloud-based tools and services increases you should be asking, what are the best ways to monitor your site and make sure the data you’re reporting accurately reflects your site’s downtime and SLAs?
Kubernetes on the Edge: Getting Started with KubeEdge and Kubernetes for Edge Computing
Developers are always trying to improve the reliability and performance of their software, while at the same time reducing their own costs when possible. One way to accomplish this is edge computing and it’s gaining rapid adoption across industries. According to Gartner, only 10% of data today is being created and processed outside of traditional data centers.
Ask Miss O11y: My Manager Won't Let Me Spend Any Time Instrumenting My Code
My organization doesn’t want me spending time on instrumenting my product. What can I do? Thanks for the question! You’ll be relieved to hear that you’re in the majority, and also that there are quick (and easy) steps you can do to prove that instrumenting your code is worthwhile.
Optimizing Security and Digital Experiences: Why User Experience Monitoring is Key
For just about any organization, there’s a balance that has to be struck between absolute security and absolute convenience. Seemingly, every new innovation that increases convenience also introduces new risks. On the other hand, every safeguard instituted can also create complexity, delays, or in some other way diminish the user experience. Either way, businesses are exposed, whether to the catastrophic consequences of breaches, or of an erosion of user productivity and customer retention.
What's new in Sysdig - July 2022
It’s time for another publication of What’s New in Sysdig in 2022! I’m in charge of the “What’s new in Sysdig” blog for the month of July! Hello, I’m Tom Linkin, a Sr. Solutions Engineer based in the Poconos up in Pennsylvania. I joined the incredible group of people at Sysdig nine months ago and have been helping support sales in the greater NYC region ever since.
Celebrating IT's champions: our sysadmins
Sysadmins, short for system administrators, serve as a crucial subset of IT engineers and support staff and are often under-appreciated. Sysadmins are the lynchpins that provide continuity, performance, and security to the systems that connect every corner of the world. When COVID-19 scattered large workforces in offices across small home office networks, organizations relied on their sysadmins more than ever before to maintain work processes.
What Is Application Dependency Mapping?
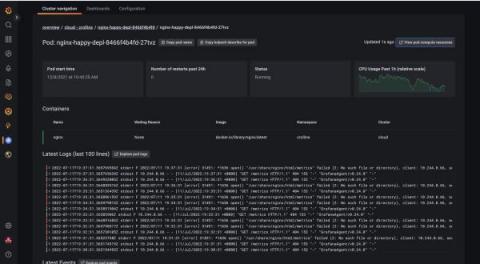
Introducing instant Kubernetes logging with Kubernetes Monitoring in Grafana Cloud
Kubernetes, Prometheus, and Grafana are a trio of technologies that have transformed cloud native development. However, despite how powerful these three technologies are, developers still face gaps in the process of implementing a mature Kubernetes environment.
Driving Innovation Aligned with the AWS Security Competency Re-launch
Logz.io recently obtained the Amazon Web Services (AWS) Security Competency for our Cloud SIEM. We are thrilled to support the re-launch of the AWS Security Competency, as clearly the only way to combat today’s cybersecurity challenges is to modernize your analytics platform to respond to today’s evolving threat landscape.
SIP Trunk with Teams Phone Explained
SIP trunking is a great way to improve your business’s communication system. It is cost effective and scalable, and it offers many features that traditional systems do not. In this article, we’ll give you a quick introduction to SIP trunking, how it can benefit your business and how to easily monitor it when linked to Microsoft Teams.
Flow Alerts Overview
How to monitor Jetty using OpenTelemetry
What's on our radar: APM expert shares A-list app performance monitoring content
Snapshot of the application performance monitoring (APM) content that AppDynamics’ observability technical expert, Aaron Schifman finds valuable.
Extending Visibility Beyond the Edge | Discovering Observability: Session 3
Masking PII: Minimize Your Risk and Stay Out of Trouble
Consumers expect their personal information to be safe in your hands as they use your apps, services, and stores. Even in-person retailers collect customer data for loyalty programs, shopping history, and more. In addition, regulators and auditors — and while we’re at it, let’s add investors, board members, and partners to the list of people who expect all customer data to be secure at all times.
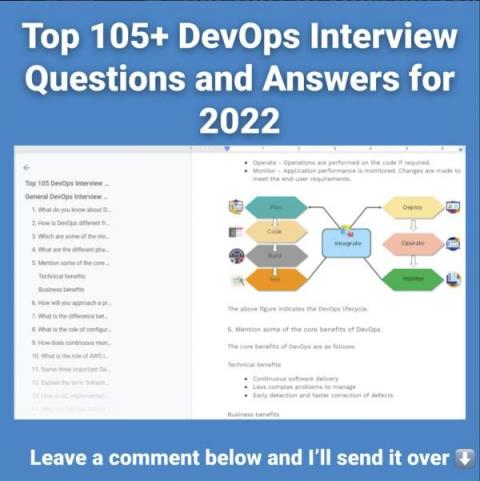
Top 105+ DevOps Interview Questions and Answers for 2022 ?
Thinking about breaking into the DevOps space? DevOps has become one of the biggest tech buzzwords. Tech giants – like Facebook, Amazon, or Google – have numerous open positions for DevOps engineers. But it is a competitive field to break into. So if you’ve been prepping for DevOps roles, here are some of the most common interview questions (and potential answers) to expect, including.
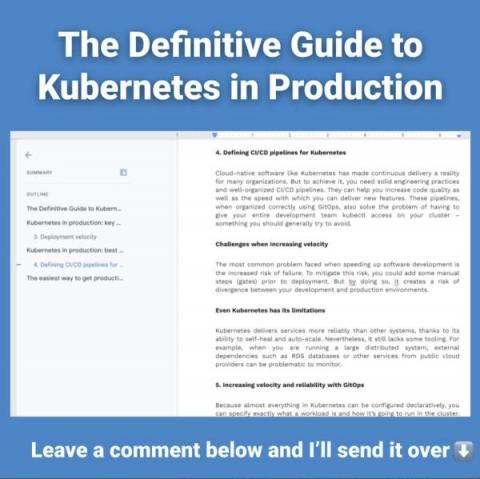
The Definitive Guide to Kubernetes in Production
Kubernetes has quickly grown in popularity, also due to its flexibility and power as a container orchestration system. It can scale virtually indefinitely, which has enabled it to provide the backbone for many of the world’s most popular online services. Plus, it is accessible and easy to set up. But, Kubernetes also comes with a few challenges in production.
Black Friday log management (with the Elastic Stack) checklist
For this Black Friday, Sematext wishes you: Now seriously, applications tend to generate a lot more logs on Black Friday, and they also tend to break down more – making those logs even more precious. If you’re using the Elastic Stack for log management, in this post we’ll share some tips and tricks to prepare you for this extra traffic.
Full-Stack Observability Guide
Like cloud-native and DevOps, full-stack observability is one of those software development terms that can sound like an empty buzzword. Look past the jargon, and you’ll find considerable value to be unlocked from building observability into each layer of your software stack. Before we get into the details of observability, let’s take a moment to discuss the context.
Key metrics for monitoring Cilium
Cilium is a Container Network Interface (CNI) for securing and load-balancing network traffic in your Kubernetes environment. As a CNI provider, Cilium extends the orchestrator’s existing network capabilities by giving teams more control over how they build their applications and monitor traffic. For example, vanilla Kubernetes installations typically rely on traditional firewalls and Linux-based network utilities like iptables to filter pod-to-pod traffic by an IP address or port.
Monitor Cilium and Kubernetes performance with Hubble
In Part 1, we looked at some key metrics for monitoring the health and performance of your Cilium-managed Kubernetes clusters and network. In this post, we’ll look at how Hubble enables you to visualize network traffic via a CLI and user interface. But first, we’ll briefly look at Hubble’s underlying infrastructure and how it provides visibility into your environment.
Monitor Cilium-managed infrastructure with Datadog
In Part 2 of this series, we showed how Hubble, Cilium’s observability platform, enables you to view network-level details about service dependencies and traffic flows. Cilium also integrates with various standalone monitoring tools, so you can track the other key metrics discussed in Part 1. But since the platform is an integral part of your infrastructure, you need the ability to easily correlate Cilium network and resource metrics with data from your Kubernetes resources.
Apache Kafka simply explained
Learning Apache Kafka doesn’t have to be difficult. Read on to get a friendly explanation of the Apache Kafka fundamentals.
Logz.io Cloud SIEM Honored with 6 Summer 2022 G2 Badges!
For Summer 2022, Logz.io is thrilled to have earned six G2 Research Badges for our Cloud SIEM offering. These honors highlighted the ease of setup, ease of use, and high performance that we provide our customers through Cloud SIEM. G2 Research is a tech marketplace where people can discover, review, and manage the software they need to reach their potential.
Building a Resilient System: Our Journey to Observability at Intercom
At Intercom, we focus on customer experience above all—our service’s availability and performance is our top priority. That requires a strong culture of observability across our teams and systems. As a result, we invest a lot in the reliability of our application. But unpredictable failures are inevitable, and when they happen it’s humans that fix them. We operate a socio-technical system, and its ability to recover when faced with adversity is called resilience.
Operationalizing Experience in the New Enterprise Network
With the latest release of our network monitoring and digital experience monitoring software, we are proud to introduce an industry-first Experience-Driven NetOps solution, taking network visibility to the new enterprise network, expanding beyond the network edge to ISP and cloud providers. The DX NetOps 22.2 release will enable teams to operationalize the new enterprise network, focus on user experience, and avoid chasing utilization spikes.
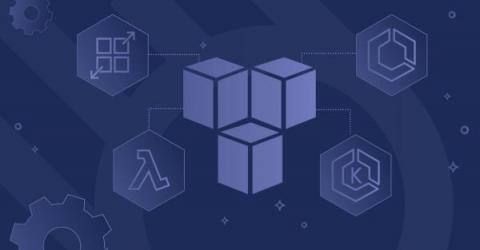
Four Ways to Run Containers on AWS
AWS provides multiple ways to deploy containerized applications. From small, ready-made WordPress instances on Lightsail, to managed Kubernetes clusters running hundreds of instances across multiple availability zones. When deciding on the architecture of your application, you should consider building it serverless. Being free from (virtual) server management enables you to focus more on your unique business logic while reducing your operational costs and increasing your speed to market.
The Papertrail SaaS Add-On in DigitalOcean Centralizes Everything You Need for Log Management
The Current State of Workload Portability
Have you considered cloud portability, i.e., the ability to easily move workloads between on-premises systems and across multiple cloud service providers (CSPs)? The idea is that workloads should run in the environment that delivers the most value for your organization, but as that “optimal” environment can change over time, you need to be able to move your workloads accordingly.
LIZY video testimonial with Lumigo
On demand webinar: Containers and Lambdas
Masking Data with Cribl Stream
Serverless Monitoring In The Cloud With The observIQ Distro for OpenTelemetry
How To Read Flame Charts and Percentiles
SAPInsider 2022 - Operations automation for SAP
Executive Lookout: Observing Observability
Splunk Observability is incredibly good at details! Many of us use it as a metaphorical microscope through which we observe our software. But how do you observe the long-term trends and usage of that microscope? There are numerous organization-level metrics provided in Splunk Observability that can be used to chart organization-level concerns. These can be leveraged in various ways to understand things like uptake, billing and just how much value Observability is providing.
No Startup Is a Startup Forever - How to Navigate Scaling Your Company
In the last five years, Cribl has gone from 3 employees to more than 400 employees — it’s been an incredible, crazy, difficult, tiring, fucking awesome ride. It’s also been an emotional roller coaster with all the ups and downs, but despite all the challenges, things have been trending upwards.
Using LM Envision to Monitor Istio-Managed Microservices
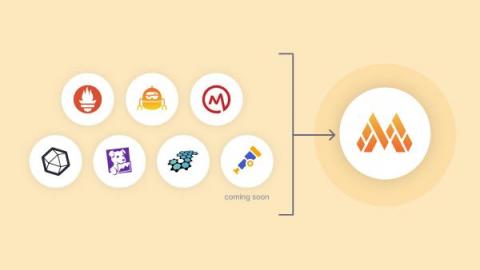
New in Grafana Mimir: Ingest Graphite, Datadog, Influx, and Prometheus metrics into a single storage backend
In March 2022, Grafana Labs released Grafana Mimir, the most scalable, most performant open source time series database in the world. Mimir provides significant scale — 1 billion active series and beyond — with easy deployment, multi-tenancy, durable storage, high availability, and super fast query performance. From launch, Grafana Mimir could natively consume Prometheus metrics.
The Essential List of Spring Boot Annotations and Their Use Cases
The Spring framework is a robust server-side framework for modern Java-based enterprise applications. Since its introduction in 2003, its advantages have made it one of the most dominant server-side frameworks among many organizations. According to a research study by Snyk in 2020 on the usage of the server-side web frameworks, 50% of the respondents have said they use Spring Boot, and 31% of the respondents use Spring MVC.
More Granular Control Over Your Synthetic Monitoring
The Uptime.com monitoring Transaction check just got a few upgrades bringing more granular control to users with complex checks. If you have found yourself struggling with performance in synthetic monitoring, this upgrade is for you. Plus better diagnostic tools to analyze every request we encountered. Available to every Uptime.com user, today we want to introduce these important tools and walk though some use cases that will help you get the most out of them.
Monitor CockroachDB performance metrics with Datadog
CockroachDB is a highly resilient distributed SQL database developed by Cockroach Labs. CockroachDB assures ACID semantics and aims to make it easy to scale horizontally by adding nodes instead of manually sharding the database. Built to be resilient (much like its namesake insect) and highly available as it scales, CockroachDB readily recovers from node failures by repairing and rebalancing automatically.
Info-Tech Research report 2022: 98% of customers say they love OpManager!
Choosing the best network monitoring tool can be mind boggling. Today, network admins need more than a bare-bones network management system (NMS). They need a tool that includes auto-discovery, node and device inventorying, automatic and configurable warning notifications—all joined through a centralized management interface. Today’s buyers of a NMS need to consider their interactions with the product vendor is. Is the vendor trustworthy? Are their policies client-friendly?
Why You Need A Specialized TIBCO Management Solution
First, let’s address the question of “What is TIBCO EMS?”. TIBCO Enterprise Message Service (EMS) is designed to bring together computing services and assets in order to reduce the cost, time investment, and effort of integrating disparate services across cloud and locally based platforms. TIBCO EMS is one of the market-leading enterprise messaging systems that enable businesses to exchange information in real-time.
Five Blind Spots Solved Through Observability
The future of cloud automation for SAP with AWS and Avantra
StackPod: Making Customers Successful With Martin Lako of StackState
A while ago, we asked our customers to write reviews about their experiences working with us. With an average rating of 4.6 out of 5 and ten reviews submitted and published within two weeks, we were humbled by the responses. As our CEO, Toffer Winslow wrote, “Perhaps the thing I was most proud of…was just how frequently our customers commented on the high quality of StackState employees they interact with and the caliber of service we deliver.”
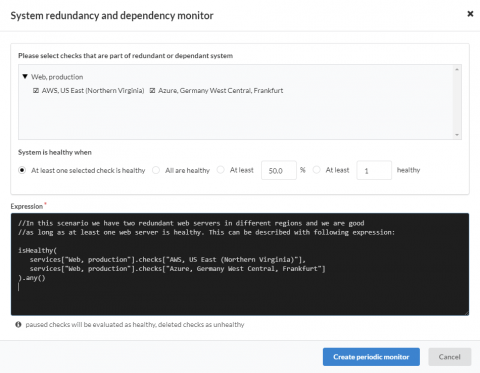
System redundancy and dependency monitor
With latest AppBeat release you can now access unique and powerful new feature which allows you to define custom monitoring expression for any workflow. Possible use cases: Expression examples: As you can see this framework is very flexible and allows you endless new monitoring options which were previously not possible. Happy monitoring!
Authors' Cut-Debugging with the Core Analysis Loop, and What to Build vs Buy
In the old days, the most senior members of an engineering team were the best debuggers. They had built up such an extensive knowledge about their systems that they instinctively knew the right questions to ask and the right places to look. They even wrote detailed runbooks in an attempt to identify and solve every possible issue and possible permutation of an issue.
What is Azure Active Directory?
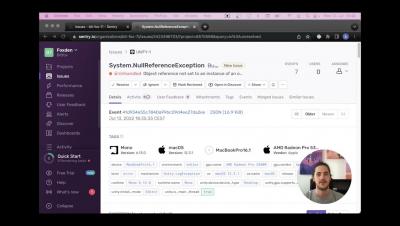
iOS App Hangs
Sentry Unity SDK
Supporting Developers with Fit-for-Purpose APM Solutions: A CTO's Perspective
Founded in 2015 with a mission to “empower eCommerce businesses to deliver a top-notch customer experience,” Gorgias is a multi-channel eCommerce helpdesk service for small to medium businesses. Among their core values are ownership, excellence and a customer-first mindset, and CTO and co-founder Alex Plugaru understood from day one that, for engineering teams to be successful, the tools he set them up with had to facilitate that.
A Practical Overview of APM Tools
In today’s tech-savvy world, apps not only add value to your brand but are also required to deliver fast responses and real-time problem solving with 24/7 availability. If your business relies on software applications for day-to-day operations, application performance monitoring (APM) is critical. APM tools allow you to pinpoint performance issues quickly, ensuring peak app performance.
Did You Survive This Week's Microsoft Teams Outage?
Though rare, Microsoft Teams outages can impact the productivity of your entire organization. For IT teams, staying one step ahead of an outage has never been more critical. From the time an outage begins productivity can plummet and IT starts to scramble in the dark to identify who, where and what is impacted and why. Below we unpack this week’s outage and outline the difference that deep Microsoft Teams monitoring can make.
Unified Observability is the Solution IT Has Been Waiting For
IT teams have been relying on observability tools to (theoretically) provide intelligence and insights into operating conditions within an organization’s digital infrastructure for years. But most of these tools have come with significant shortcomings that leave IT teams wanting more.
How to Monitor Docker Metrics | Container Performance Monitoring Explained - Sematext
Grafana Labs founders on the future of observability and how to scale an open source company
“Overwhelming.” It was the only word Grafana Labs CEO and Co-founder Raj Dutt could use to describe how it felt to look out at the sea of more than 600 Grafanistas gathered together in Whistler, British Columbia, for the first company-wide employee event in two years.
Cisco's new digital convergence
Cisco has unified technologies throughout the decades to provide new value and solutions to its customers and partners. Observability is Cisco’s new convergence frontier.
TransUnion's Steve Koelpin shares his solution to automate log onboarding
Understanding the Performance Impact of Generated JavaScript
In the modern web, the JavaScript you write is often down-compiled using a compiler like Babel to make sure your JavaScript is compatible with older browsers or environments. In addition, if you are using TypeScript (like the Sentry SDK’s do) or something similar, you’ll have to transpile your TypeScript to JavaScript.
Top 8 Database Version Control Tools
Many DevOps teams struggle to achieve consistent builds and releases due to ineffective collaboration and communication strategies. Over 71% of software teams today are working remotely from global locations, according to a survey by Perforce and DevOps.com. Interestingly, this consistency challenge can be easily solved by a simple approach – database version control.
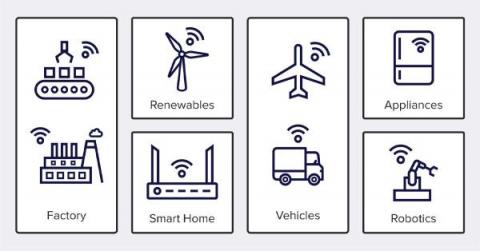
U.S. Enterprises Committing to IoT With Long-Term Plans
U.S. enterprises investing in the Internet of Things (IoT) increasingly are starting out with long-term strategies instead of just discrete proofs of concept, according to a new research report published today by Information Services Group (ISG) (Nasdaq: III), a leading global technology research and advisory firm. The 2022 ISG Provider Lens™ Internet of Things — Services and Solutions report for the U.S. finds a growing number of U.S.
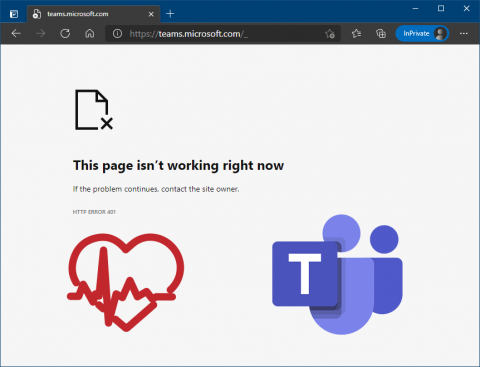
Microsoft Teams Down, July 20th, 2022
Microsoft’s unified communication and collaboration tool Teams suffered an hours-long outage on July 20, 2022 — affecting thousands of users globally. Exoprise sensors successfully detected Teams outage at least 30 mins before Microsoft officially confirmed the outage on its MSFT365status Twitter account. Below is what users saw when trying to access the Teams app or leverage any of its features.
IPv4 vs IPv6 - What are the Differences?
An IP (Internet Protocol) address is a numerical label which is used for addressing he location and identification of the network interface for the devices connected to the computer network. The most used and popular IP version is IPv4 which uses 32-bit for IP addresses. Since the IPv4 became popular and the IPv4 addresses are getting depleted, Ipv6 is now used which uses 128-bit for the IP addresses.
Releasing Icinga Director Branches
Many Icinga users favour the Icinga Director to manage their Icinga configuration. Icinga Director comes with many features to enable you to create and modify Icinga configuration through the web interface. One outstanding feature of Icinga Director is the Activity and Deployment log. It tracks every configuration change and allows you to see who changed what at which time. You can roll back to older versions of your configuration at any time.
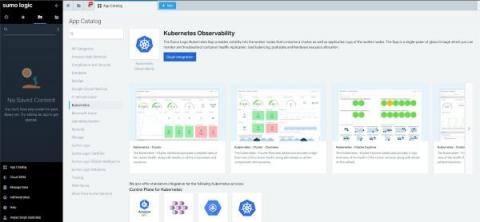
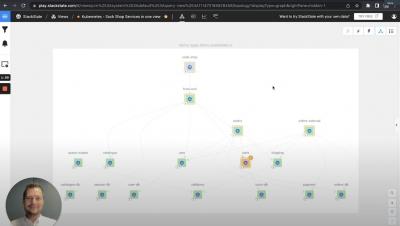
How to gain Kubernetes visibility in just a few clicks
AWS AppSync as a Gateway to Your Cloud Infrastructure
When you build modern cloud-based systems, you usually realize quickly that you need to manage the access to your deployed resources. This is especially true with serverless systems, where you often end up with dozens of resources, even for medium-sized architectures. AWS offers a few services you can use to set up a central entry point to your infrastructure. Elastic Load Balancer, API Gateway, and AWS AppSync. This article will discuss AppSync, AWS’s managed GraphQL service.
How to Scale with DX UIM's Monitoring Configuration Service, Part 1: Introduction
For today’s IT operations teams, the stakes keep getting higher and demands only intensify. The services these teams are responsible for managing play an increasingly critical role in the prospects of the business, which means optimizing service levels is an absolute imperative. Meanwhile, the environments in play only seem to keep getting larger, more complex, and more dynamic. Given these factors, monitoring is a task that keeps getting more vital and more difficult.
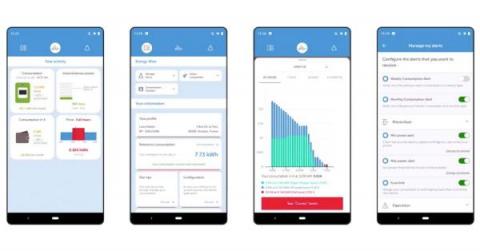
Real-Time Energy Management with InfluxDB and eSoftLink IoT Platform
Smart energy IoT platforms are empowering consumers to track energy usage and even control spend based on their next bill’s forecast. Yet eSoftThings, a specialist in the Internet of Things (IoT) and artificial intelligence (AI), set out to push smart energy management even further, for both consumers and utility companies, through its IoT platform eSoftLink.
Welcome to Grafanafest
How to Monitor PHP-FPM with Prometheus
PHP is one of the most popular open source programming languages on the internet, used for web development platforms such as Magento, WordPress, or Drupal. In addition to all PHP bases, PHP-FPM is the most popular alternative implementation of PHP FastCGI. It has additional features which are really useful for high-traffic websites. In this article, you’ll learn how to monitor PHP-FPM with Prometheus.
6 Popular End User Monitoring Tools in 2021
Before we dive into the comparison details, let's define end-user monitoring; it is monitoring the customer’s behavior or actions while using an application. Monitoring customer behaviors helps you analyze your application and improve it. In that way, it directly improves your business, i.e., happy customers mean more business. End-User monitoring tools also analyze how your application deployment and delivery affect your user experience.
Get to the Good Stuff
How to improve uptime with real-time monitoring, Grafana dashboards, and Grafana Loki: Inside Dish Network's observability stack
Dish Network is on a mission to connect people and things by changing the way the world communicates. With products ranging from Dish and Sling TV to retail wireless services and 5G networks, monitoring their satellite communications equipment is mission critical to maintaining extreme uptime for Dish’s 20 million customers across the United States.
Automate Your Boring Tasks with Ruby
If you aren’t already fed up with doing the same boring stuff over and over again, you will In the long run. Tasks which are repeated again and again in the same manner, such as System administration tasks, such as uploading your codebase, adjusting settings, repeatedly running commands, etc. tend to sap the enthusiasm you experience when working on your project.
Fetch Feature Flags Faster | Snack of the Week
Status Pages: The Ultimate Guide
Status pages have become the end-users window into your team’s operations. Companies with status pages are doing the right thing for their users — building in some transparency while mitigating frustration and support contact. For the benefits of status pages to pay off, organizations need to treat them as something more than active wiki-pages run by support.
The Next Frontier for Observability: Data Ownership with OpenTelemetry
Observability is a mindset that lets you use data to answer questions about business processes. In short, collecting as much data as possible from the components of your business — including applications and key business metrics — then using an AI-powered tool to help consolidate and make sense of this huge volume of data gives you observability into your business. Having observability for your business and applications lets you make smarter decisions, faster.
Azure Virtual Desktops: Questions & Answers
Recently, we hosted a great joint webinar with the team from AVD TechFest to present the results of a survey we conducted jointly to assess real-world Microsoft Azure Virtual Desktop (AVD) usage and industry and customer sentiments towards the AVD technologies. Alongside myself, Peter Claridge from eG Innovations and Simon Binder, digital workplace architect at Cygate and co-founder of the community-oriented AVD TechFest, were answering Azure Virtual Desktop questions.
Agent vs Agentless Monitoring: Which is Best?
ITOps vs. DevOps: Overcoming the Conflict
ITOps and DevOps are technology management practices that have been around long enough that anyone in IT should have a good grasp of what they mean. Here’s our experts’ take on ITOps vs. DevOps.
How to gain Kubernetes visibility in a few clicks
Tracing vs. Logging: What You Need To Know
Log tracking, trace log, or logging traces… Although these three terms are easy to interchange (the wordplay certainly doesn’t help!), compare tracing vs. logging, and you’ll find they are quite distinct. Logs, traces, and metrics are the three pillars of observability, and they all work together to measure application performance effectively. Let’s first understand what logging is.
Best Practice Series: Securing the Monitoring System
More than half of organizations prioritize security over user experience
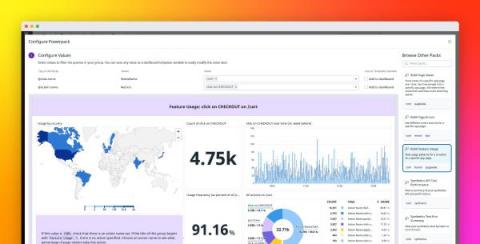
Save and share reusable dashboard widget groups with Powerpacks
Dashboards allow you to visualize and correlate monitoring data from across disparate data sources, technologies, and infrastructure components to understand what’s going on in your environment. In a growing organization, it’s paramount to standardize how teams build their dashboards to ensure their consistency and legibility.
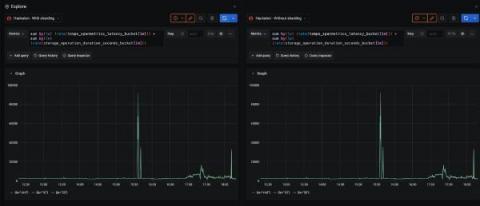
How we improved Grafana Mimir query performance by up to 10x
Earlier this year we introduced the world to Grafana Mimir, a highly scalable open source time series database for Prometheus. One of Mimir’s guarantees is 100% compatibility with PromQL, which it achieves by reusing the Prometheus PromQL engine. However, the execution of a query in the Prometheus PromQL engine is only performed in a single thread, so no matter how many CPU cores you throw at it, it will only ever use one core to run a single query.
Developers vs. DevOps - the case for developer ownership
With the introduction of container orchestration frameworks like Kubernetes, the adoption of cloud-native technologies, and the transition to microservices architectures, engineering organizations were empowered to build scalable and complex applications. DevOps engineers have had an indispensable role in this revolution, enabling and supporting these processes.
MetricFire: A Great Instrumental Monitoring Alternative
Instrumental has made the decision to shut down its platform starting August 2022 including its application, servers, and all related APIs being shut down. Users will need to migrate to another solution or risk all their data being permanently deleted! But Instrumental users need not fret!
Netreo Product Update - July 2022
Hello Netreo Customers! In case you missed our Q1 survey invitation, I’m Netreo’s Vice President of Product Management. I joined Netreo for the opportunity to create great business solutions and customer experiences.
A Data Lake Is Not Enough to Keep Your Observability Ambitions Afloat
Recently I heard one of our prospects talk about a competitor who was promoting their data lake and ask, how are we different than that? His question got me thinking about why a data lake alone does not provide the depth of observability you really need. The goal of observability is to help SREs, IT Ops and DevOps teams run their IT systems with close-to-zero downtime. Consolidating data from across your environment into a data lake is certainly a good step.
Datasets, Traces, and Spans-Oh My!
If you've stumbled (or purposefully landed) on this blog post, chances are you are new to—or diving deeper—into the observability space, o11y for short. Suffice it to say, you’re not in Kansas anymore. Honeycomb in a lot of ways can serve as a yellow brick road into o11y, and this article should serve as an introduction into how Honeycomb facilitates implementing o11y into applications and distributed services.
DEJ's 2022 IT Performance Management Study: Key Takeaways
DEJ's 2022 IT performance management study shines a light on the 24 areas impacting IT teams today. The pain points giving IT teams sleepless nights are all here – the war for talent, managing complexity, data management and analytics at scale, for example. As you delve deeper, however, a pattern begins to emerge – it all comes down to business outcomes.
How to access device configuration in Playwright
Sentry and Capacitor: How to Build and Monitor User Experiences
Cutting through the noise
IT Infrastructure Monitoring (ITIM) tools like Progress’s own What’s Up Gold are the backbone of any IT Operations monitoring strategy. However, these tools are primarily focused on general purpose visibility across a wide range of infrastructure and systems with an emphasis on operational availability and performance.
Top 12 Site Reliability Engineering (SRE) Tools
Ben Treynor Sloss, then VP of Engineering at Google, coined the term “Site Reliability Engineering” in 2003. Site Reliability Engineering, or SRE, aims to build and run scalable and highly available systems. The philosophy behind Site Reliability Engineering is that developers should treat errors as opportunities to learn and improve. SRE teams constantly experiment and try new things to enhance their support systems.
7 stats about website downtime that will blow your mind
We believe that data speaks volumes and that’s why we’ve put together the most shocking 7 stats that we’ve found from our uptime monitoring report. You have to see them to believe them!
Increased IT complexity impacting ROI for 84% of IT professionals
Nastel Recognized as Leader in Integration Infrastructure Management & Transaction Observability by GigaOm
“Nastel is uniquely placed when it comes to understanding the configuration information and message content of messaging middleware and integration infrastructure” — Saurabh Sharma, GigaOm Nastel Technologies, the world’s #1 i2M (Integration Infrastructure Management) company, today announced that it has been rated as a leader in GigaOm’s new Integration Infrastructure Management & Transaction Observability Sonar Report.
Nastel Recognized as Leader in Integration Infrastructure Management & Transaction Observability by GigaOm
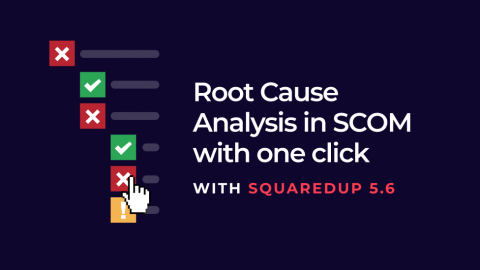
How to get One-click SCOM Root Cause Analysis
SCOM has incredible powers, but it’s not always easy to find the root cause of issues fast. And you definitely don’t get one-click SCOM root cause analysis. We’ve all been there. A business-critical server goes down and you don’t know why. Let’s imagine you had a dashboard showing the health statuses of all your server groups and you notice that the United States is showing as critical.
Introduction to reliability management
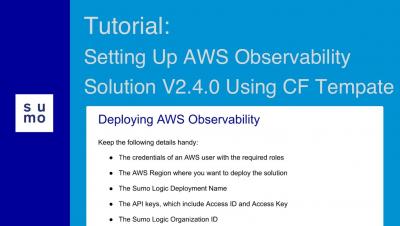
Tutorial: Setting Up AWS Observability Solution V2.4.0 Using CloudFormation Template
Site24x7 app for Apple TV
Site24x7 app for Android TV
elmah.io launches two GitHub Actions in the GitHub Marketplace
While developing the ecosystem around the elmah.io API and App Store, we see an increasing interest and adoption of GitHub and the services around it. We have a range of integrations with GitHub that I’ll introduce you to later in this document. But first of all, I’m happy to announce that elmah.io has been chosen as a GitHub Technology Partner to build integrations in the Marketplace and extend developer capabilities. elmah.io integrates with GitHub in two ways.
The future of AIOps and predictive analysis
Topology Is Critical for AIOps
Building a Custom Grafana Dashboard for Kubernetes Observability
Distributed systems open us up to myriad complexities due to their microservices architecture. There are always little problems that arise in the system. Therefore, engineering teams must be able to determine how to prioritize the challenges. Viewing logs and metrics of such systems enables engineers to know the shared state of the system components, thereby informing the decision-making on what challenge needs to be solved most immediately.
Cisco's CX Cloud team talks full-stack observability
Learn how working with AppDynamics as a customer and design partner is helping the Cisco CX team improve Cisco’s offerings to customers via the CX Cloud platform.
New Features and Enhancements in SQL Server 2022
Splunk 9.0 SmartStore with Microsoft Azure Container Storage
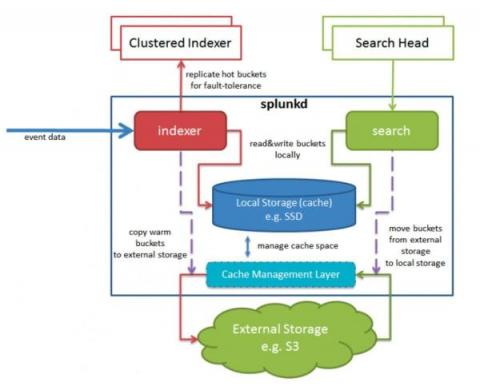
With the release of Splunk 9.0 came support for SmartStore in Azure. Previously to achieve this, you’d have to use some form of S3-compliant broker API, but now we can use native Azure APIs. The addition of this capability means that Splunk now offers complete SmartStore support for all three of the big public cloud vendors. This blog will describe a little bit about how it works, and help you set it up yourself.
How Does Observability Help an Organization Move the Needle?
If you’re new to the concept or just trying to keep up with the conversation, Gartner defines Observability as the evolution of monitoring into a process that offers insight into digital business applications, speeds innovation and enhances customer experience. Some folks think that Observability is a new buzzword, but in fact the term was coined in 1960 by Rudolf E. Kalman, a Hungarian-American engineer.
How Does Docker Network Host Work?
Docker is a platform as a service product. With Docker, you can easily deploy applications into Docker containers. Containers are software "packages" that bundle together an application's source code with its libraries, configurations, and dependencies. This helps software run more consistently on different machines. To use Docker containers, you need to understand how Docker networking works. Below, we'll answer the question: "what is Docker network host?". We'll also take a look to see how it works.
Top 4 Best Practices for Migrating to Azure Virtual Desktop
This blog was originally posted by Microsoft MVP Theresa Miller to her blog, 24×7 IT Connection. Organizations are migrating their desktops to the cloud as a long-term future state and Azure Virtual Desktop (AVD) is a common implementation choice. Technology migrations can be complex to plan and execute on. Today let’s look more closely at some common AVD use case scenarios and then dive into the top 4 best practices for a successful migration to AVD.
Slow Application? Here's What to Do
Today, everything we work on relies on being connected to an app. Whether we are in a household or running a business, applications have become as accessible as air. Alright, almost like air. If your business relies on applications to survive, a Slow Application spells disaster. Getting to the bottom of the slowdown becomes a tedious exercise of pointing fingers and going down the rabbit hole. Even worse is if it affects a business’ customers.
Phil Gervasi on Network Observability and Cisco Live | Network AF Episode 20
Logging in Python: A Developer's Guide
Have you ever had a tough time debugging your Python code? If yes, learning how to set up logging in Python can help you streamline your debugging workflow. As a beginner programmer, you’ll have likely used the print() statement—to print out certain values across runs of your program—to check if the code is working as expected. Using print() statements to debug could work fine for smaller Python programs.
Building for Scale and Traceability Using ABAC for Lambda Functions
The most important thing with building out any application is to think BIG. Build for ten users now and 10,000 users tomorrow. Having infrastructure that scales as your needs do is critical for user adoption—one of the many reasons we love a serverless approach and particularly AWS Lambda. The other part of any growth journey is managing access to organizational cloud infrastructure, especially with rapidly growing organizational development and DevOps teams.
Making a Time Zone Picker Control for .NET MAUI
This post is part of the MAUI UI July community series of blog posts and videos, hosted by Matt Goldman. Be sure to check out the other posts in the series! Hi, my name is Matt Johnson-Pint. I recently joined Sentry as an engineer working on the Sentry.NET SDKs. One of my first big projects was adding support for.NET MAUI, which we’ve now launched in preview. Go ahead, give it a try!
Top Freeware and Open-source IT Monitoring Tools
There are hundreds of monitoring tools available in the market for enterprises and MSPs to choose from. Many of these tools are open source or freeware. Over the years, the functionality of many of these open source tools have improved greatly. In this blog, we highlight the top open source IT monitoring tool options and discuss their pros and cons.
Anodot Named Challenger and Fast Mover in FinOps Report - July 2022
We are excited to share that Anodot’s Cloud Cost Management solution has been named a Challenger and Fast Mover in the 2022 GigaOm Radar for Evaluating Financial Operations (FinOps) Tools report.
JavaScript SDK "Package Size is Massive" - So we reduced it by 29%
Developers started to notice just how big our JavaScript package was and yeah, we knew. We weren’t ignoring the issues; after all, we don’t want the Sentry package to be the cause of a slowdown. But to reduce our JavaScript SDK package size effectively we had to account for shipping new capabilities, like being able to manage the health of a release and performance monitoring, while maintaining a manageable bundle size. After all, new features == bigger package - usually.
The Two Sides of Experience: Does the 'Comfy' IT Job Really Exist?
Managing the digital experiences of an entire workforce isn’t easy. But that’s what today’s IT professionals are tasked with: as DEX has become an essential priority in our increasingly digital workplace, IT jobs now require service teams to deploy the strategies that ensure employees remain productive, engaged, and happy. But what about IT workers themselves? What about their employees experiences? After all, IT workers are employees too!
What is Tracing? Everything You Need to Know
Tracing, or more specifically distributed tracing or distributed request tracing, is the ability to follow a request through a system, joining the dots between all the individual system calls required to service a particular request. Although tracing logs have been around for some time, the trend toward distributed architectures, microservices, and containerization has elevated it from nice-to-have status to an essential piece of the observability puzzle.
Essential VMware ESXi monitoring best practices
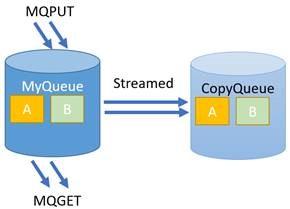
IBM MQ Streaming Queues Adds Business Value to Middleware
Last year we published this blog post about the benefits of IBM MQ streaming queues. On July 15th, 2022 this functionality was also made available for MQ on the mainframe (z/OS) and it’s also been announced for the MQ appliance for Aug 2nd, 2022. Nastel has been supporting and embracing this functionality for some time in its integration infrastructure management (i2M) platform.
Open Source vs. Commercial Cloud Monitoring Tools: How to Choose
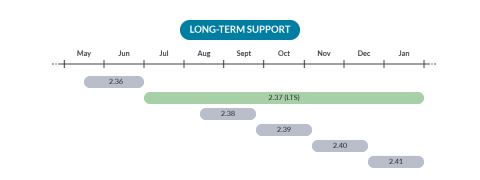
Prometheus 2.37 - The first long-term supported release!
Prometheus 2.37 is out and brings exciting news: this is the first long-term supported release. It’ll be supported for at least six months.
The Observability Maturity Model Webinar | StackState, TechStrong Research, Ripple X
Getting Started With Observability on Kubernetes | Webinar with Ricardo Santos and Andreas Prins
Icinga for Windows Preview: Visualize your Metrics!
It has been a while since we published some news regarding Icinga for Windows – that’s why we would like to tell you one month ahead about a big change which follows with version 1.10 in August.
Google Ads Are Slowing You Down
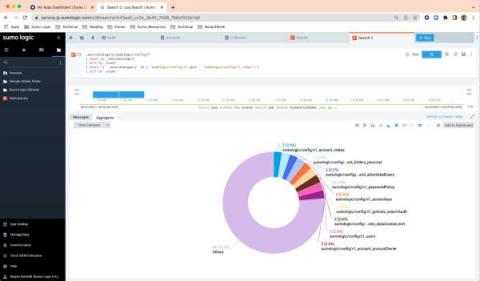
Network telemetry in Sumo Logic
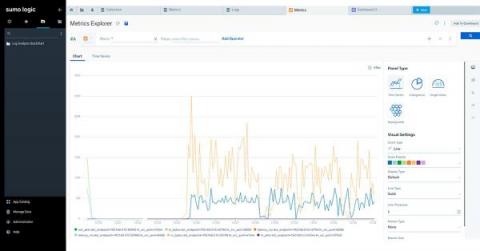
Recently we caught up with the Sumo Logic team to discuss network visibility and optimizing application stack views. We took a look at their API and found that it would be easiest to use the HTTP Ingest method to send in our metric data.
3 Reasons Why You Should Have a Service Focus on Microsoft Teams
Written by Nick Cavalancia, Technical Evangelist, Microsoft MVP, & CEO of Conversational Geek In a world of Managed IT Service Providers that all offer some form of services around Microsoft 365, there’s a compelling case to be made for your business to be centering in on Microsoft Teams.
Coralogix Platform Overview - July 2022
Detect Cryptocurrency Mining with Flowmon NDR
Topology Is Critical for AIOps
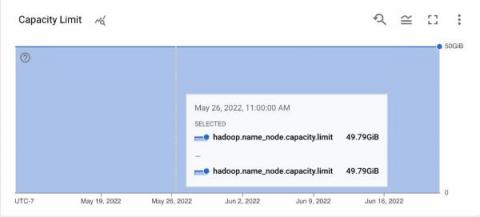
How to monitor Hadoop with OpenTelemetry
Cribl Named as a Big Data Emerging Vendor by CRN
Although we’ve encouraged employees to take plenty of time off this summer to relax, recharge, and enjoy time with family, Cribl certainly hasn’t been on a summer holiday as a company. After the big announcement in late May with Cribl Search and our Series D funding round, we moved right into the announcement of Cribl Stream 3.5, Cribl Edge 3.5, massive upgrades to Cribl.Cloud, and the launch of our Cribl Certified Observability Program.
Content Delivery Networks (CDNs) vs. Load Balancers: What's The Difference?
Load balancers and content delivery networks (CDNs) are critical tools for delivering modern, cloud-native applications. They play essential roles in ensuring the smooth flow of data between applications and end-users. If you don’t have both a load balancer and a CDN in place, you’re probably in a poor position to guarantee the uptime of your application across a wide geographic area. That does not mean, however, that load balancers and CDNs do the same thing.
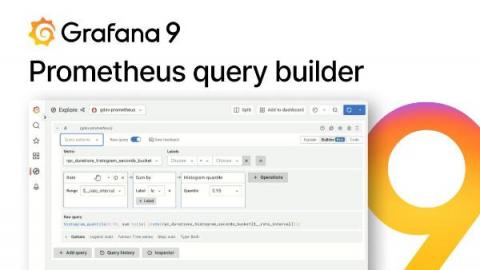
New in Grafana 9: The Prometheus query builder makes writing PromQL queries easier
When Grafana started in 2014, its main goal was to be a great dashboarding solution for Graphite. Around the same time, the Prometheus project started to gain steam, but it wasn’t clear whether it should be added to Grafana. After all, Grafana was a Graphite frontend, it was uncertain at the time if Prometheus would take off in popularity, and it would take resources away from the core purpose of why Grafana was created.
Observability Again? Oh, Yes.
Learn how application monitoring helps lay the foundation for operational success
MTTR vs. MTTA vs. MTBF: A Complete Set of Common Incident Management Metrics
There are a common set of key performance indicators for incident management, such as MTTR and MTTA. What do these metrics mean, and why are they important?
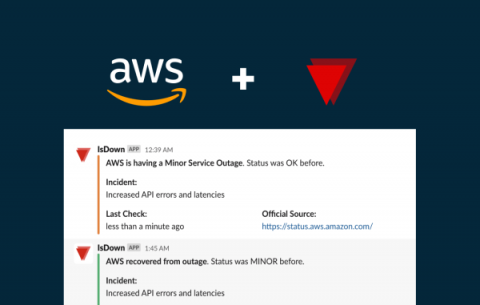
AWS outage? A better way to monitor outages in Amazon Web Services
Amazon Web Services (AWS) needs no introduction. It's one of the most popular services in the world. Or actually, the most popular cloud infrastructure provider (34%) according to this study. Like in any other service, there are outages. For people running their infrastructures, there's a good chance that outages have impacted your business in the past. And the reality for AWS (or any other service) is that there's a good chance it will happen again.
Making sure routes and config files are cached in a Laravel app
In a typical Laravel application, you'll likely to have many routes, config files and possible some events. In your development environment these routes and config files will loaded and registered in each request. The performance penalty for this is not too big. In a production environment, you want to cache these things. Laravel makes this easy by offering a couple of Artisan commands that you can use in your deployment procedure.
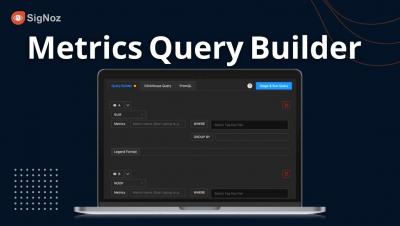
Metrics Query Builder to make Advanced and Custom Dashboards for your Application | SigNoz
What is Message Oriented Middleware (MOM)?
The full form of MOM is Message-Oriented Middleware which is an infrastructure that allows communication and exchanges the data (messages). It involves the passing of data between applications using a communication channel that carries self-contained units of information (messages).In a MOM-based communication environment, messages are sent and received asynchronously.
VMware integration with Avantra
It was Avantra’s predecessor Syslink Xandria 7.2, released back in November 2018, which provided native cloud integration for AWS, Azure, and Google Cloud Platform. Right after this release providing our first step in automation for IaaS, specifically around start-/stop, we heard customers say: “But we have a huge VMware on-premise landscape, don’t forget us.” Needless to say that we certainly know that VMware products have made their way to the cloud since quite some time.
Is MetricFire An Alternative to Grafana?
In this article, we will talk about Graphite and Grafana monitoring systems, and their similarities and differences. Also, we will explain why it is an effective solution to use Graphite and Grafana together to monitor your system metrics. We will also learn about the benefits of using MetricFire. Sign up for MetricFire for free and store and process your system metrics with our hosted Graphite solution.
How to Collect and Ship Windows Events Logs with OpenTelemetry
How to Monitor ZooKeeper: Key Metrics & Best Tools [2022 Comparison]
Apache Zookeeper is a great tool used by many popular tools. Your Kafka uses Zookeeper, your HDFS uses it, your SolrCloud uses it, and your ClickHouse may also be using it. No matter where you are using Apache Zookeeper, it is usually a crucial piece of the infrastructure and it needs to be reliable and fast.
The future of cloud automation for SAP with Microsoft Azure and Avantra
Splunk vs ELK
If you have any experience with comparing the leading tools in observability then it is very likely that you will have come across Splunk & ELK during your research. These two titans have provided a swiss army knife of useful tools to many developers, cybersecurity specialists and devops professionals over the years since their inception. In this guide, we’ll be comparing these two leading SIEM tools against each other to help you to decide on which solution will help your security use case.
How real-time Grafana dashboards and alerts combat climate change: Inside Apeel Sciences observability stack
Meet the newest changemakers making an impact in the current climate crisis: Apeel Sciences. The ag-tech company is on a mission to eliminate the 8 percent of greenhouse gas emissions caused by global food waste with their edible, plant-derived food coating, which keeps fruits and vegetables fresh for up to twice as long.
How Can OpenTelemetry Enhance Application Performance Monitoring?: A Gartner Quick Answer
Earlier this year Gartner published a report discussing OpenTelemetry and its place in enhancing Application Performance Monitoring (APM).
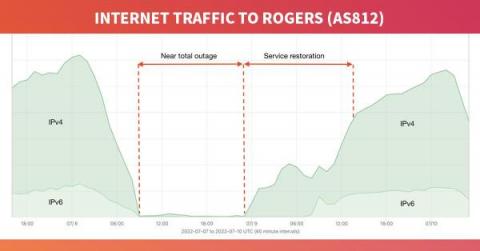
A deeper dive into the Rogers outage
Beginning at 8:44 UTC (4:44am EDT) on July 8, 2022, Canadian telecommunications giant Rogers Communications suffered a catastrophic outage taking down nearly all services for its 11 million customers in what is arguably the largest internet outage in Canadian history. Internet services began to return after 15 hours of downtime and were still being restored throughout the following day.
A Guide on How to Monitor GraphQL APIs
GraphQL has replaced REST since its debut in 2015 and has gained popularity. It provides the flexibility frontend developers have longed for. The days of begging with backend developers for single-purpose endpoints are over. Now, a query can provide all the necessary data and request it at once, theoretically reducing latency by a significant amount. Everything was much easier with REST, especially monitoring.
Sematext Experience | Real User Monitoring Tool | Front-end Monitoring Solutions
Alerting in Grafana 9
For more info, go to:
Grafana Alerting page: https://grafana.com/grafana/grafana-alerting/
Grafana Alerting documentation: https://grafana.com/docs/grafana/latest/alerting/
How to create a Mimir managed alert rule in Grafana
For more info, go to:
Grafana Alerting page: https://grafana.com/grafana/grafana-alerting/
Grafana Alerting documentation: https://grafana.com/docs/grafana/latest/alerting/
How to create an alert in Grafana
For more info, go to:
Grafana Alerting page: https://grafana.com/grafana/grafana-alerting/
Grafana Alerting documentation: https://grafana.com/docs/grafana/latest/alerting/
Release update | What's new in Avantra 21.11.6
We’ve just released Avantra 21.11.6 and as Product Manager for Avantra, I get the opportunity to showcase some of the awesome new features we’ve managed to fit in this release. For Avantra 21.11.6, we’re continuing to focus on our Automation engine as well as squashing a few bugs and a couple of non-automation related features too.
Analyze VPC Flow Logs for AWS Transit Gateway in Datadog
AWS Transit Gateway is a service that makes it easy to connect multiple Amazon Virtual Private Clouds (VPCs), AWS accounts, AWS Regions, and on-premises networks together through a central hub. For AWS customers operating at global scale with many accounts and VPCs, AWS Transit Gateway greatly simplifies AWS networking architecture by eliminating the need to manage complex peering relationships and massive route tables.
What's In the New IBM MQ Appliance
When IBM MQ 9.3 was released last month, as discussed here, it was notable (and noted) that this was just for distributed platforms and that news of the mainframe and the appliance would follow. Now, IBM has announced the new MQ Appliance, called M2003, with general availability on August 2, 2022.
Middleware & Integration Staff Issue? - F500 Bank Found a Better Approach
Integration and middleware staffing issues within IT Operations and Service Delivery teams are common, even in the largest enterprises. Here is the story of one large enterprise.
How to fix performance regression in serializing and deserializing JSON | Snack of the Week
Key Server Metrics to Monitor for Peak Performance and Health
No matter how well-designed, flashy, or useful your application is for your target users, they may not take kindly to it being slow or, even worse, crashing once in a while. You will lose customers and revenue as a result. The solution is definitely not to add additional features to the application to bring back users. Instead, it’s as simple as paying close attention to the health of the servers where your application is hosted.
See Lumigo in Action (Demo 2022)
How to monitor Zookeeper with OpenTelemetry
How to build a dashboard for AppDynamics
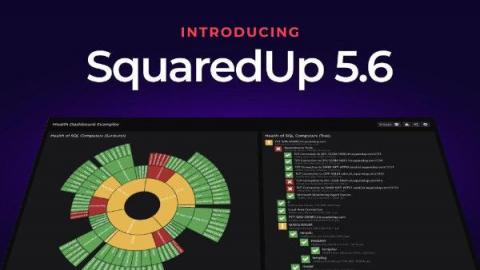
We’re excited to announce that we’ve just released SquaredUp Dashboard Server 5.6! This Dashboard Server release covers multiple features that have been highly requested by the community. Prioritizing this user feedback, we’ve added some exciting new visualizations, features and enhancements. Read on to learn about the latest updates, or catch the full webinar recording at the bottom of the blog for a detailed demo by Senior Solutions Engineer Ashley Thompson.
Enhance Kubernetes data plane monitoring by scraping Ocean metrics via Prometheus
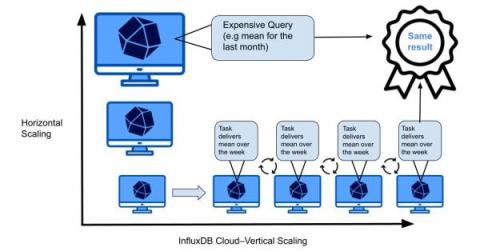
TL;DR InfluxDB Tech Tips: Migrating to InfluxDB Cloud
If you’re an InfluxDB user you might be considering migrating your workload to InfluxDB Cloud. You probably want to free yourself from the responsibilities associated with managing and serving your OSS account. Perhaps you are finding that you simply cannot scale your OSS instance vertically to meet your needs. Maybe you want to use all of the Flux functions that are available to you in InfluxDB Cloud.
What Is eBPF? A Guide To Improved Observability & Telemetry
Extended Berkeley Packet Filter (eBPF) is an exciting technology that provides secure, high-performance kernel programmability directly from the operating system. It can expose a wide range of applications and kernel telemetry that is otherwise unavailable. But with operating systems frequently processing very large volumes of network data, even with an efficient framework and cheap eBPF program runs, costs can add up quickly.
Fewer Alerts is Always Better, Right?
Let’s be honest, alert fatigue is a real thing and anyone telling you otherwise is flat out lying. If you have tools generating tens or thousands of daily alerts, eventually people will burn out and simply start ignoring alerts. Even if you have enough team members to divvy up alert reviews, the approach only works for a while. Trouble is, false positives are always generated when managing alerts, and people will eventually ignore false positives.
Outage Alert: Top 5 Outages of Q2 2022
We are halfway through 2022 and one thing is certain – downtime is here to stay. In fact, trends are showing the frequency of downtime is increasing, along with the severity and wide-spread impact. Consumers and businesses are more interconnected and reliant on technology and software than ever, from remote business communication to simply listening to your favorite podcast on your way to work.
Feature Spotlight: New Microsoft CQD Saved Searches
The Microsoft CQD is rich with Teams data but for IT professionals, toggling between multiple dashboards can leave you feeling as though you might not have the visibility into Teams performance that you would like. For IT teams, configuring custom dashboards in Elasticsearch can take time and not always yield the results you are looking for.
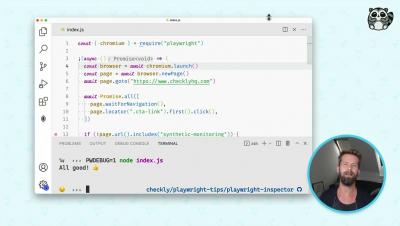
How to debug your Playwright scripts with the built-in inspector
How do you use automation in the manufacturing process today?
Collect critical AWS metrics faster with Sysdig
Today, we are excited to announce support for Amazon CloudWatch Metric Streams. This support will enable our customers to ingest metrics from AWS CloudWatch in real time, increase metric and state fidelity and time to ingestion while decreasing MTTR, and support cloud metrics at scale without the need to customize or re-configure new AWS service metrics. In this blog, we dig deep into.
What is Response Time Analysis?
When choosing between multiple software applications, users will always go with the fastest one (assuming they’re all equally reliable). As a software developer, once you have ensured your application's overall quality, robustness, and reliability, its acceptance and reputation among users depend primarily on how fast and responsive it is. Therefore, it is vital to equip your analysis toolkits with measures that speak of an application’s speed.
What Are Unit Economics and How Are They Calculated?
Cloud spend is a significant line item in every company’s IT budget, and controlling it is especially important in today’s challenging economic climate. A steep decline in share prices, valuations, and a slowdown in venture capital funding have led CEOs to cut costs within their large line items, reduce their workforce, and reevaluate their unit economics — especially their margin per customer. The question is, how many organizations know their margin per customer?
Customer Perspective: Kentik in One Word
SLA Reports and Scheduled Reports
03:06 Scheduling Reports
Check out our free trial, no credit card required: https://uptime.com/go/home
#monitoring, #saas, #downtime, #uptime, #nomore404, #outage, #enterprisesbusiness
Easily Scale Your Graphite Deployment
The Graphite database has engineers feeling stuck. Perhaps you’re one of them. You find yourself collecting metrics that were defined years ago when the system was put in place, likely by someone who is no longer with the company. These pre-aggregations make it necessary to collect more data, which results in increased infrastructure and disk space costs.
Best Open Source Application Monitoring Tools
As businesses grow and develop, so must the tools that help manage them. Application monitoring tools provide enterprises with a way to keep track of the health and performance of their applications and ensure that everything is running smoothly. Application monitoring tools have a wide range of capabilities and data that enterprises can use to help answer questions about the current state of an application.
Monitoring Your Platform From Multiple Locations
Mature start-ups and scale-ups create wonderful and challenging environments for Engineers. As the product they’re creating matures and the brand becomes a successful one, the user base generally starts growing, and, for some companies, in places they might not expect it to grow. As that happens, new challenges arise for Engineers. One of these challenges is pretty straightforward to guess. Basically having a particular product available throughout different regions of the world.
An Introduction to Kubernetes Observability
If your organization is embracing cloud-native practices, then breaking systems into smaller components or services and moving those services to containers is an essential step in that journey. Containers allow you to take advantage of cloud-hosted distributed infrastructure, move and replicate services as required to ensure your application can meet demand, and take instances offline when they’re no longer needed to save costs.
Monitor your T2A-powered GKE workloads with Datadog
Arm processors have become increasingly popular in recent years, providing energy-efficient, cost-effective processing power to both mobile and cloud computing ecosystems. As a part of this growth, more and more organizations are choosing to leverage the many benefits of Arm-based architectures for their containerized workloads. Today, Google Cloud announced its Arm-based Tau T2A virtual machines (VMs), which you can also use to run workloads in Google Kubernetes Engine (GKE).
The Role of Middleware in Distributed Systems
In distributed systems, middleware is a software component that provides services between two or more applications and can be used by them. Middleware can be thought of as an application that sits between two separate applications and provides service to both. In this article, we will see a role of middleware in distributed systems.
The Leading Tools Compatible With OpenTelemetry
OpenTelemetry (also known as OTel) is a popular open-source framework used to generate telemetry data for traces, metrics, events and logs. In this guide, we are going to cover the best observability and application performance management tools that can be used alongside OpenTelemetry to transform telemetry data into responsive reporting dashboards.
Prime Day's High Traffic Survival Guide
Did you, along with billions of others around the world, snag some deals yesterday at the start of Amazon’s Prime Day 2022? It's no secret that July 12-13th marks Amazon’s two-day online shopping event. There are no hard stats yet on this year's numbers, but according to Influencer Marketing Hub, the world’s largest online retailer generated record sales of about $11.2 billion during their 2021 Prime Day, a 7.6% increase from 2020.
How to globally monitor your edge functions using Checkly
Introducing Kubernetes Monitoring in Grafana Cloud
Kubernetes has quickly become the standard container orchestration technology for developers and companies who want to deploy at scale, iterate quickly, and manage a large number of applications and services. At Grafana Labs, we recognized the need for something more powerful for our users to be able to successfully keep an eye on everything happening inside their clusters.
How to Monitor Varnish with Google Cloud Platform
The Return of the InfluxDB V1 Shell
The community has spoken and the demand was clear: “BRING BACK THE INTERACTIVE SHELL USED IN 1.X” So it’s back… It works with InfluxDB V2… and has some improvements. The interactive shell allowed users to write data and interactively query data using InfluxQL. For newer users, InfluxQL is the SQL-like query engine that was native to the first major version of InfluxDB.
The 5 Ws (and 1H) of InfluxDB Edge Data Replication
As more businesses generate and process data at the edge, the need to share data from edge nodes to a centralized cloud location increases. Replicating data from the edge to the cloud ensures consistency across an entire application and creates an uninterrupted historical record that preserves the critical context of time. Edge Data Replication (EDR) is a feature available in InfluxDB designed to address this challenge.
A to Z With Observability and OpenTelemetry
How do you go from A to Z with observability and OpenTelemetry? This post answers a question we hear often: “How do I get started on instrumentation with OpenTelemetry, while also following best practices for the long-term?” This article is all about taking you from A to Z on instrumentation. This will help you: We will use a simple greeting service application written in Node.js to understand the journey. You can find the pre-instrumented state here.
Microsoft Teams Call Quality - 80% Of The Solution Is The Data
Getting basic information on the performance of your Microsoft Teams setup is possible with the Microsoft tools but it is limited. We help transform the data you don’t see and deliver it in a way that makes IT’s job much easier.
Top 7 Java Performance Metrics to Monitor
Today, almost any metric you can think of can be tracked down and reported, as opposed to the past when the software was traditionally provided in boxes and its performance in production could not be predicted. The issues we are currently facing are not due to a lack of information, but rather to an abundance and scale of information. This becomes significantly more difficult to manage when dozens or even hundreds of servers are in use.
Three Critical Questions for Healthcare
Machine Learning at Splunk in Just a Few Clicks
The Machine Learning team at Splunk has been hard at work over the last several months preparing for a few exciting launches at.conf22, held just a few weeks ago. Splunk customers want to leverage machine learning (ML) in their environments, but many aren’t sure how to use it, or even how to get started.
Cribl Search Unlocks The Value of ALL Data
We announced Cribl Search in May, and customer reaction has been incredibly positive. We’ve heard for some time that organizations have data everywhere. They have data in their observability lakes, analytics tools, object stores, and at the edge. The big challenge facing enterprises is that existing search models require you to take all of this data that you don’t know is valuable or not, move it into one place, and then make decisions about whether this is valuable?
Infrastructure as Code (IaC) vs. Infrastructure as a Service (IaaS)
Our Vision of the Zero-Down Time Enterprise by StackState CTO Lodewijk Boogaards
Mezmo Named a Top Vendor for Managing IT Performance by DEJ
We are thrilled to announce that Mezmo has been recognized as one of the Top 20 Vendors for Managing IT Performance in 2022 by Digital Enterprise Journal (DEJ). This list was created in response to DEJ’s study, 24 Key Areas Shaping IT Performance Markets in 2022. DEJ analysts surveyed more than 3,300 organizations around a variety of topics to craft a comprehensive understanding of the state of these programs today.
Monitoring with remote components
Want to test the power of all-in-one monitoring? Request a free trial of the Enterprise version on our website: https://bit.ly/2O9hoRf
What is Network Bandwidth? How to Measure and Optimize Bandwidth for Fast, Smooth Traffic Flows
Many think they know what network bandwidth is but conflate performance with capacity. This blog, among other things, will end that confusion. And for true IT experts, we’ll dive deep into the whys and wherefores of network bandwidth monitoring and optimization.
Application Performance Monitoring Needs a Makeover With Digital Experience Monitoring
Virtual collaboration is the new name of the business game in 2022, with at least 25% of employees in the US predicted to be working remotely by the end of the year. As the Work-from-anywhere movement continues to grow and online meetings become the industry standard, remote employees increasingly rely on access to SaaS and mission-critical services directly from the Internet.
How I accidentally told 19k people Hacker News was down
Building resilience for applications and services with Elastic Observability
Insights from the 2022 Results That Matter study Correlating data across multiple silos and applications to derive meaningful and actionable insights is an ongoing struggle. These challenges are only set to increase as high-speed connectivity becomes more ubiquitous and enables data-heavy, digital experiences.
Top 15 Docker Container Monitoring tools in 2022
Quick Bytes - Lumigo Tags
Investigating digital experience with Synthetic Transaction Monitoring
Kentik Synthetics is all about proactively testing and monitoring specific elements of your network, the services it relies on, and the applications it delivers. That means using artificial traffic instead of end-user traffic to test a variety of aspects of digital experience monitoring like device availability, DNS activity, web application page load times, and BGP activity. But to test an end-user’s experience interacting with a website, we need to approach things differently.
5 Downdetector Alternatives: Is There a Better Way to Know if a Service Is Down?
Downdetector is a platform that displays the current status of internet services, websites, mobile apps, and providers. The information is crowdsourced from users who report issues as they come across them. Downdetector is a popular service. Nowadays, organizations depend on a huge variety of services and so need to have the most reliable and detailed view of everything that’s going on.
How to access and query REST APIs with the Sqlyze plugin in Grafana
A few months ago, I wrote about using the Sqlyze data source plugin in Grafana to query COVID-19 wastewater surveillance data on Databricks. Did you know that with the Sqlyze Enterprise plugin, you can also access REST APIs (web services), treat them as database tables, and query them using SQL? You can use any ODBC driver you like, and it’s not limited to relational databases, either. You can query NoSQL and document databases, too.
Automate Your Boring Stuff with Python
In many critical areas, you can automate the completion of repetitive chores in an efficient and effective manner by using a computer language such as Python. When you are just starting out, it’s vital to understand the fundamentals of Python via coding examples. However, if you want to improve your Python skills, you should concentrate on constructing things and automating real-world tasks.
Lessons Learned From Running Serverless In Production For 5 Years
I have been an AWS customer since 2010 and in the early days I, along with just about everyone else on AWS, spent a lot of my time just managing infrastructure. Patching AMIs, configuring load balancers, updating auto-scaling configurations, and so on. It was the sort of thankless task that no one cared about until something went wrong! The very definition of what Werner Vogel often refers to as “undifferentiated heavy-lifting”.
How to Optimize Laravel Application Performance
With the growing pace of tech-oriented companies, software development is picking up. Many new tech stacks are coming into the world to make the development process easier, and a lot of these new companies are using PHP as the backend framework for their apps. PHP, with its various version updates, has grown popular among developers. Most PHP developers have heard and worked with Laravel at least once.
Agents of Transformation are adapting at speed to drive innovation in the experience economy
Research published today by AppDynamics highlights how the role of technologists has evolved over the last four years and reveals the skills, qualities and tools that technologists now need to reach the pinnacle of their profession and become Agents of Transformation.
OpenTelemetry Roadmap and Latest Updates
OpenTelemetry is one of the most fascinating and ambitious open source projects of this era. It’s currently the second most active project in the CNCF (the Cloud Native Computing Foundation), with only Kubernetes being more active. I was at KubeCon Europe last month, delivering a talk on OpenTelemetry and it was amazing to see the full house and the excitement and interest around the project.
What Are Some Useful Things to Look for Right Away When You Get Data into Honeycomb?
At Honeycomb, we love involving our customers when we can. We asked: “What was the first thing you found value from with Honeycomb?” Here are some of our favorite answers.
Stream application logs into Cloud Logging
Kubernetes Monitoring in Grafana Cloud: Getting started
Automate Your Boring Tasks with Python
In many critical areas, you can automate the completion of repetitive chores in an efficient and effective manner by using a computer language such as Python. When you are just starting out, it’s vital to understand the fundamentals of Python via coding examples. However, if you want to improve your Python skills, you should concentrate on constructing things and automating real-world tasks.
Proactive Healthcare Network Monitoring: The Importance of Early Detection
Common Anomaly Detection Challenges & How To Solve Them
Anomaly detection can be defined by data points or events that deviate away from its normal behavior. If you think of this in the context of time-series continuous datasets, the normal or expected value is going to be the baseline, and the limits around it represent the tolerance associated with the variance. If a new value deviates above or below these limits, then that data point can be considered anomalous.
Network Performance Monitoring vs. Application Performance Monitoring: What's The Difference?
Network performance monitoring (NPM) and application performance monitoring (APM) are both key pillars of an overall performance and reliability management strategy, especially when dealing with complex, distributed infrastructure across cloud-native environments. NPM and APM also complement each other, in the sense that NPM can serve as an additional source of truth and observability for application performance.
State of Kubernetes 2022: Report Roundup
According to recent surveys and reports on the industry, Kubernetes and containers are more popular than ever. Containers and serverless functions are being mainstream and ubiquitous – with a more than 300% increase in container production usage in the past 5 years. This trend is especially true for large organizations, which are often using managed platforms and services.
Introducing Splunk Attack Range v2.0
The Splunk Threat Research Team (STRT) has continued focusing development on the Splunk Attack Range project and is thrilled to announce its v2.0 release with a host of new features. Since the v1.0 release 6 months ago the team has been focused on developments to make the attack range a more fully-featured development testbed out of the box. This blog post will share these additions as well as some of the project’s future directions.
Analyzing Test Results Through Your Logs & How to Choose Which Automation Tests to Implement
According to the 2021 test automation report, more than 40% of companies want to expand and invest their resources in test automation. While this doesn’t mean manual testing is going away, there is an increased interest in automation from an ROI perspective – both in terms of money and time. After all, we can agree that writing and running those unit test cases are boring.
Regression tests, your type of test
Has it happened to you that with the release of a new version of your favorite application some feature disappeared? Or it works but unexpected things happen when you execute it? Or does it just crash? Today we will see what the possible tests that guarantee to avoid all of this are: regression tests.
How to Choose the Right Middleware
Selecting the right middleware for your company can be one of the most important decisions that you can make at the outset of a software project, as this will determine how well your business performs going forward. We look at some of the key features from the major integration software providers below.
Unpopular Opinion: OKRs Are the Worst
One of the things about Silicon Valley culture is the obsession around the technology that gets created and the idea of the engineer as the hero of the story. You see the same kind of thing with other professions — like with finance executives in New York, celebrities in Hollywood, or firefighters and police officers in different areas across the US.
New in Grafana 9: Search Grafana panel titles, preview dashboards, better navigation, and more!
The entire team at Grafana Labs is thrilled to bring the community our latest and greatest release, Grafana 9, which we introduced at GrafanaCONline this year. In addition to introducing the Grafana Loki query builder, a new command palette, and making role-based access control GA, we also rolled out major updates to the navigation and search functionality in Grafana with the aim of continuing to support the community and users throughout their observability journey.
Time Series for Intelligent Sustainability
As the world continues to face unparalleled uncertainties due to climate change, using energy efficiently is more important than ever. Time series data plays a critical role in helping organizations operate in a greener and more sustainable way. In Finland, EnerKey operates a platform that drives sustainability and energy management to unearth savings from consumption data.
Top Takeaways from Monitorama 2022
Since 2013, Monitorama has been a community-driven conference, bringing together open source development and operations engineers to focus on pushing the boundaries of monitoring software and practices. It’s chock full of thought-provoking content in the conference talks. The casual atmosphere also makes the hallway track a great way to network with fellow engineers and vendors alike to pick up on new developments in the monitoring space.
Monitoring Windows Infrastructure: Tools, Apps, Metrics & Best Practices
Love it or hate it, many organizations have Microsoft Windows as part of their infrastructure. They usually operate a series of Windows services like: Although surveys report that the market share of businesses using Windows is smaller than that of businesses using Linux, many organizations still use private Windows servers that are not accessible over the internet.
Network Redundancy and Why It Matters
How to renew your license offline
Want to test the power of all-in-one monitoring? Request a free trial of the Enterprise version on our website: https://bit.ly/2O9hoRf
How Modern Log Intelligence Meets New Cybersecurity Regulations by CERT-In
Best AIOps Platforms to Analyze Data Better in 2022
Bank Achieves 199% ROI, $20.3M NPV Over 3 Years and Payback in 6 Mos. with Nastel i2M According to New Independent Study
Total Economic Impact Study evaluates potential business benefits and cost savings enabled by Nastel’s Integration Infrastructure Management (i2M) Platform.
Upload source maps with the Rollbar REST API
The Difference Between Generation 1 and Generation 2 AIOps Platforms
The future of cloud automation for SAP with Google Cloud and Avantra
Introducing our Sentry Integration
At incident.io, we’re continually building out our integrations to work with all the tools you already know and love. Next on the list, is our first bug tracker, Sentry. Try posting a Sentry link on your next incident to check it out.
TL;DR InfluxDB Client Libraries
InfluxDB is very powerful for working with time series data, but learning to use any new tool can be intimidating. The fear of a steep learning curve can delay or even prevent people from using new tools that would ultimately make things easier and more efficient. Fortunately, InfluxDB has over a dozen client libraries so you can work with InfluxDB using a language you already know.
On Counting Alerts
A while ago, I wrote about how we track on-call health, and I heard from various people about how “expecting to be woken up” can be extremely unhealthy, or how tracking the number of disruptions would actually be useful. I took that feedback to heart and wanted to address the issues they raised, and also provide some numbers that explain the position I took with these metrics on alerts.
How continuous profiling can help track resource usage, reduce latencies, and more
In 2019, Polar Signals Founder and CEO Frederic Branczyk predicted that continuous profiling would be the future of observability. Today, he’s making that future a reality with his open source continuous profiling tool, Parca. In this episode of “Grafana’s Big Tent” podcast, our hosts Matt Toback and Tom Wilkie chatted with Frederic about how he got his start in the continuous profiling world and how he’s built an active open source community around Parca.
How to monitor Cassandra using OpenTelemetry
The Insurance of Great Microsoft Teams Monitoring
Just like insurance, a tool that helps you to monitor the quality of your Microsoft Teams service covers you against the issues that IT teams face everywhere. You can’t afford to have downtime in your business, so you need a way to keep yourself protected.
Unlocking Cribl Stream's LDAP Integration
Cribl Stream has supported external Lightweight Directory Access Protocol (LDAP) authentication since version 2.0 was released in late 2019. LDAP directories offer many features, and it’s up to clients to implement them for compatibility. Here is a non-exhaustive list of LDAP features that Cribl Stream does not support: This blog post explores how Cribl Stream implements LDAP for user authentication and assumes you have a working knowledge of the topic.
Sematext Logs Product Overview | Centralized Logging for all of your Applications
Synthetic Transaction Monitoring with Kentik
ManageEngine recognized in the Gartner® Magic Quadrant for Application Performance Monitoring and Observability
Integration means automation: ServiceNow Integration with Avantra
Integrations to third party ITOM/ITSM solutions have been used by all Avantra customers since the beginning back in 2003. Often this is due to corporate support processes and the customer’s wish that all solutions used to manage the entire IT landscape shall report to one single ITOM/ITSM solution. This is where activities of different departments are coordinated.
Expert Series: Broadcom IT Shares Their View on the Difference Between Monitoring and Monitoring Correctly
This post is part of a series featuring customers, partners, and experienced DX Unified Infrastructure Management (DX UIM) practitioners. We’ve asked these expert users to share their knowledge with the broader DX UIM community. Today, we’re featuring Kathy Solomon, the Unix Systems Administrator for the R&D Support organization within Broadcom IT.
7000+ GitHub stars, DIY Query Builder & UX improvements - SigNal 14
How to configure Grafana Loki with a Node.js e-commerce app
I recently changed teams within Grafana and now I get the chance to work with Grafana Loki, our highly effective open source log aggregation system that stores and queries logs from your infrastructure or applications. At Grafana, we always dogfood our products so what better way to learn more about Loki than trying out a simple use case that I can actually benefit from.
How to Increase PHP Memory Limits
Why are PHP memory limits important to your website development journey? PHP is a famous backend technology that is used by many tech giants for supporting their applications. PHP gives many advanced features for making web pages dynamic and integrating some features you can not simply get using javascript, HTML, and CSS. Whenever you set up a new PHP project, some memory is allocated automatically. This memory is mostly suitable for general applications.
TL;DR Geo-Temporal Data and InfluxDB
Geo-temporal data has both location and time. It’s used for all sorts of applications, from tracking shipments, to predicting weather patterns, to building fitness apps. It’s powerful because it lets you know where and when events happen, so you can understand them better and connect them with other events.
How to monitor JVM with OpenTelemetry
Shape the future of apps with AppDynamics Cloud
How to Troubleshoot Amplify APIs
One of the things we love about working in the cloud is the ease and scalability it brings to application development. It enables us to build out applications, APIs and any infrastructure that is needed from prototyping an idea, through to self scaling deployments. Monitoring and troubleshooting production-level serverless applications is always tricky, Especially working across a number of services and the many logs they can produce.
geeks+gurus: Modern Application Architecture
geeks+gurus: Benefits of Cloud Native
geeks+gurus: Tackling Common DevOps and Security Issues in Game Development
geeks+gurus: Sumo Logic's Debut in the Gartner APM (&O!) Magic Quadrant
Introducing Mobile Screenshots and Suspect Commits
Nobody likes using an unstable mobile app or even worse, an app that crashes on them. In fact, 9 out of 10 US and UK consumers report uninstalling a mobile application due to poor performance. Crash rates and snappy experiences matter for all applications, but especially for mobile apps. Mobile app crashes and poor performance not only cause users to abandon an app but can also trigger the app to be ranked lower in Apple App Store and Google Play Store search results.
Seven.One Entertainment uses Datadog to stream live experiences to millions, with confidence
Exporting metrics to Datadog
Monitor custom serverless metrics with the Datadog Lambda extension
When building serverless applications on AWS Lambda, Amazon CloudWatch provides out-of-the-box metrics that measure the performance, errors, and duration of your functions. Although these standard Lambda metrics provide visibility into your serverless applications, it can also be invaluable to monitor custom metrics that are unique to your use case and application.
Find Flow Podcast - The Past, Present and Future of AIOps
Icinga DB Web: Combined permission and restriction management
Last week we released the final first version of Icinga DB and its web interface module Icinga DB Web. Icinga DB Web offers many new features and a completely new design. The monitoring module has its limitations when managing a role, as it handles permissions and restrictions separately. This means that the permissions for a role are not related to the restrictions of the role To understand this better, here is an example.
Continuous Profiling: A New Observability Signal
We’ve all grown used to logs, metrics and traces serving as the “three pillars of observability.” And indeed they are very important telemetry signals. But are they indeed the sum of the observability game? Not at all. In fact, one of the key trends in observability is moving beyond the ‘three pillars: One emerging telemetry type shows a particularly interesting potential for observability: Continuous Profiling.
Link Monitoring: A Comprehensive Guide to Network Optimization
Minify CSS and JavaScript to accelerate website speed
Minification is the technique of terminating all undue extra characters from the source code. This method reduces file sizes, allowing for faster load times and less bandwidth load. Less code appearing in front-end web pages also leads to a more compact, faster-loading website. Most importantly, minification speeds up web pages for users on limited data plans, allowing them to enjoy your content with less worry about exceeding their download quota.
Top 4 Use Cases for Using Restorepoint for MSP Compliance
The managed services provider (MSP) industry is at a pivotal moment in its history. With data management, security, and privacy regulations getting strengthened and added to the books all over the world, and with awareness of the risks associated with those issues on the rise, MSPs must take their role in compliance seriously. Any failure to do so will put individual MSPs at a competitive disadvantage, and incidents involving MSPs will be a stain on the industry’s reputation.
Sneak Peak and a New Query Experience Coming to InfluxDB
Nobl9's Service Level Objectives Platform Runs on InfluxDB
Tracking Service Level Objectives (SLOs) helps developers build more reliable software. At least, that’s the hope of Nobl9. The company’s self-titled SLO platform provides real-time data to software developers, DevOps practitioners, and reliability engineers so that they have the information they need to build reliable features quickly.
We Learn Systems by Changing Them
It is only possible to come to an understanding of a system of interest by trying to change it. Here, Jackson contrasts action research with old-style hard science, which tries to study a system from the outside. Laboratories draw a line between experiment and scientist. In the social world, there is no outside: we participate in the systems we study. I’ve noticed this in code: when I come to an existing codebase, I get a handle on it by changing stuff.
The Difference Between Generation 1 and Generation 2 AIOps Platforms
Monitoring robots in real time with Grafana and other cloud native solutions
Edgardo Peregrino is a freelance software developer, writer, maker and IT technician. For six years now, I’ve been a passionate maker with a focus on robotics. Recently, I entered the world of cloud native computing, which has allowed me to integrate maker projects with open source tools such as Grafana, Prometheus, and Jaeger.
How to Optimize IT Costs with Tailored End User Personas
Standardization (treating everyone the same) may work for IT, but it does not work for employees. If IT gave each employee the same device and tech stack, what would be the result? Some employees wouldn’t have the tools they need, others would have too many. Every employee would be confused and unsatisfied with their work setup. Not exactly the recipe for a productive enterprise with cost effective IT, is it?
Will 'Back to the Office' Mandates Help or Hurt Company Culture?
The past several years have proved that productivity and business growth do not rely on employees going into the office every day. But are the more intangible benefits of in-person work being lost in today’s remote/hybrid workplaces? That’s the question on the minds of a lot of business leaders, particularly as they weigh the pros and cons of a “back to the office” policy.
Why Your Business Needs To Monitor Microsoft Teams
To give your business the best Microsoft Teams experience you need to monitor Microsoft Teams make sure all the features you are paying for are actually working. To do that, you need visibility into how it is working, how well it is working, and where any problems might arise.
How Clever.fm Monitors and Fixes Real Issues
Clever.fm is developing a platform to connect podcast listeners with community and content to make podcasting financially sustainable for creators. Our application provides features such as capturing moments, sharing snippets, and having discussions on podcast episodes.
An Observability Agent for the Cloud Era: Why Cribl Edge Matters
A few weeks ago, I did a live Cribl Edge demo for the Cribl Community, and I wanted to explain more about the importance of Cribl Edge for IT admins. Managing traditional log shipping agents is very time-consuming and brittle. Just the act of a once-a-year upgrade can require the help of a kind god! Admins need help to make this vital workflow easier and faster so they can focus time on delivering value to the business.
Anodot Named Challenger and Fast Mover in FinOps Report
We are excited to share that Anodot’s Cloud Cost Management solution has been named a Challenger and Fast Mover in the 2022 GigaOm Radar for Evaluating Financial Operations (FinOps) Tools report.
Shift Left Testing: 6 Essentials for Successful Implementation
Testing can evoke polarized reactions from developers. Some love it. Some prefer never to hear of such a suggestion. But acts of testing is necessary – especially shift left testing. Testing is often resisted by teams that are pressured by shorter release cycles tend to forgo testing altogether in order to meet deadlines. This results in lowered quality software, which can lead to security vulnerabilities and user experience due to defects.
How to Build Your AIOps Business Case
The Great Resignation comes at an inconvenient time for IT leaders. Needing to accelerate plans for IT transformation because of the pandemic, organizations required more digital technology and services to support the shift to a hybrid workforce. Unfortunately, now organizations are struggling to find enough IT employees-with the right skill set-obstructing these digital transformation initiatives.
Understanding Middleware: What It Is and How It Works
Distributed systems are highly scalable and efficient — but only when integrated into a powerful network. A distributed system can only function if all its applications can communicate effectively with one another. However, this is often easier said than done due to the multi-layered nature of modern architectures. Modern architectures consist of applications written in various languages with different protocols, and they are spread across multi-cloud and multi-cluster environments.
Proactively monitor service performance with SLO alerts
Service level objectives (SLOs) state your team’s goals for maintaining the reliability of your services. Adopting SLOs is an SRE best practice because it can help you ensure that your services perform well and consistently deliver value to users. But to gain the greatest benefit from your SLOs, you need ongoing visibility into how well your services are performing relative to your objectives.
Top Prometheus Interview Questions
If you are an engineer searching for a new role that involves a high level of knowledge on the monitoring stack Prometheus then you will likely wish to brush up on your knowledge of Prometheus ahead of your interview. In this guide, you will find a list of the most popular questions that are most likely to be asked to candidates looking to use Prometheus as part of their daily monitoring stack within their next role.
How Icinga helps Retail Giant Magazine Luiza digitalize Brazil
We are proud of our many customers and users around the globe that trust Icinga for critical IT infrastructure monitoring. That´s why we´re now showcasing some of these enterprises with their Success stories. It´s stories from companies or organizations just like yours, of any size and different kinds of industries. Some of them are our long-standing customers, others have just recently profited from migrating from another solution to Icinga.
Introducing Group Checks | Customizable Downtime Alerting for Interrelated Checks
Have you struggled to quantify the uptime performance of a complex system? With many interrelated parts, it can be easy to tell which pieces are down, but a tougher challenge to view them in the context of those systems. When you’re responding to a major outage, the data on your system’s uptime is just as critical as its components.
Building a quick Reddit Blazor client without Reddit's API
When developing the new exception landing pages we recently launched (like insert exception link here), I wanted to pull some statistics from Reddit. While looking through various ways to integrate, I found an easy approach that I want to share with you in this post. You probably already know Reddit, the highly active social news aggregation and discussion forum. I've found myself using Reddit more and more over the last couple of years, with the dotnet subreddit in particular.
New in Grafana 9: The Grafana Loki query builder makes writing LogQL queries easier
Grafana 9 launched at GrafanaCONline 2022 in June, and one of the biggest highlights was the introduction of the new Grafana Loki and Prometheus query builders. 🎉 We believe that both of them are going to be incredibly useful for our Prometheus and Grafana Loki users. In this blog post, we will focus on the Grafana Loki query builder and share its new features and improvements with you.
NodeJs OpenTelemetry - Implementing Distributed Tracing in a NodeJS Application using OpenTelemetry
Python Instrumentation - Monitor your Python application using OpenTelemetry and SigNoz
Full Lifecycle Application Performance Monitoring is a Money-Saving Hack
IT experts and techies are constantly devising new ways to do more with less in our rapidly evolving world. Traditional platforms monitoring and modern technological maintenance take a large portion of a conventional organization’s IT budget. This leaves limited resources to develop new standards-based and adaptive applications that fulfill core business demands.
Error Monitoring - The Necessary Application Feature
To err is human. The process of software development can’t be error-free; fixing errors is part and parcel of building software applications. And, no matter how much you dislike those harsh error messages when your code fails and exits, you have to admit that they save you from a lot worse.
Data Observability With Robotic Data Automation Fabric
What the Pivot() is Going On with the MQTT Plugin?
The MQTT Consumer Plugin is one of our most widely used input plugins for Telegraf. If you need a little bit of background, then I highly recommend checking out the following: I plan to release an MQTT best practices blog soon, but we thought this plugin partnership was too good not to talk about now.
Insurance Provider Reduces Software Licensing Costs, Saving Millions
PostgreSQL Logging Configuration Explained: How to Enable Database Logs
PostgreSQL is an open-source relational database management system that’s been utilized in continuous development and production for 30 years now. Nearly all the big tech companies use PostgreSQL, as it is one of the most reliable, battle-tested relational database systems today. PostgreSQL is a critical point in your infrastructure, as it stores all of your data. This makes visibility mandatory, which in turn means you have to understand how logging works in PostgreSQL.
How to Optimize Your Peering and Infrastructure Investments
Internet traffic and current events with Doug Madory | Network AF Episode 19
Django Performance Improvements - Part 2: Code Optimization
The following guest post addresses how to improve your services’s performance with Sentry and other application profilers for Python. Check out this post to learn more about application profiling and Sentry’s upcoming mobile application profiling offering. We’re making intentional investments in performance monitoring to make sure we give you all the context to help you solve what’s urgent faster.=
The Cribl Packs Dispensary - A Place to Share and Care
Building Packs is good. Sharing Packs is better! The Cribl Pack Dispensary is the go-to place to find, install and share Cribl Packs. What are Packs? A Cribl Pack is a collection of pre-built routes, pipelines, data samples, and knowledge objects. Packs enable sharing of best-practice configurations that route, shape, reduce and enrich the log source, Palo Alto Networks logs for example. And it’s the quickest, easiest way to get started with Stream and Edge supports Packs too.
Prometheus vs InfluxDB - Key Differences, concepts, and similarities
Regex 101 for Network Admins
The arrival of Pandora FMS in the United States thanks to the master's degree from Rice University
Pandora FMS is an international entity and needs activity. And seeking that activity we set our eye on that great technological power, the United States.
Cloud Configuration Drift: What Is It and How to Mitigate it
More organizations than ever run on Infrastructure-as-Code cloud environments. While migration brings unparalleled scale and flexibility advantages, there are also unique security and ops issues many don’t foresee. So what are the major IaC ops and security vulnerabilities? Configuration drift. Cloud config drift isn’t a niche concern. Both global blue-chips and local SMEs have harnessed Coded Infrastructure.
Thank You 2022 Nastel Advisory Board Members!
Formed in 2021, the Nastel Technologies Advisory Board is made up of business and IT leaders from a wide variety of sectors, across the world. These enterprise leaders and innovators understand the incredibly important role of planning for, and the management of, the integration infrastructure (i2) layer (including messaging middleware, APIs, and much more) in their enterprises to enable meeting IT and larger corporate goals in 2022.
How Core Web Vitals create business impact
What are Core Web Vitals, and why should you care? Let's power through the essentials of CWV, CX and their impact on $$$. This is written with the busy software executive in mind - so we're sticking to a clear, big-picture view of metrics, user experience and revenue. Chances are, if you've heard about Core Web Vitals (CWV), it's been in the form of a stick: something Google is enforcing that can hurt your search engine visibility. We're here to go over the carrot - a quick explainer of Core Web Vitals, and how they can help you connect with customers and drive lasting innovation.
Logit.io Launches Further Improvements To Alerting & Monitoring
We are happy to announce today that we have launched further improvements to the Logit.io platform’s alerting and monitoring features. This latest release of the Logit.io platform offers our users an improved workflow to assist with their productivity on the platform as well as a more updated intuitive user interface (UI).
SAP Auditing: A Complete Introduction
Have you ever wondered what all the fuss is about SAP and its audit process? We'll take a look at the SAP audit process and explain what happens when auditors check your SAP system.
Flask OpenTelemetry - Monitoring your Flask application using OpenTelemetry
The Cost of Production Blindness
When I speak at conferences, I often fall back to the fact that just a couple of decades ago we’d observe production by kicking the server. This is obviously no longer practical. We can’t see our production. It’s an amorphous cloud that we can’t touch or feel. A power that we read about but don’t fully grasp. In this case, we have physical evidence that the cloud is there. A part of this major shift in our industry is a change to our fundamental roles as engineers.
Falcon - Monitoring apps based on Falcon Web Framework with OpenTelemetry
Django - Monitoring Django Application performance with OpenTelemetry
MQTT vs RabbitMQ (AMQP 0.9.1) for IoT
RabbitMQ is an open source server that was created to support the AMQP 0.9.1 messaging protocol. It now supports other protocols as well, including MQTT 3.1.1, but AMQP 0.9.1 is its core method. So here we will compare AMQP 0.9.1 with MQTT. MQTT was designed for the Internet of Things (although it wasn’t called that at the time). Both MQTT and AMQP run over TCP connections, both are client-server in architecture and bi-directional.
Monitor Azure Functions with the Datadog extension for Azure App Service
Azure Functions is an on-demand serverless compute offering built on top of Azure App Service that enables you to deploy event-driven code without the need to provision and manage infrastructure. Because applications rely on Azure Functions to handle business-critical tasks such as processing orders or logging in users, it’s important to ensure that your functions respond quickly when they’re invoked.
The Proactive IT Manager for Digital Experience Monitoring
As remote working culture becomes more prevalent, technology is now at the core of many business operations, and digital experience monitoring (DEM) has never been more important. In today's business, IT must help increase employee productivity and drive business growth rather than just solve problems at the support desk. Many companies have not yet fully implemented their digital experience strategy. As a result, many problems related to different devices, network conditions, and service providers are still plaguing the industry and ruining the employee experience.
Transaction Tracking vs Transaction Tracing - What's the Difference?
Transaction tracking and tracing are not the same thing. One of the top 10 banks in the world recently chose Nastel and this was their primary reason. They had a Priority 1 request processor incident on the mainframe where high value messages went missing and it took two weeks to find them. They began by looking at another vendor who said that they did transaction tracking. As the customer said, "They will try to tell you that they do transaction tracking, and that took us a while to drill down." So, let me explain the difference between these terms using an analogy.
Core Web Vitals for Dev Leads
What is observability? Best practices, key metrics, methodologies, and more
Sometimes the simplest questions prompt the most spirited discussion. Questions like: What is the airspeed velocity of an unladen swallow? What should we have for dinner tonight? Or, as we find out in this episode of “Grafana’s Big Tent" what even is observability?
More support for structured logs in new version of Go logging library
The new version of the Google logging client library for Go has been released. Version 1.5 adds new features and bug fixes including new structured logging capabilities that complete last year's effort to enrich structured logging support in Google logging client libraries. Here are few of the new features in v1.5: Let's look into each closer.
Go Instrumentation - Implementing Distributed Tracing in a Golang Application
Sematext Cloud | Full Stack Visibility in One Place | A Cloud Monitoring solution
Splunk Tutorials: Getting Started Using Splunk
Whether you are new to Splunk or just needing a refresh, this post can guide you to some of the best resources on the web for using Splunk. We’ve gathered, in a single place, the tutorials, guides, links, and even books to help you get started with Splunk.


