Feature Highlight: Logs
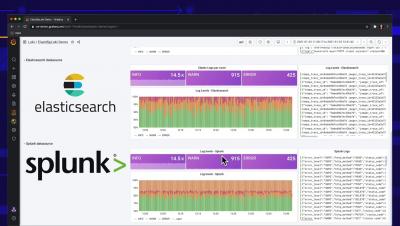
Learn how to add on-demand, real-time Lightrun logs to your application - without ever stopping the running process.


Elastic is “an index”, “a search engine”, “a big data solution”, an analytics platform with advanced data visualizations and incredibly fast search capabilities. In short, it’s a solution for many problems. The Elasticsearch platform provides a distributed search cluster that enables large amounts of data to be indexed and searched at scale.
Coralogix can be configured to automatically and dynamically archive logs to an S3 bucket. This saves Coralogix customers money, but of course there are times when the data needs to be reindexed. This operation counts the reindexed logs against the daily quota. Many times customers would like to search and focus on the exact logs to be reindexed or even query the logs outside of Coralogix all together.
Connect S.P.A. is a European IT company offering services in networking, wireless, security, monitoring, data center, and servers. It has two data centers and nine servers. Before finding OpManager, the IT company was using a network monitoring tool, but it did not offer enough visibility into its network, which made it difficult to troubleshoot and fix recurrent network issues. This led to unpleasant network downtime experiences, especially since the tool Connect S.P.A.
In my last blog post, we focused on creating 29 Enterprise Applications (EA). We also spent some time talking about our Critical Service Offerings (CSO) and Supporting Service Offerings (SSO). And finally, we looked at three out-of-box dashboards. If all you needed was to create a dashboard to control the boxes’ color quickly, you already have what you need.
Server performance monitoring is essential in maintaining the health, safety, and integrity of your business’s servers. For modern businesses, no matter the industry, servers play an all-important role. Whether you store records and sensitive customer data in the cloud, employ a software environment that drives all your company’s business activities, or are in an industry that relies on sensors to power real-world equipment, servers play an essential role.
A VPN connection comes in handy to establish a link between private servers and remote users. As a protected data path, the presence of the VPN tunnel paves the way for improved data security. Therefore, data transmissions between the network and device have the additional security of data encryption. But at the same time many inappropriate IPs can access your VPN, putting data security at stake. So, how do you deal with such situations? You definitely can’t stop using VPNs right.
Kubernetes, also known as K8s, is a container-orchestration platform for automating deployment, scaling, and operations of applications running inside the containers across clusters of hosts. Google open-sourced the Kubernetes project in 2014. According to a recent CNCF survey, Kubernetes is the most popular container management tool among large enterprises, used by 83% of respondents. Containers are a good way to bundle and run applications.
We often hear that our customers love using Splunk, know the power behind our platform and want to expand usage to IT. But they aren’t sure what steps to take first. We want our customers to maximize their Splunk investment and get them jump-started with Splunk for IT use cases by providing the guidance and best practices they seek.
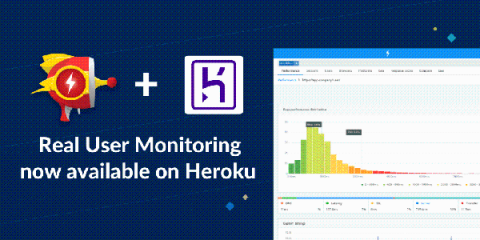
Today, Heroku is used by many developers from a wide range of small to large enterprise size companies. As you are reading this article, you yourself may also be using Heroku to build and operate apps. So, how do you monitor the apps you run on Heroku? It is seen that many people are using Heroku metrics given its standard built-in feature and it being offered for free.
2020 was a whirlwind of a year that took all of us by surprise. As we transitioned to working from home and virtual meetings, we reorganized our priorities, listened to your feedback and requirements, and worked around the clock to deliver a hassle-free monitoring experience. Here's a quick recap of the features we rolled out last year, and a brief note on our plans for 2021.
Recently I got the chance to attend a PromQL training conducted by Julius Volz, the co-founder of Prometheus, and in this post I am going to share some of the key takeaways from my experience.
At InfluxData, we believe it makes sense to use a time series database for security monitoring. In summary, it’s because security investigations are inevitably time-oriented — you want to monitor and alert on who accessed what, from where, at which time — and time series databases like InfluxDB are very efficient at querying the data necessary to do this.
On Wednesday January 27th, 2021, Microsoft Office 365 experienced an outage affected a number of its services with a prolonged outage affecting Exchange Online.
As with any service in the cloud – particularly Microsoft 365 – it’s difficult to determine where along the path from user to Microsoft service lies the source of a service delivery problem. Without visibility into the entire spectrum of possible root causes – from endpoint to Microsoft cloud service – it’s nearly impossible to respond and potentially remediate the issue.
Serverless has been gaining more and more traction over the last few years. The global serverless architecture market was estimated at $3.01 billion in 2017 and is expected to hit $21.99 billion by 2025. The number is reflected in the increasing amount of enterprises starting to look for ways of decoupling their current monolithic architectures and migrating their stack to serverless. Read more about the popular enterprise use cases for AWS Lambda.
WebPageTest tries to use real browsers and devices for testing whenever possible, but doing that at scale has some serious challenges, particularly when it comes to testing mobile browsers. There are a lot of different moving pieces, from the device itself to everything that needs to be in place for traffic shaping. The phones themselves pose significant reliability challenges.
January 20, 15:01 UTC. I was sitting in my home office, watching the screen and feeling a mix of emotion and nostalgia as a pod was getting terminated. We have thousands of pods, continuously starting and terminating, and I’m definitely not spending my days watching them, so why was this one special? The terminating ingester-0 pod was the very last Cortex ingester running on chunks storage in Grafana Labs’ infrastructure.
We asked in a recent poll which popular TV show your IT team resembles the most. Big Brother came out on top, with almost 40% of respondents saying that their incident resolution process most resembled this show. Would you compare your incident management process to an episode of Big Brother? If so, it's likely that your IT environment is highly monitored, but incidents still seem to slip through the cracks.
Not a great statistic, but are bad digital experiences really that costly? A bad digital experience is when a website is slow, unreliable, and/or insecure. Is it slow to load, are there errors affecting our SEO, is a third party broken, or is payment data being stolen right from their device? These issues are all reputation damaging, more so than ever in an increasingly socially connected world.
What are the most important database performance metrics, and how do you monitor them? This is a question many IT professionals would like the answer to. We can collect and use a wide range of database metrics to analyze database and server resource consumption, not to mention overall usage. You are probably wondering why this is essential for business, so let’s explore this next.
APIs have become the de-facto standard in building and running modern applications. They are an integral part of the automation workflow of any business and as more users rely on your APIs to power their applications, the need for them to be reliable is important. Any degradation in their health, availability, and performance will impact your business, so ensuring its reliability depends on proactively monitoring your APIs.
SAN FRANCISCO — January 28, 2021 — InfluxData, creator of the time series database InfluxDB, today announced it has achieved Service Organization Control (SOC) 2 Type II compliance for InfluxDB Cloud, the fully managed and serverless time series platform. The certification demonstrates InfluxData’s ability to implement critical security policies and prove compliance over an extended period.
High CPU temperature is a common issue with laptops and desktops, and it shouldn’t be ignored. If a computer system routinely generates high temps—above 80°C is usually considered undesirable—it can begin experiencing poor system performance. Over time, heat may progressively damage CPU components in addition to causing the system to lock up or shut down.
At InfluxData, we focus on our customers’ productivity — time to awesome, as we call it. Usually this is about product capabilities — InfluxDB’s features, speed, scalability, etc. But for some, your project will grow in size to the point where you need to purchase InfluxDB. And in some cases, you’ll need your compliance and/or security teams to sign off on the purchase.
Our recent speed comparison of major headless browser automation tools, namely Puppeteer, Playwright and WebDriverIO with DevTools and Selenium, received a very positive response. The single most common ask from our readers was that we follow up by including Cypress in our benchmark. In this article, we are doing just that - with some precautions.
VirtualMetric, an all-in-one monitoring solution, announces a partnership with OCS Distribution, the leading broadline* technology distributor in Russia. This partnership will provide over 7000 resellers throughout Russia with access to the VirtualMetric monitoring suite. With over two decades of experience and 26 offices across Russia, OCS Distribution became one of the leading distributors in the Russian IT market.
It’s January 2021 and you’ve probably broken five out of six New Year’s Resolutions. I don’t want to be the reason for breaking your last one, so I’ll cut right to the chase. We just released an update to our JavaScript SDK with the ability to track the health of your releases and support for Web Assembly. Still with me? Great.
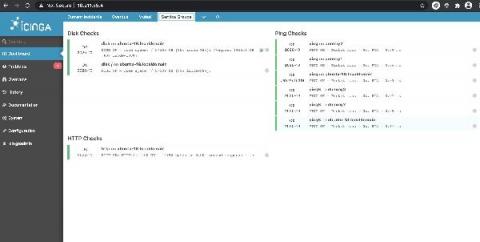
In this blogpost, I explain how to create dashlets using custom filters. This way you can create dashlets of your own which you find is necessary. Having dashboards in fact improves monitoring. Dashlets are the different sections under the given dashboard, which are the snapshots of some monitoring views and are defined by a name. Requirements: Icinga 2 and Icinga Web 2 installed.
In this How-To video, we’re going to look at Real User Monitoring in the context of how you can apply it to a specific use case. Real User Monitoring, or RUM, is an event-based solution for monitoring customer experience. In other words, it measures the performance of a webpage from the perspective of the user’s machine. In our previous video on RUM, we looked at how to set up a RUM tag. Today, we’ll specifically examine RUM data in the context of improving SEO scores.
This article was written by Codebase, a UC Berkeley student organization. Hello InfluxData community! We are a team from Codebase, a UC Berkeley student organization that builds software projects for high-growth tech companies. This past semester, the eight of us had the incredible opportunity to work with InfluxData to add cloud-controlled configuration management features to Telegraf.
Even before new hybrid workforce models, many companies already moved a lot of services to the cloud. COVID-19 digital transformation strategies instantly increased the number of access points and endpoints. This led to a rapid increase in event log data followed by all kinds of other issues -- performance, availability, security, and ultimately increased IT costs amongst other things. A centralized log management solution for your cloud environment can help you manage the above and more.
Monitoring vs observability – is there even a difference and is your monitoring system observable? Observability has gained a lot of popularity in recent years. Modern DevOps paradigms encourage building robust applications by incorporating automation, Infrastructure as Code, and agile development. To assess the health and “robustness” of IT systems, engineering teams typically use logs, metrics, and traces, which are used by various developer tools to facilitate observability.
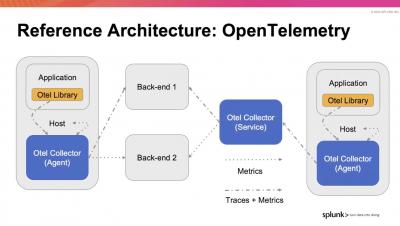
Today I’m happy to announce that observIQ’s Stanza Log Agent will become a key part of the OpenTelemetry project. This has been in the works for many months and the team at observIQ is thrilled to see it becoming a reality. We’re particularly pleased to see it happening just as we launch our log management platform which will be the first platform to take full advantage of the log agent technology now incorporated into OpenTelemetry.
The year 2020 was uniquely challenging for business and IT leaders around the world. The sudden shift en masse to remote work put tremendous pressure on IT teams to pivot and keep the show running for business continuity. Going digital is no longer a debate and digital transformation became more than a project in the distant future. So what else has changed in the IT leader’s playbook? We spoke with veteran CIO and author Mark Settle.
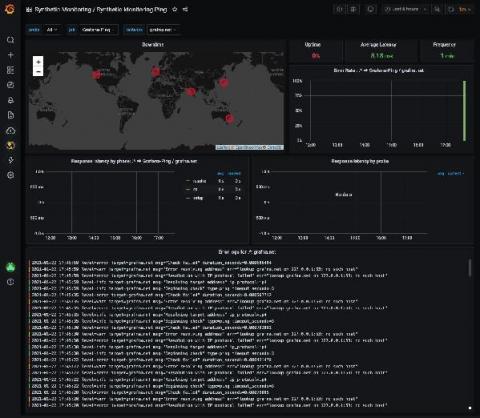
We recently launched synthetic monitoring, which helps you understand your users’ experience and improve website performance by proactively monitoring your services. This feature, which surfaces the powerful capabilities of Prometheus blackbox exporter, is the next iteration of worldPing.
As government agencies accelerate migrating their operations to the cloud, they need to adhere to strict compliance and security standards. The Federal Risk and Authorization Management Program (FedRAMP) provides the standard that these agencies—and their private-sector partners—must meet to work and manage federal data safely in the cloud.
In this article we explore the basics of monitoring Amazon Web Services (AWS) by feeding metrics to Grafana through Hosted Graphite’s agent and also through Hosted Graphite’s AWS add-on. This will allow us to monitor metrics from applications and servers hosted in AWS with clarity and depth. This article assumes you have created a Hosted Graphite account.
As part of my job as a tech evangelist and a pre-sales engineer here at SquaredUp, I often find myself talking to a lot of people. And understandably, when you as a consumer are trying to evaluate a product that you may potentially invest in, it’s only natural that you want to compare different products and decide which one’s better and/or offers more value for money and why.
Monitoring is a major part of a Managed Service Provider or MSP. After all, it emerged as remote management and monitoring (RMM) of servers. However, today MSP’s scope is well-defined and distinguished from standard RMMs. Nevertheless, monitoring is still a key service that these companies provide to their clients. Managed service providers take care of all the IT infrastructure of their clients.
We’re happy to announce the release of AppSignal for Elixir 2.1.0. 🥳 In this version, we’ve made our error helpers more flexible than before. You could already send Elixir exceptions directly through AppSignal and now you can add extra metadata to errors when using send_error/2-4. Let’s go through all of the changes 😀
Syslog takes its name from the System Logging Protocol. It is a standard for message logging and has been in use for decades to send system logs or event messages to a specific server, called a Syslog Server.
In a previous post, we went through a few input plugins like the file input plugin, the TCP/UDP input plugins, etc for collecting data using Logstash. In this post, we will see a few more useful input plugins like the HTTP, HTTP poller, dead letter queue, twitter input plugins, and see how these input plugins work.
The Raspberry Pi is a popular and inexpensive device that comes in many shapes and forms. It’s a popular hobbyist tool that is generally purchased to run all kinds of software experiments on. But make no mistake, even though a Raspberry Pi comes in a tiny form factor, it’s a fully functional computer!
Welcome to “The Top”, a program for grandfathers and children, for those who are idly hanging around and those who are natural achievers, for both nerds and popular quarterbacks. In short, this versatile and massive show is devoted to making the most unusual and genuine rankings.
When performing critical security investigations and threat hunts using Elastic Security, the Timeline feature is always by your side as a workspace for investigations and threat hunting. Drilling down into an event is as simple as dragging and dropping to create the query you need to investigate an alert or event.
The top priority of a typical IT team has remained relatively unchanged for decades: provide support for employees and make their user experiences as smooth as possible. With that being said, the actual workflow of an IT team looks nothing like it did years ago — because the way employees work on a day-to-day basis has drastically changed.
As reported by Forrester in Q4, 2020, nearly a dozen technology vendors are riding a new wave of End-User Experience Management (EUEM) in IT right now—an exciting, emerging market that directly benefits IT departments and the employees they support.
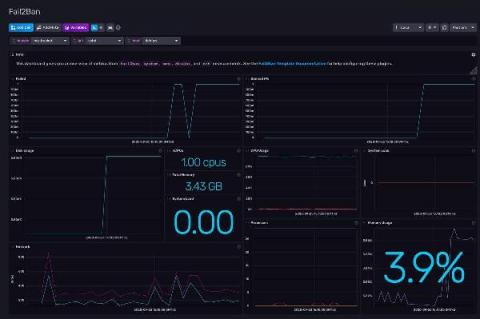
If you have a server open to the internet on Port 22 (the default port for SSH servers), it’s common to find several “Failed password” in your auth.log (log file) every minute, due to bots constantly browsing the internet for servers that are easy to hack with common passwords. But if your auth.log is growing very fast and SSH daemon randomly refuses to create new connections, then someone probably marked your server as a target for coordinated SSH brute-force attack.
So you've set up a Google Cloud Logging sink along with a Dataflow pipeline and are happily ingesting these events into your Splunk infrastructure — great! But now what? How do you start to get meaningful insights from this data? In this blog post, I'll share eight useful signals hiding within Google Cloud audit logs that will help you uncover meaningful insights. You'll learn how to detect: Finally, we’ll wrap up with a simple dashboard that captures all these queries in one place.
I’ve recently started working on a new project to build a Discord bot in Go, mostly as a way to learn more Go but also so I can use it to manage various things in Azure and potentially elsewhere. I figured it’d be useful to document some of this project to give some insights as to what I’ve done and why. Next up is the bot itself and how I integrated it into Honeycomb to get some visibility on how different commands are running.
InfluxDB is great at capturing many kinds of metrics and allowing end users to aggregate those metrics to custom time groupings whether you’re watching IoT devices perform at 10-minute intervals, GitHub repositories issues close over weeks, or web performance metrics over seconds. Dashboards provide that information at a glance, at precisely the intervals you’ve determined. But what about the next level?
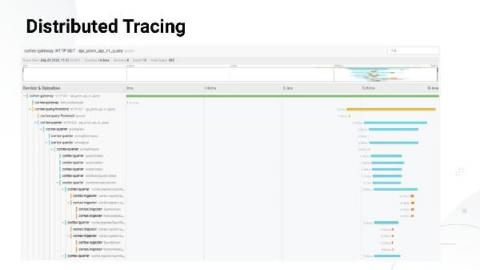
Most people are instrumenting their applications, with logs being an easy first step into the observability world, followed by metrics. Tracing lags behind these two and is maybe a little less used than other observability patterns. We hope to change that.
Databases are everywhere these days, every application uses databases to store, organize and retrieve data. It has become more efficient than paper storage since it does not require more space and can also be easily accessed by multiple users at a time. There is an increase in demand for processing vast collections of data and this has become the most important reason for several companies to use databases.
Google has been saying for a long time that its primary goal is to improve the Internet in terms of increasing the quality of websites and the content published on them. This fits in with typical business goals (not so widely announced), i.e. maximizing revenues generated by a search engine. The better quality of search results provided to users, the more clicks. And the quality of results will never be higher than the quality of the best pages and content available for a given query.
We are thrilled to announce that among our other big plans for 2021, we have migrated and upgraded our much-loved Community Answers platform! It is now a lot easier to connect with the rest of the monitoring community and get the answers you are looking for.
Mediatonic is a sprawling video game studio based in the UK, with a number of successful titles to their name: Heavenstrike Rivals, Gears POP!, and Murder by Numbers among them. In 2020, they struck gold again with Fall Guys: Ultimate Knockout. But this game would be special, and the need of handling these kinds of gaming logs at this kind of scale would be, too. This battle royal-style fighting game pits 60 players against each other until one reigns supreme.
Do you want to test the power of all-in-one monitoring? Go to our website https://shop.pandorafms.com/es/
In this handbook, we’ll explain the AWS Step Functions Input and Output manipulation. There’s plenty to talk about AWS Step Functions. There are numerous articles available online talking about AWS Step Functions ever since Step Functions were introduced in 2016. Most of these articles might make you think that Step Functions are actually an extension of the Lambda function, allowing you to combine several Lambda functions to call each other.
The shift to Observability Over the last six months, unified monitoring, log management, and event management vendors have reoriented their technology portfolios (often without any change to the underlying functionality) towards Observability. In so doing, a fair amount of confusion has been generated in the market.
Recently, I presented at .conf20, Splunk’s annual user conference, on link analysis, where I promised more technical details on the topic in the coming weeks. To keep my promise, I’ve started a three-part series to show you how to use Splunk for link analysis.
The recent changes to the Elasticsearch license could have consequences on your intellectual property. On the 14th of January 2021, Elastic announced through their blog that Elasticsearch and Kibana will be moving over to a Server Side Public License (SSPL). This license change, effective from Elasticsearch version 7.11, has business owners that rely on the ELK stack rightly concerned.
SCOMathon 2020 was one of the highlights of Microsoft SCOM community-driven events last year. Within a 16-hours marathon on all things SCOM, high-class tutorials were delivered to an excited audience of over 1.000 participants, eager to learn the latest hot topics to evolve their SCOM knowledge. Not to mention the overwhelming runner’s high when crossing the finishing line along with so many like-minded people.
At Google Cloud, we strive to bring Site Reliability Engineering (SRE) culture to our customers not only through training on organizational best practices, but also with the tools you need to run successful cloud services. Part and parcel of that is comprehensive observability tooling—logging, monitoring, tracing, profiling and debugging—which can help you troubleshoot production issues faster, increase release velocity and improve service reliability.
Earlier this week, I wrote a blog stating our intention to fork Kibana and Elasticsearch. This was a huge decision on our end, one that we did not take lightly. A few days have passed since this announcement and I wanted to share how humbled and excited we are with the responses from companies and individuals who are eager to participate and contribute.
Server Performance Monitoring is referred to as consistent monitoring of all network infrastructure, related to servers, to analyze their resource utilization trends and later on optimize it for a smooth end-user experience.
In my position, I get to work with a wide variety of organizations that each have a different level of monitoring maturity. But I’ve noticed an emerging pattern that I’ll call the ‘Critical Service Offering’ or ‘Executive Level Status’ dashboard. At their most basic level, these dashboards should communicate the current health of the application, provide some historical context and, most importantly, not be tied to infrastructure monitoring.
One of our most exciting new projects at Splunk is coming to life. Over the past year, we have been hard at work putting together our vision: a place where Splunk admins, NOC/SOC teams, data analysts, and data scientists can collaborate, experiment, and operationalize their work, all in a single environment inside the Splunk ecosystem. We call it Splunk Machine Learning Environment (SMLE).
Although AWS Lambda is a blessing from the infrastructure perspective, while using it, we still have to face perhaps the least-wanted part of software development: debugging. In order to fix issues, we need to know what is causing them. In AWS Lambda that can be a curse. But we have a solution that could save you dozens of hours of time. TL;DR: Dashbird offers a shortcut to everything presented in this article.
What is the usual criteria in choosing an online store? It should have reasonable prices, sell quality products, and most of all, it should have a fast loading time. A website’s performance is essential. A two-second delay can make a big difference to your website and revenue as well. In fact, Neil Patel reported that a mere second delay may cost an e-commerce site up to $2.5 million in sales annually.
“What’s that? You want me to send you a large video file or something? No, that’s not a problem, it’s actually easy, I’ll just stick it on Box. Or DropBox, or stick it on WeTransfer and then we’ll do a quick Zoom to go through it – what?
In my position, I get to work with a wide variety of organizations that each have a different level of monitoring maturity. But I’ve noticed an emerging pattern that I’ll call the ‘Critical Service Offering’ or ‘Executive Level Status’ dashboard. At their most basic level, these dashboards should communicate the current health of the application, provide some historical context and, most importantly, not be tied to infrastructure monitoring.
Three years ago, when we released Embedded Views into beta, we were excited to enable customers to share log lines in a customized way outside of our web application. However, it's become clear that the vast majority of our users prefer having the full functionality of our web application when exploring their logs rather than using an Embedded View.
Microsoft Internet Information Services (IIS, formerly known as Internet Information Server) is an extensible web server software created by Microsoft for use with the Windows family. IIS supports various protocols, including HTTP, HTTP/2, HTTPS, FTP, FTPS, SMTP, and NNTP. According to the most recent ranking by W3Techs, Microsoft IIS is the second most popular web server technology behind Apache.
Azure IoT Edge is a Microsoft Azure service that allows you to run containerized workloads on IoT devices. With IoT Edge and Azure IoT Hub, Azure’s device-management platform, organizations across science, manufacturing, energy production, and other industries can provision their IoT devices and workloads at the edge of their cloud networks for immediate in-unit computing, a necessity when running AI algorithms or parsing large datasets directly on IoT devices.
In this information technology era, Application Performance Management (APM) monitors the performance of software applications and identifies the problems related to application performance as a service to the users. APM can be monitored or tracked using categories like load time, the response time of the application, etc. Nowadays, the applications are becoming more and more complex and distributed by using some technology in it.
Making predictions is a tricky business at the best of times, but especially after a year that turned the world upside down. Even so, we have decided to talk to the IT leaders and discover what we should get ready for in 2021. With technology development, COVID-19 impact, and the new cybersecurity issues happening in the world, the IT engineers responsible for the IT infrastructure monitoring should be always ready to adapt to the new challenges.
Are you putting the final touches on your plugin before you submit it to the Grafana plugin page? In this article, I’ll share a few tips for how to add that extra polish to your plugins. This article assumes that you already have some knowledge of building plugins for Grafana. If you’re looking to build your first plugin, start by following one of our plugin tutorials.
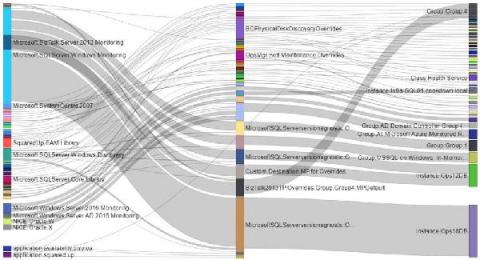
Did you catch our recent webinar on how PowerBI makes it possible to visualize override sprawl in SCOM with Sankey Diagrams and want to give our Sankey diagrams a go yourself? You are in the right place. Before you dive in, take a look at our blog explaining the “why” to using Sankey PowerBI diagrams to see your overrides, and how to take action based on what you see here.
DevSecOps — or the merging of Ops and Security — has been at the center of discussion for the better part of the outgoing decade. Today, the complexity of infrastructure change, demands security and DevOps teams to work together more efficiently. But there are hurdles to adoption of DevSecOps as a methodology. Cloud-native applications often live in multiple clouds across data centers, co-location, and public clouds.
All IT support teams know that problem management is used to identify the root causes which help to permanently resolve recurring incidents and follows specific steps like: However, problem management still remains an underrated, underutilized process which is mostly used together with incident or change management process. Problem management, out of all the ITSM processes has one of the lowest adoption rates.
While the Docker buzz has faded a bit, replaced by new words like “Kubernetes” and “Serverless”, there is no arguing that Docker is the default toolchain for developers looking to get started with Linux containers, as it is fairly ubiquitous and tightly integrated with a variety of platforms.
The modern enterprise network is akin to the transcontinental railroad system in the United States in the early 20th century: it was far-reaching and commerce depended upon the reliability of the rail service connecting crucial goods with Americans in every town and city. Likewise, networks today are intrinsic to commerce (and daily life) yet they are entangled and multi-layered.
Think about any sport or competitive activity, whether that’s football or a spelling bee. They always feature at least one person who acts as a moderator, referee, or judge. With their domain expertise, this person watches everyone’s behavior and constantly compares that against a set of rules. If someone crosses that threshold, they blow a whistle or throw up a flag. They are, in effect, saying that things have gone from OK to not OK.
We recently ran a quick poll where we asked the audience, “When an IT incident occurs at your company, what TV show does it most resemble?” Twenty-three percent of respondents told us that CSI: Crime Scene Investigation resembled them the most. We needed to dig into that a little deeper. Let’s walk through the typical steps of figuring out the root cause, in CSI fashion: Photographs are critical in the world of CSI.
Two weeks ago, Icinga 2 Config Sync: Behind the Scenes explained how the config sync in Icinga 2 works and how you can look behind the scenes. Today, we will put our knowledge from that post to the test and try to manually replicate the config sync. The most important takeaways will be recapped in this post, but if you are interested and have the time, the other post is also worth a read.
Some devs use JavaScript in the browser; some use JavaScript on the server. What if you do both?
As technology evolves so do the needs of an organization that rely upon it; the ability to quickly adapt has become more important than ever, especially as of late. However, this doesn’t mean that adopting new technology isn’t without its own set of challenges. Take operating in the cloud for instance; one of the trade-offs is visibility.
In this article, learn which API metrics you should watch and how Uptrends’ API Monitoring can help you with API tracking and reporting. It is important to know the availability, speed, and validity of API responses whether you publish an API for consumption or your website or app relies on one or more APIs. If an API slips in any of those areas, you’ve got potential trouble. Uptrends API Monitoring has multiple ways to enable you to safeguard your APIs.
As the Trump Administration comes to a close, there is no better time than the present to reexamine the Department of Defense Digital Modernization Strategy and its potential sustainment beyond January 2021.
Recently, I saw a video from a really great developer and YouTuber, Ben Awad, where he discussed Serverless not make any sense. Even though I really enjoyed the video, I am not sure if the author’s points about serverless are entirely valid, and I want to discuss them in this article.
Today we finally have great news to share for everyone using Icinga to monitor Hyper-V and Windows Cluster environments. For quite some time we’ve been working on multiple new plugins to provide better monitoring option for Hyper-V and Windows Cluster. The new plugins are based on our PowerShell framework provided by Icinga for Windows. For the new plugins we decided to provide a preview first, in favour of a final release.
In this tech tip, we are focusing on HLS (HTTP Live Streaming), a streaming protocol released by Apple in 2009. HTTP Live Streaming is widely used and it isn’t just limited to streaming services like Netflix or YouTube – it’s an important protocol for all content providers and CDNs. You’ll basically find HLS anywhere people want on-demand streaming.
Centralized Log Management offers the visibility you need to optimize your cloud usage to keep infrastructure costs down. Cloud-first infrastructures are the future of modern business operations. As organizations like Google and Twitter announce long-term plans for enabling a remote workforce, maintaining a competitive business model includes scaled cloud services adoption. While the cloud offers scalability that can save money with pay-as-you-need services, managing the costs is challenging.
Recently, I’ve been on a mission building a new Microsoft Office 365 Email Add-on for Splunk. This has been built for use with Splunk Enterprise, while making sure that it properly supports Splunk’s Common Information Model (CIM). CIM is paramount when wanting data to play nicely with Splunk Enterprise Security.
A couple of days ago, Elastic announced that it will change the licensing of Elasticsearch and Kibana as of the 7.11 release to a proprietary dual license (under the SSPL license) and away from the open-source Apache-2.0 license. This move has caused extensive turmoil and frustration in the open-source community, especially with organizations that rely on Elasticsearch. Let me start with the end in mind.
Let’s say you get an alert that one or more queries is slow. Or that your users complain, whichever comes first 🙂 We’ve all been there… How do you find the root cause for this slowness and then fix it? In this article, I’ll go through my usual thought process: first, I’d try to find which queries are slow. Then, I’d dig deeper: Let’s take a specific example and run through each step.
In order to continuously improve your Ruby application, you need to understand everything your code touches. That means visibility into how your frontend responds to the database queries that are central to your Ruby application. Sentry’s new Ruby SDK collects and monitors the data surrounding your traces, logs, and key metrics. With it, you now have the context to connect backend issues to frontend performance.
Yup – we've now got a health explorer for Azure VMs! Health Explorer… now why does that sound familiar? You’ve probably guessed it by now, but here’s another hint: Hmm…now where have I seen that before? Right – in SCOM!
As a customer-focused company, which pays a lot of attention to its client’s needs and requests, while keeping pace with the market dynamics, VirtualMetric has always followed the approach of continuous product development. Our ongoing improvement process allows us to develop, test and release new features and product capabilities of your all-in-one monitoring software at short time intervals.
We just released a Magic Dashboard for Garbage Collection stats for our Node.js integration. If you are leaking memory, this dashboard will help you discover and fix this problem. No setting up is required, this dashboard will magically automatically appear among the rest of your dashboards. ✨
In the modern era of digital businesses, web applications need to deliver on several grounds–performance, user experience, robustness, and scalability. However, many developers might agree that performance is of the utmost importance in any software application. The bells and whistles of a fancy UI and extensive functionalities can sometimes force performance to take the back seat. Additionally, there are a lot of reasons for performance to degrade over time.
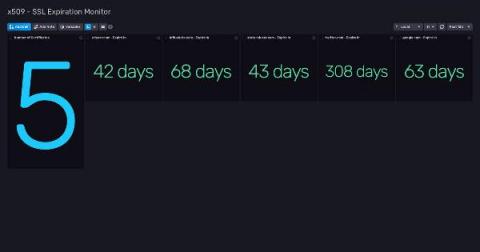
In my previous work experience, monitoring certificate validation was critical to our team. These certificates were used to sign commercial transactions between the payment gateway (us) and other providers. That check was manual and depended on the calendar of one person. So, if that person forgets to notify the team about the upcoming expiration of one certificate and doesn’t start the procedure of getting the new one, well, the platform starts to fail.
In a previous post, we explored the basic concepts behind using Grok patterns with Logstash to parse files. We saw how versatile this combo is and how it can be adapted to process almost anything we want to throw at it. But the first few times you use something, it can be hard to figure out how to configure for your specific use case.
This article is a full tutorial on HAProxy monitoring and the best tools to get it done right. We will be looking into how to collect HAProxy metrics using a collectd daemon, push them into Graphite and visualize them in Grafana. To follow the steps in this blog, sign up for the MetricFire free trial, where you can use Graphite and Grafana directly in our platform.
This blog is the second in a two-part series and was adapted from The Enterprisers Project. At a time when CIOs can use cloud infrastructure to turn on new money-making services for customers overnight, how should we measure IT success? Hint: It's not about uptime. In part 1 of this series, we talked about how traditional IT metrics such as server capacity, I/O, utilization, and network throughput are less relevant today in our highly-digital world.
Microsoft SharePoint Online empowers 200 million monthly active users worldwide through simple sharing and seamless collaboration, driving team efficiency, maximizing knowledge velocity while bringing a rich digital experience to every device. Launched in 2001, SharePoint celebrates its 20th anniversary in 2021, welcoming new users on a daily basis. Make sure your SharePoint Online users are delighted with the speed and smooth interaction with your Microsoft SharePoint Online services.
ASP.NET offers many benefits, such as improved security, easy updating, language independence and less overall code. With that said, .NET is not without errors and issues, even when working with a professional, such as this .NET development company. One common error is an Application_error in the Global.asax file. Let’s understand how to handle ASP.NET App’s Global.asax and other common errors in .NET.
At first glance, all serverless monitoring services seem similar and aim to solve the same problems. However, in Dashbird, we have made decisions that fundamentally differentiate us from our competitors since day one. Over time, those differences have magnified and we have found increasing confirmation and confidence in our approach. Dashbird product strategy is based on three core pillars.
Did you know that you can easily upgrade to the next version with the Update Manager? Contact us to try Pandora FMS Enterprise and know all its advantages: https://bit.ly/2O9hoRf
AWS AppSync is a fully managed GraphQL service that makes it easy for you to build scalable and performant GraphQL APIs without having to manage any infrastructure! With AppSync, you get a lot of capabilities out of the box. Such as the ability to integrate directly with DynamoDB, ElasticSearch, Aurora Serverless, and Lambda. AppSync also supports both per-request as well as per-resolver caching and has built-in integration with CloudWatch and X-Ray.
AWS Lambda is a serverless compute service that runs your code in response to events and automatically manages the underlying compute resources for you. The code that runs on the AWS Lambda service is called Lambda functions, and the events the functions respond to are called triggers. Lambda functions are very useful for log collection (think of log arrival as a trigger), and Coralogix makes extensive use of them in its AWS integrations.
Modern datacenters can contain thousands of network appliances, such as routers, switches, firewalls, and servers, so it’s important for your monitoring strategy to provide comprehensive visibility into every piece of your infrastructure. Datadog Network Device Monitoring already allows you to collect a wealth of telemetry from all of your SNMP-managed devices, which are automatically discovered by the Datadog Agent.
Istio is an open source service mesh that provides an abstraction layer for network traffic between applications, so you can run canary deployments, implement circuit breakers, and otherwise manage the architecture of your network using high-level configuration files. As service meshes become increasingly popular among containerized environments, dev and ops teams need to ensure that Istio is healthy, performant, and routing traffic as intended to keep their network infrastructure running smoothly.
Recently, I led a webinar on Sensu cluster federation and some of the ways users can effectively use Sensu’s API. With the API, you can create as many clusters as needed and federate them without much effort. Also, Sensu makes the management of these clusters very easy by allowing you to manage access using a single web UI. In this post, I will recap the webinar, with step-by-step demos that will touch on how you can.
Software metrics measure a software’s characteristics in a countable manner. That is why tracking the metrics is a huge part of the development stage. The goal of system metrics monitoring is to determine the quality of the product or process during the development and deployment stages. However, not all metrics are beneficial to your software development. That is why you need key performance indicators (KPI) that will help your processes to move forward.
With Kinesis Firehose being Splunk’s preferred option when collecting logs at scale from AWS Cloudwatch Logs, we’ve seen plenty of posts on setting this up, automation and examples on transforming event content. But what about when things go wrong?
Do you have an application that’s a little… sluggish? Cloud Profiler, Google Cloud’s continuous application profiling tool, can quickly find poor performing code that slows your app performance and drives up your compute bill. In fact, by helping you find the source of memory leaks and other errors, Profiler has helped some of Google Cloud’s largest accounts reduce their CPU consumption by double-digit percentage points.
SNMP stands for Simple Network Management Protocol. It is often not simple; it does not only apply to network devices and often cannot be used for management of devices, only monitoring. It is definitely a protocol, however.
At RapidSpike everyone gets involved with product and feature ideation, including our customers! We pride ourselves on being responsive to your needs, taking your feedback, and turning it into our next great feature — after all, you know what you need. We’re here to listen and our developers love tackling a new challenge and solving a tricky problem. This has trickled down into one of our latest features — Configurable Assurance Alerts.
This blog is the first in a two-part series and was adapted from The Enterprisers Project. In 2020, a year like no other, is it still useful to measure IT value based on green, yellow, or red lights on a screen? Now that infrastructure is everything – powering productivity, cutting OPEX, and supporting digital initiatives that may change overnight – flashing lights on a monitor are no longer enough to keep the wheels moving.
NVIDIA Jetson is a family of embedded, low-power computing boards designed to support machine learning and AI applications at the edge. Organizations use Jetson boards for complex video and image processing and analysis, automating build processes in factories, and improving city infrastructures. For example, Jetson-based devices enable cities to analyze traffic patterns with their existing traffic cameras in order to find ways to improve their most congested intersections.
Serverless platforms like AWS Lambda have helped accelerate application development by removing the need to provision and manage infrastructure resources. However, serverless architecture presents new monitoring challenges. Because AWS Lambda handles underlying infrastructure for you, you don’t have access to system-level metrics. Instead, you have to monitor your Lambda functions for insight into their performance and resource usage.
There are some things in life that seem too good to be true. So good, in fact, that they border on the edge of mythology. We see this often in the case of Cross-Domain Topology. Cross-Domain Topology ties together all the pieces of a hybrid, dynamic IT environment, so you can instantly see how changes impact your environment. It’s something that a lot of people didn’t even think was a possibility. While unicorns are myths, Cross-Domain Topology is very real. Here’s how it works.
Three years ago, Tom Wilkie and Frederic Branczyk sketched out the idea for Prometheus monitoring mixins. This is a jsonnet-based package format for grouping and distributing logically related Grafana dashboards with Prometheus alerts and rules. The premise was that the observability world needed a way for system authors to not only emit metrics, but also provide guidance on how to use those metrics to monitor their systems properly.
Rapid Circle has been providing information and communication technology services to organizations since 2008. The company offers cloud workplace and managed cloud services like data center migration, adoption and change management, and other cloud solutions that help organizations cut costs, improve productivity, and contribute to innovation, internal communication, and collaboration.
Times change and so we do. If you are one of those who pay attention to their surroundings, who does not miss anything, you surely realized that our website has since a few days ago a mysterious new tab in its browsing menu that corresponds to the acronym “SaaS”.
It’s been said that the devil is in the details. Well, along the same lines — and as we all know from miserable experience — when it comes to guarantees, the devil is in the small print. And there’s no better (or worse) example of this than with respect to the gleaming, confidence-inspiring claim by web hosts that they deliver 100% guaranteed uptime. Except, well, they don’t.
One problem that pops up quite frequently when people try to build serverless applications with AWS API Gateway and AWS Lambda is Execution failed due to configuration error: Malformed Lambda proxy response. There is nothing worse than generic error messages that don’t tell you anything you need to fix the problem, right? And AWS isn’t particularly known for its error message design, if you can even call it that, let alone for giving you the means of fixing the problem.
As many users of Icinga don’t know what the DSL has to offer, I’m going to show you how to use custom variables and apply for rules to make your life easier when writing configuration for your Icinga environment. In this example we will use custom variables on a host to configure a dynamic set of services to monitor multiple web services behind a reverse proxy. On the host we define a custom dictionary called http_vhosts and assign our virtual hosts to it.
Logz.io has recently launched its Smart Tiering solution, which gives you the flexibility to place data on different tiers to optimize cost, performance and availability. Our mission has been to make Smart Tiering a multi-cloud and multi-region service. As part of this launch, we are glad to announce that the Historical Tier now supports Microsoft Azure Blob Storage, alongside AWS S3.
In this article I’m going to discuss table joins and the let statement in Log Analytics. Along with custom logs, these are concepts that really had me scratching my head for a long time, and it was a little bit tricky to put all the pieces together from documentation and other people’s blog posts. Hopefully this will help anyone else out there that still has unanswered questions on one of these topics.
In this article, I’m going to discuss custom logs in Log Analytics. Along with table joins and the let statement that I discuss in another blog, custom logs is a concept that I struggled to wrap my head around for a long time, as there don’t seem to be very many comprehensive guides out there as of yet. Here is a summary of everything I have managed to piece together from documentation and other people’s blog posts.
If productivity is the engine that helps optimize how a business operates then being proactive is the oil and knowing how to effectively maintain productivity is regularly checking and replacing said oil. Whenever a service outage occurs it throws a wrench into the whole process and can put an entire organization in flux, mainly because the outage.
A lot of very good writing from some reliable commentators has been suggesting that organizations have been forced into a digital-first environment. Covid has been the enforcer and business and public sector alike have adapted to having a distributed workforce by putting the infrastructure in where there were gaps. This is OK as far as it goes but it’s not quite right. The best organizations have not gone ‘digital-first’.
SAN FRANCISCO — January 14, 2021 — InfluxData, creator of the time series database InfluxDB, today announced significant growth in 2020 across its cloud business, open source user base, and major new customers. Demand for the time series platform continued to climb across industry sectors, especially for IoT and data streaming use cases.
Fun Fact: Most types of network and computer compromises could have been discovered much sooner if the organization had enabled proper event log monitoring using an appropriate server monitoring solution that alerted them to the issue. Without such a software application or not taking the time to configure it correctly, it takes much longer to uncover the compromise if it is ever discovered at all.
For this Tech Tip, we’re going to look at more ways you can integrate Catchpoint Alerts into your existing tool ecosystem (check out our recent video on integrating with Slack!). In this new, distributed workforce, employees are using more SaaS tools than ever. It’s important to identify how consolidating data can benefit key workflows – in this case, the ones for your IT support team.
IT structures across organizations are bound to get complicated one way or another. If you’ve been in business for at least a decade, chances are you’ve acquired a complex, layered system of technology that’s a hodge-podge of old and new. This complexity brings new challenges for infrastructure monitoring. It goes without saying that any enterprise needs effective IT infrastructure monitoring. But when technology is evolving at the pace it is, things can get difficult.
Even the systems that run smoothly day and night, can flounder when short of memory. Efficient memory usage has become of utmost importance for software applications. Nowadays, with growing audiences and faster speed and data retrieval expectations, memory issues pose a huge threat to performance and can lead to huge losses in terms of customers and money. Therefore, it is very important to build memory-efficient applications that ensure overall performance and a smooth customer experience.
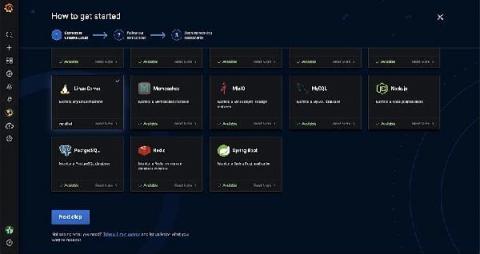
Grafana Cloud is the easiest way to get started observing metrics, logs, traces, and dashboards. When we say “easiest,” we mean it: Grafana Cloud is designed so that even novice observability users can use it. As a new user, you are not required to dive into the complexity of setting up Prometheus and figuring out how to create Grafana dashboards from scratch. Integrations are the reason why.
We have launched a brand new Experience Center that is able to demo you online a live Citrix CVAD environment being monitored by MetrixInsight for CVAD SCOM Management Pack. This way you can click around all by yourself to get a good impression of the Management Pack's capabilities. Request access here and browse through the Management Pack whenever you want during one month. Enjoy!
Networks always start off small and simple, but over time they can become increasingly complex. You start with a small network consisting of a simple Virtual Local Area Network (VLAN) with broad connectivity. However, once your security team get involved and add DMZs, routers, firewalls, etc you will find it hard to keep track of the intricate web you have created to support your business network.
Modules and mixins are, without doubt, great resources that make Ruby so attractive. They give the application the ability to share the code that can be used with ease in other places. It also helps us organize our code by grouping functionalities and concerns, which improves the readability and maintainability of our code. In this article, we will go through the concepts behind modules and mixins.
We have released a new upgrade to our script editor which is part of our ongoing commitment to build the best Synthetic User Journey monitoring tool on the market – Journey Pre-Actions. This upgrade is simple but will be useful for those websites that require certain prerequisites in order to allow tests such as these to be run. As with many of our features here at RapidSpike, this was born from a real-world requirement from a number of our customers.
With more and more businesses moving online, and homegrown entrepreneurs spinning up new online apps, they’re increasingly looking for an online development platform to help them easily build and deploy their sites.
A Configuration Management Database (CMDB) is critical in supporting services such as Incidents and Change & Asset Management. Most companies dream of having a beautifully populated CMDB, but struggle with how to make this a reality as the process can be quite daunting! But never fear there are loads of tools you can buy to do just this! Typically, there are three types of solutions designed to populate your CMDB, these are either agent-based, scanner, or integration style tools.
Elastic solutions solve many different business challenges from powering search bars to creating observable systems to detecting and responding to threats. And with the amount of capabilities each offers, learning how to maximize the power of our solutions for enterprise search, observability, and security is critical to realizing Elastic's full value. But finding the time to build new skills can be challenging.
How does one manage monitoring in the age of digital infrastructure as code? Also as code, of course! Combining HashiCorp Terraform Cloud and Checkly enables you to configure synthetic and API monitoring as part of your existing infrastructure codebase. It is flexible, programmable and will keep you out of maintenance hell, even at scale: it is monitoring for developers. Extending your existing Terraform Cloud configuration takes only two minutes. Let's take a look together.
So you’ve now finally finished putting all the pieces together – transitioned to Azure, deployed resources, deployed applications, got familiar with Azure Monitor and set up all the monitoring. You’re now collecting all the monitoring, application performance and security data for your Azure resources in Log Analytics workspaces, ready for analysis. (Head over to our Azure Monitor Learning Path if you're still figuring out how to do all that.) But is only the collection enough?
Oftentimes users of open source are told to go download it and figure it out… or pay for a managed solution in the cloud. So the typical choice is free and do-it-yourself or expensive and easy. With our new changes to Grafana Cloud, we are making it both free and easy to have a real, composable observability solution.
2020 is finally over and all of us are hopeful of a return to a sense of normalcy in 2021. At LogicMonitor, we came back re-energized from a healthy year-end break and are putting the finishing touches on our product roadmap for this year. This is a great opportunity to look back on what we accomplished in 2020 despite all of the challenges we faced.
In this article, we are going to see how we can integrate Google Cloud with Grafana. We will integrate Google Cloud SQL with Grafana and plot the metrics on Grafana. We will also look at how we can use Google Stackdriver as the data source in Grafana to expose the metrics of Google Cloud VM’s and platforms. To use Grafana immediately, we will be using Hosted Grafana by MetricFire.
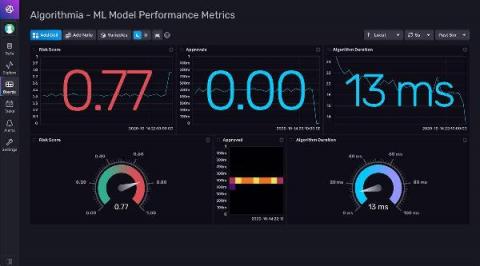
Measuring your machine learning model will help you understand how well your model is doing, how useful it is, and whether your model can perform better with more data. This is what Algorithmia Insights — a feature of Algorithmia Enterprise MLOps platform — does. Algorithmia platform accelerates your time to value for ML by delivering more models quickly and securely, as it is estimated that 85% of machine learning models never make it to production.
The events of 2020 — from the pandemic to the resulting mass quarantines — have been one of the most impactful societal events of this century. Nearly overnight, it has relegated hundreds of millions of workers to their homes, likely through much of 2021 and perhaps beyond.
Both Graphite and InfluxDB are time-series monitoring data platforms, both of which have high levels of adoption throughout many industries. Both of them are suitable for enterprise use, are scalable, and are stable. That being said, there are some benefits and drawbacks to each. While InfluxDB has many benefits, many developers still prefer Graphite due to its large community, stability, and reliability.
Incident management tools allow technology and security teams to resolve major incidents faster including urgent issues that may lead to businesses seeing application and site downtime affecting their users.
No matter your business, keeping customer data secure is critical toward keeping your customer’s trust. With the rise in data breaches (and subsequent security certifications), we don’t have to tell you why you should scrutinize every cloud service that you consider — including us. To that end, we believe in being explicit with our compliance. And that includes how we pursue independent certifications like ISO, HIPAA, and now, SOC 2 Type II.
In early October 2020, the Department of Defense released its long-anticipated and much needed Data Strategy. This strategy is the latest installment under the Department’s Digital Modernization Strategy, which was released in July 2019, and focused on the key strategic pillars of enterprise cloud adoption, artificial intelligence, command, control, communications, cybersecurity, and IT reform.
In 2020, the concept of observability in IT operations gained mindshare as IT leaders looked for new ways to rein in the complexity that’s grown organically with cloud computing and rapid digitization. Observability differs from IT monitoring in that it focuses on the development of the application and rich instrumentation so that operators can ask meaningful questions about how the software works or is working in production.
Syslog is a popular standard for centralizing and formatting log data generated by network devices. It provides a standardized way of generating and collecting log information, such as program errors, notices, warnings, status messages, and so on. Almost all Unix-like operating systems, such as those based on Linux or BSD kernels, use a Syslog daemon that is responsible for collecting log information and storing it.
In my ongoing Loki how-to series, I have already shared all the best tips for creating fast filter queries that can filter terabytes of data in seconds and how to escape special characters. In this blog post, we’ll cover how to use metric queries in Loki to aggregate log data over time.
Welcome to 2021, a year we are all entering full of hope. None of us knows quite what 2021 holds in store with regards to the global pandemic, but no doubt it will be another year of huge change. That will mean continued pressure on IT organizations across all industries to adapt and deliver new services to the business and users, all while keeping costs as low as possible. As we start a new year, many of you reading this will be considering your monitoring strategy in 2021 and beyond.
As with many things in 2020, this year’s AWS re:Invent was quite different from any previous iterations. For starters, instead of a week of live talks, face-to-face sessions, and a room full of booths, this year the event was fully online and stretched out for three weeks. As sponsors of this year’s event, we were excited to participate and continue to make an impact on the AWS community.
Did you know that you can easily upgrade to the next version with the Update Manager? Contact us to try Pandora FMS Enterprise and know all its advantages: https://bit.ly/2O9hoRf
IT leaders and decision makers certainly feel the impact of the pandemic, but for these past few months they haven’t been able to form any coherent narrative on what they are experiencing. Until now. Teaming up Pulse, an independent technology research firm, we recently surveyed 142 enterprise technology executives to understand how they have been handling their Digital Employee Experience (DEX) since the pandemic, what problems still persist, and where their focus is for 2021.
Fraud rates for Unemployment Insurance Benefits (UIB) and Pandemic Unemployment Assistance (PUA) are out of control. In May 2020, Brian Krebs of Krebsonsecurity published two articles detailing fraud that was occurring in several different state’s UIB portals. These states had been warned by the US Secret Service to be on the lookout for this. Reading the articles, the common theme is that many states are missing rudimentary controls for combating fraud.
In this article, we’ll be discussing everything you need to know about the basics of AWS Lambda error handling and some popular methods using StepFunctions and X-Ray. Regardless if you’re an AWS Lambda expert or if you’re a new Lambda user, there’s always something new to learn.
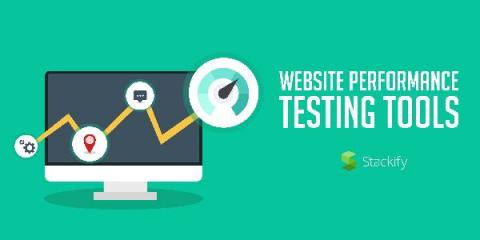
Implementing the best performance testing tools allows for an optimized end user experience and improved web performance. In order to execute accurate and effective performance testing, it is important for QA engineers to have access to the right set of tools. With the plethora of performance testing tools, it has become tedious to pick the right tool for your use case. Let’s explore our list of the best performance testing tools.
Platform thinking is a term that has spread throughout the business and technology ecosystem. But what is platform thinking, and how can a platform strategy force multiply the observability capabilities of your team? Platform thinking is an evolution from the traditional pipeline model. In this model, we have the provider/producer at one end and the consumer at the other, with value traveling in one direction.
A large amount of data requires special tools. Apache Cassandra is one of those databases that can handle a large amount of data spread among many commodity servers, providing high availability and fault tolerance without a single point of failure. Developed under the umbrella of Apache Software Foundation, it ensures full visibility into the code base and being free of charge.
Lumen is a stripped down version of the powerful and now very popular Laravel PHP framework, focused on performance and serving stateless requests. I doesn’t have all the bells and whistles of Laravel, but it also doesn’t need them when serving API requests. For example, sessions, cookies and views are not a part of Lumen. It’s not intended for serving websites so everything around that got ditched.
Of all the polls, round-ups, and end-of-year wrap-ups, none gives us as much trepidation as the 2021 projected line-up for MVP hacks. As provider lists grow longer, and monitored data grows broader, we decided to distill our list of culprits down to the most likely suspects you’ll need to monitor. Ready? Okay!
Python optimization is the solution to speed performance issues. But, when do you optimize, and what parts of the code should be optimized? This article will help you answer these questions. Developers always want to efficiently write neat code. However, things are quite different when working with a Python-based data science project. There will be situations where you need Python optimization. However, there are cases where optimization yields irrelevant results.
If you’ve been using SquaredUp for Azure, you’re familiar with its abilities to treat Azure native virtual machines . You can create a number of amazing and useful visualizations with them, such as displaying their health state, performance charts, costs, and so on. This is all excellent and super useful, but one question we frequently get asked is: how do I do these things with my on-prem servers that I’ve connected to Azure Monitor?
Hardware virtualization, also known as hardware assisted virtualization, is the creation of virtual versions of operating systems and computers. The technology was made by AMD and Intel for their server platforms. Its purpose was to improve the processor’s performance and meet virtualization challenges such as translating memory addresses and instructions. Many IT businesses have deployed servers that run only at a fraction of their total capacity.
You’ve probably heard about Prometheus, the leading open source project focused on metrics and alerting, and how it has changed the way the world does monitoring and observability. But if you’re brand-new to the technology, how can you dip your toes in and get started? I was in this position not long ago myself. I am a very hands-on type of learner, and usually when I want to explore new technologies, I start with “hello world” apps and small toy projects.
In our last blog, "What's New in Splunk Cloud: Part 1," we reviewed a host of new Splunk Cloud features that we have delivered through our accelerated releases since the beginning of 2020. A large part of this effort focused on empowering Splunk Cloud admins and making their experience as self-service as possible. In this blog, we will examine our latest effort to continue this empowerment: Splunk Cloud’s Admin Configuration Service (ACS).
This year, no sector has been spared from the business changes caused by the Covid-19 pandemic, which have almost always been painful ones: millions of dollars in losses for theaters, which still do not know where or when they will premiere their films, a dying tourism sector, the world of hospitality ruined, parents who fear taking their children to school, bankrupted real estate companies… and a lot of glances towards heaven waiting for an answer, from the Most High above or from the extraterre
Software developers are often only concerned about the functionality of their applications. When these applications are deployed in production, scalability and performance issues surface and application developers then have to worry about performance. Many a times, such situations warrant a complete restructuring of the application code, causing significant impact to new rollouts and current users.
Well, hello 2021: are you going to be good to me? In conversations with family, friends and coworkers, most are cautiously optimistic that with vaccines being rolled out things will start to return to some semblance of normalcy in a few months. Meanwhile, there is much work to be done. Enterprise IT managers and leaders always have big mandates and in 2020, those expectations exploded. Technology, after all, has been everyone’s lifeline during the pandemic.
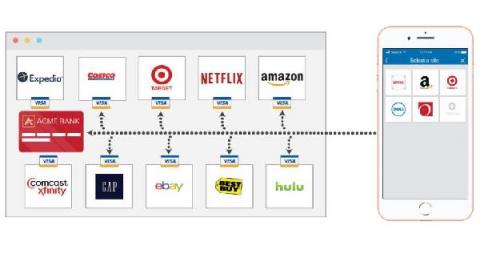
“We all get our credit cards replaced a lot. Our online ecosystem is getting more complex with the number of accounts we have. We wanted to simplify that, and make it less complicated to get those cards back on file,” says Katherine Chavez, Director of Marketing for Strivve (formerly Switch, Inc.). Strivve is a startup that aims to take the pain out of updating credit and debit cards by automating the updating process.
If you’re a veteran in this space, you probably understand the many incident response metrics and concepts, along with the many (at times exasperating) acronyms. For those new to the space, or even those with years of experience, the terminology is often overwhelming. If you’re one of those people who’s struggling to navigate through the world of DevOps metrics, we’ve created this article for you.
Elastic Cloud puts the power of the Elastic Stack in your hands within minutes. Whether you’re trying to add search capabilities with Elastic Enterprise Search, monitor critical systems and applications with Elastic Observability, or protect your organization from cyber threats with Elastic Security, taking the first step is easy.
Do you know what files your employees access to? Do you know when they create new files? How about when they copy, move, or delete files? How confident are you that your databases are safe and secure from potential intrusions? These are the types of questions any business owner should ask themselves, especially now. With more people working from home and telecommuting, you need to know exactly what databases and files your employees access, use, update, change, alter, move, and delete.
Under intense competitive pressure for customers and employees alike, most businesses today are pursuing aggressive digital transformation strategies. IDC predicted that nearly US $1.3 trillion was spent worldwide on digital transformation technologies – namely hardware, software, and services – in 2018, and tips that figure to nearly double in 2021 to reach more than US $2.1 trillion.
In this tutorial, we will discuss InfluxDB and its Python client. We will deploy InfluxDB inside a Kubernetes cluster and then use the InfluxDB Python client to send data to InfluxDB.
In its latest report, research firm Gartner tackles the trending subject of Observability. According to Gartner, "Observability is the evolution of monitoring into a process that offers insight into digital business applications, speeds innovation and enhances customer experience. I&O leaders should use observability to extend current monitoring capabilities, processes, and culture to deliver these benefits." This blog post gives you a sneak-peek of this new analyst report about observability.
Today’s blog post dives into the internals of Icinga 2 and will give you an overview how the config synchronization works internally. We will take a small cluster as an example and follow the configuration files through the synchronization mechanism. We assume some familiarity with distributed Icinga 2 setups as this post will not go into details on how to set up an Icinga 2 cluster.
BugSplat recently added Crash Grouping and Aggregation in Search. Grouping crashes provides new insight into your product's stability and allows you to prioritize fixes based on a wide variety of criteria. To try out this new feature, navigate to the Crashes page.
Among all the new features and services that AWS announced during the re:Invent 2020, my favorites were definitely the AWS Lambda updates. And there were many! For example, your code execution is no longer rounded up to the nearest 100ms of duration for billing — you are now billed on a per millisecond. On top of that, AWS increased the Lambda’s memory capacity to 10 GB, and correspondingly the CPU capacity up to 6 vCPUs.
Choosing whether to go with PostgreSQL or MySQL depends on your needs as they are both great databases to use under different circumstances. In this article we will run through a few of the top reasons and use cases to help you choose between these choices for database creation. Note: As a matter of fact, MySQL is so popular it became part of the LAMP stack (Linux, Apache, MySQL, PHP) used for building many web servers.
Even an insignificant network issue can wreck havoc on your IT infrastructure when left unmanaged. This makes it vital that your IT team is alerted instantly whenever an issue arises, so they can troubleshoot it quickly, and ensure network stability. However, IT teams aren’t sitting at their desks waiting for problems to happen. It’s not uncommon for IT staff to be away from their workstations addressing network issues such as a router failure or a faulty LAN cable.
The Tech Leaders' Tour is a series of events bringing tech leaders together to learn from each other about improving software quality and customer experience. This one was special because we are able to hold it in-person, in one of our favorite cities - Auckland, NZ, where there are no social distancing rules at the time of writing. In today's climate, technology companies are faced with many challenges. But one thing should remain the same - the focus on delivering value to the customer.
2020 has definitely been new, different, strange, unpredictable, and more. With new normal becoming a buzzword, adapting and surviving through these challenging times has been quite a task. We, at Site24x7, prioritized the safety of our employees, their families, and all our customers and business associates at the outbreak of the coronavirus (COVID-19). At the same time, customer queries and their feature requests were handled to manage the sudden surges in demand for existing and new features.
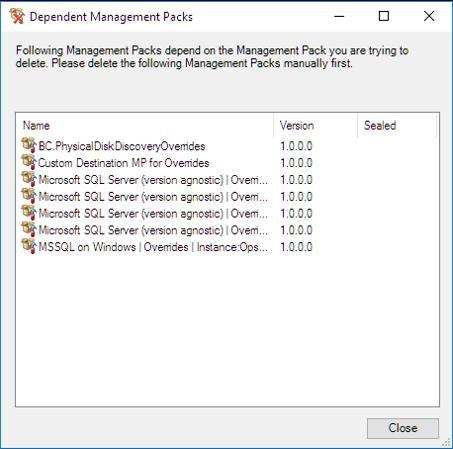
Picture this scenario - the final SQL 2008 server is decommissioned and all replacement SQL servers are monitored using the SQL version agnostic MP - finally! But, before cracking open the bubbly, you will want to pull out the MPs relating to SQL 2008 from SCOM. Easy…? Just delete them from the console… wrong!
Heroku was developed by James Lindenbaum, Adam Wiggins and Orion Henry to provide services, workflows and polyglot support to enhance developer productivity. Heroku is a container-based cloud Platform as a Service (PAAS). With Heroku, developers can deploy, manage and scale modern applications. Initially, Heroku supported only Ruby but later it added support for Java, Node.js, Python, PHP etc.
If you’ve ever started a new job, you know what a whirlwind those first few days and weeks can feel like. A new job means meeting new faces, learning new processes, familiarizing yourself with new and unfamiliar technology, and discovering what new challenges you’ll be facing for the foreseeable future. It can all be quite overwhelming — particularly at companies that don’t offer top-of-the-line employee onboarding programs.
Microservice architecture is a software design pattern in which we write applications by combining several small programs. These programs, which are called microservices, work together for a common goal. For some teams, it takes a lot less time and effort to write several small applications than a single large one.
The new year is all about fresh starts, and certainly all of us need that. Still, it's useful to look back and review the events of the previous year. Here are some highlights of OpsRamp's company and product news in 2020.
To help users troubleshoot intermittent network issues anywhere along their network, Obkio created Triggered Traceroutes. Triggered Traceroutes are a unique type of traceroute that is only triggered when a network event occurs.
With 2020 dominated by a global pandemic, organizations expedited their digital transformation strategies. (According to TechFirst podcast, COVID19 accelerated digital transformation by an average of 6 years.) One of the most significant changes was the rapid move to a remote workforce. This required stopgap measures to keep the business running. While these measures met the company’s immediate needs, the measures also introduced anticipated and unanticipated issues.
When you’re troubleshooting an app or a deployment, every second counts! Cloud Logging helps you troubleshoot by aggregating logs from across Google Cloud, on-premises or other clouds, indexing, aggregating logs into metrics, scanning for unique errors with Error Reporting and making logs available for search, all in less than a minute. And now, we’ve built two new features for streaming logs to give you even fresher insights from your logs data.
Smart State Technology (SST) is a company based in the Netherlands that develops advanced technological and future-proof solutions for smart grids. Their mission is to reinforce critical energy infrastructures by providing innovative energy solutions that connect industry and research, while ensuring society can fully benefit a sustainable energy future.
2020 is behind us. But we are still reeling under its effects. The disruption at work due to Covid left companies to rethink their IT strategy and focus on digital experience monitoring for their vast remote workforce. However, in these unprecedented times, Exoprise successfully managed to deliver the best monitoring outcomes to its global customers.
Since 2018, Watchdog has provided automatic, machine learning-based anomaly detection to notify you of performance issues in your applications. Earlier this year, Watchdog started grouping APM anomalies across your services, allowing you to better understand the scope of the issue.
Today we are excited to announce Graylog Illuminate v1.4. This release includes the addition of Office 365 content, which provides deeper visibility into Azure Active Directory and Exchange Online logs along with new alerts for a more granular level of notifications.
As business-critical applications increasingly rely on network services, even a minor change in network usage can impact network performance and reliability, thereby also impacting business functions and network maintenance costs. sFlow (short for “sampled flow”) — by providing unprecedented visibility into network usage and active routes of high-speed and complex networks — delivers the data needed to effectively control and manage network usage.
As an IT specialist, you should have an aptitude for all the essential tools vital for the efficient running of IT infrastructure. These software programs designed for their specific purposes basically serve the same purpose as an engineer’s toolkit. They make it easy to get the job done, and on top of that, get it done well. Depending on your job, you may or may not need to use all the tools. But as an IT professional, you should know which tool can help you with which task.
This article was originally published on InfoQ at December 3rd 2020. If you’ve migrated from a monolith to a microservices architecture you probably experienced it: Modern systems today are far more complex to monitor. Microservices combined with containerized deployment results in highly dynamic systems with many moving parts across multiple layers.
Increasingly, we are seeing on-prem workloads being moved onto the cloud. Elasticsearch has been around for many years with our users and customers typically managing it themselves on-prem. Elasticsearch Service on Elastic Cloud — our managed Elasticsearch service that runs on Amazon Web Services (AWS), Google Cloud, and Microsoft Azure across many different regions, is the best way to consume the Elastic Stack and our solutions for enterprise search, observability, and security.
In my ongoing Loki how-to series, I have already shared all the best tips for creating fast filter queries that can filter terabytes of data in seconds. In this installment, I’ll reveal how to correctly escape special characters within a string in Loki’s LogQL. When writing LogQL queries, you may have realized that in multiple places you have to write strings delimited by double quotes.
Here’s is a look back at the privacy-related changes and milestones of the Healthchecks.io website. If you also run a small SaaS, feel free to compare the notes. If you have suggestions or questions, please let me know!
In this week‘s Tip of the Day, we’re going to explore more of Catchpoint’s third-party integrations. Last week, we discussed how Catchpoint can be integrated with existing collaboration tools focusing on Slack. The demo walked through the process of setting up an integration with the communication platform, specifically how to feed Catchpoint alert data into a Slack channel.
It’s a new year and what better way to start working from home for the 10th month of the pandemic than with a Slack outage. For more than 3 hours on Monday 4th January, Slack users were left to fend for themselves with the use of none other than emails! to communicate with their teams – a notion that was surely lost by the 2010’s.
Hey, observability friends. I’m Shelby. I joined Honeycomb back in March. This year I’m carrying the torch of our annual tradition, looking back at the Year Bee-hind Us. Cue up the Auld Lang Syne. This wasn’t easy to write. Everyone at Honeycomb has been affected by the events of this year: the pandemic plus lockdown, school closures, complete life upheaval. We’ve witnessed or directly experienced racist injustice, social unrest, and state violence.
Happy New Year everyone! We are thrilled to be starting 2021 with some exciting news. Come February 2nd, we’ll be kicking off Azure Management Talk, a bite-sized webinar series with a focus on all things Azure management. Azure is fast-evolving, and often, it can get quite complicated. With so many things to learn and not enough time, the huge swathes of learning resources available online can quickly get overwhelming.
When it comes to monitoring your API, you need a tool that has the flexibility to handle the complexities of a modern website or app. Uptrends’ Multi-step API gives you the power to interact with API endpoints, evaluate the results, reuse response data, create automatic variables, track custom metrics, and now transform response data with user-defined functions.
Companies love data. Aggregating data from multiple sources makes decision-making easier and brings a new depth of the conversation to business meetings. But all of this is at the management level. IT managers and administrators also search for data from multiple sources to ensure that the ecosystem works. Companies demand the continued maintenance and availability of mission-critical applications. Without a framework or incident workflow, revenue can suffer, and customers churn if the company does not proactively address problems that arise in its infrastructure.
When a business application slows down, bad things happen. Your customer support gets slammed with service requests. Your boss calls an emergency meeting to talk to the product and developer teams. Everybody’s asking the same question: what happened? Diagnosing a slow application and finding the cause of the problem is something developers need to do quickly. Performance-related problems are in the top five SaaS user churn, which is a major preventable loss of revenue.
We're starting this new year strong with an additional new 8 locations to check your websites from! We've just finished adding uptime capacity in the following locations. That's 8 new locations to configure any website monitoring from! In all our previous locations, we've increased our server capacity to support our continued growth.
Hacks that make headlines are painful for everyone involved, but with some clever preparation and web monitoring at your side you can avoid the worst of this pain. Those who have been victimized face a steep uphill battle to reclaim trust and authority. Unwitting victims, like customers and end users, suffer downtime or leaks containing personally identifiable information. If your eye is not on security, your organization is inviting these kinds of attacks.
Motadata enabled a railway corporation, with headquarters in Navi Mumbai, Maharashtra, under the brackets of Ministry of Railways to monitor, analyze and resolve IT operational issues to establish a centralized modern infrastructure in their project. The project is one of the India’s most ambitious railway projects that runs through coastal western India, linking Mumbai to the western region of Goa and Mangalore. It covers about 170 railway stations under its remit.
In 2014, the Mazia (Matsch) research site in the Italian Alps was officially accepted as a Long Term Socio Ecological Research LT(S)ER site. The monitoring infrastructure is operated by Eurac Research and the University of Bolzano and consists of 24 automatic microclimatic stations in a mountain ecosystem across an elevation gradient ranging from 1,000 m to 2,700 m, logging several meteorological and biophysical variables every 15 minutes.
At the shadow of the widespread IP addresses, MAC addresses say even more about our devices than its more popular sister. As a kind of “identity document for network devices”, a MAC address informs us about “who is who” when connecting to a network. Of course, remember that the one called “MAC” has nothing to do with Macintosh computers. In fact, you can find it on devices of any brand.
We all know that debugging serverless is time-consuming and hard and that AWS Console doesn’t make it much easier. CloudWatch isn’t quite known for its ease of use. Why? Well to start with, it has suboptimal search features, logs scattered across multiple buckets and groups, little visualization capability, and no structure of Lambda function invocations.
Prometheus metrics are an essential part of your observability stack. Observability comes hand in hand with monitoring, and is covered extensively here in this Essential Observability Techniques article. A well-monitored application with flexible logging frameworks can pay enormous dividends over a long period of sustained growth, but Prometheus has a problem when it comes to scale.
One of the keys to CloudWatch’s success is its no bang, no buck billing system. The pricing structure has been designed from the outset to ensure that CloudWatch users only pay for what they actually use. In addition, the CloudWatch Free Tier allows first time users to test the waters without shelling out. The downside of this flexibility and adaptability is complexity.
Happy New Year! We want to kick off 2021 by announcing some improvements to DNS Check.
Simple Network Management Protocol (SNMP) is an Internet Standard protocol for collecting and organizing information about managed devices on IP networks and for modifying that information to change device behavior. SNMP exposes management data in the form of variables on the managed systems organized in a management information base (MIB), which describe the system status and configuration.