Broadcom Delivers Industry-leading Network Monitoring Scale to Meet the Demands of the Pandemic
Announcing the general availability of our latest release of DX NetOps network monitoring software.


Statsig is a modern experimentation platform that provides crucial insight into how new features are received by your users, so you can make informed product decisions and deploy with confidence. Statsig automatically runs A/B tests on features as they’re rolled out, and measures their impact on key business metrics, such as user growth and engagement.
Despite the ongoing pandemic, 2020 was still a record year for venture capital investments into American startups, which amounted to $156.2 billion, according to a recent PitchBook report. Being an astute entrepreneur, you’ve likely thought of everything to enable your startup business to hit the ground running — branding, product logos, hiring staff, equipment purchases, and structuring your business roadmap. You are ready to take the marketplace by storm — or so you think.
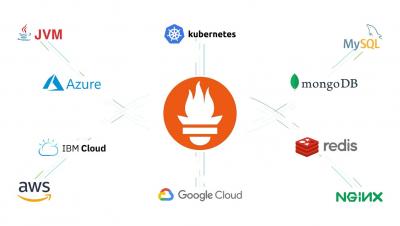
Welcome to another monthly update on what’s new from Sysdig! This month’s big announcement is our new support for Prometheus as a managed service. There are several individual features behind this which we cover in more detail below, but here is a summary: Also, Kubernetes 1.22 was released and we shared our review of what to look out for. Go check out our Kubernetes 1.22 – What’s new? post if you haven’t already.
Collaboration tools like Slack and Teams are here to stay. They’re very much inseparable from the distributed workforce that we all continue to find ourselves in. A robust set of integrations are then an essential part of today's monitoring and observability platforms. Feeding Catchpoint data into your support team via a Slack channel could be the difference between catching a disruption early or having to respond to a full-blown outage.
Application performance monitoring tools, or APMs, help give developers feedback so they can understand whether their programs are working the way they had planned for their users and clients. It also provides information about the software’s quality. Most DevOps teams use these tools throughout the software development life cycle. This way, they make sure that they cover their grounds before releasing software into the market.
With so many of us working from home full time for the last 16 months, VPNs have become essential tools for companies to keep their staff working in a safe environment. What we mean by “safe” is mainly about your online presence whilst performing daily tasks for your job.
Anyone tracking the evolution of the IT industry is probably familiar with the concept of Industry 4.0. Essentially, it describes the process by which traditional industrial tasks become both digitized and continually managed in an IT-like fashion via modern technologies like cloud computing, digital twins, Internet of Things (IoT) sensorization, and artificial intelligence/machine learning.
Using Node.js as a JavasScript runtime has its advantages. However, it requires significant maintenance to keep it working as expected. Here are the top metrics you should monitor for Node.js performance measurement analysis. Application programming interfaces or APIs that use the Node.js runtime environment are scalable. Node.js is asynchronous and event-driven, which means the application can handle multiple connections at the same time.
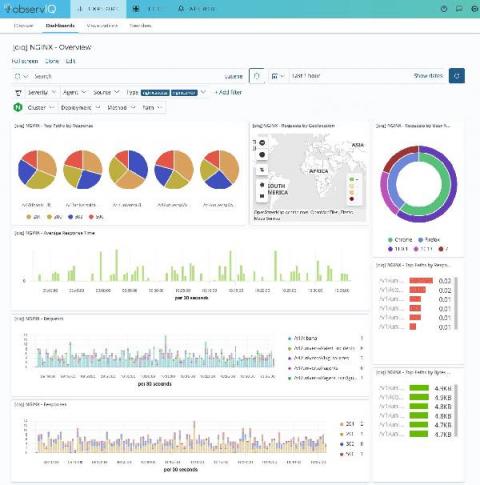
MEAN is evolving as a popular web stack for developing cloud native applications because of its scalability, ease of extension, and high reliability. Each component in MEAN is built on JavaScript, contributing to a cohesive development platform. In this post, we take you through the log management options that are available for each component of the MEAN stack framework and their respective limitations – limitations that are addressable with a refined log management solution like observIQ.
If all you have is the beginning and the end, you’re left with a short, boring story: “Once upon a time, it was UP…then, it was DOWN.” Knowing the twists and turns of your transaction pathways is not only illuminating, but profitable. Information channels dry up when all you have are pieces.
Businesses and successful social enterprises might need to move their website to a new host or server for various reasons. Perhaps you've expanded beyond what your current provider can offer or need a faster server or host. No matter the motivation, making website migrations more efficient is essential to keeping your business operations running. Although technological advancements have improved the delays that result from transferring sites, there can still be a lengthy delay.
Systems run into problems all the time. To keep things running smoothly, we need to have an error monitoring and logging system to help us discover and resolve whatever issue that may arise as soon as possible. The bigger the system the more challenging it becomes to monitor it and pinpoint the issue. And with serverless systems with 100s of services running concurrently, monitoring and troubleshooting are even more challenging tasks.
A service desk is the focal point of an IT organization to render services, and the quality of its services determines the perception of being a valuable part of the organization. The ongoing transition of businesses to adopt cloud infrastructure has forced IT organizations to modernize their service desks, which include vendors adopting cloud capability and smart automation powered by AI.
“How am I supposed to debug this?" Just imagine: Late Friday, you are about to shut down your laptop and … an issue comes up. Warnings, alerts, red colors. Everything that we, developers, hate the most. The architect decided to develop that system based on microservices. Hundreds of them! You, as a developer, think why? Why does the architect hate me so much? And then, the main question of the moment: How am I supposed to debug this?
Enrique Fueyo Ramírez is the Co-founder and CTO of Lang.ai. Here’s a post on how him and his team at Lang.ai instrumented performance monitoring for GraphQL resolvers.
DevOps is a common name in the technology household. Teams, small or big, are embracing this concept to deliver applications faster, improve software quality, and add efficiency in the development process from the very beginning. Shortening the feedback loop leads to a cost-effective way for businesses to find and fix defects earlier in the cycle process. Plus, it lowers the software failure rate in production and minimizes time wastage for the development team.
Over the years, we’ve heard many versions of the same familiar story: large businesses struggling with observability data living in several different systems. At Grafana Labs, our “big tent” philosophy is based on the belief that our users should determine their own observability strategy and choose their own tools. Grafana allows them to bring together and understand all their data, no matter where it lives.
If your organization is frustrated with how long it takes to roll out new applications and updates, they are not alone. Speed-to-market is an obsession at many companies today (see call-out box below), so anything that restricts or slows it down is a problem.
Many organizations are shifting vast portions of their applications and infrastructure to the cloud in pursuit of lower IT costs, greater business agility, improved security, and accelerated corporate growth.
First of all, don’t ask this! Instead of asking what to log, we should start by asking “what questions do we want to answer?” Then, we can determine which data needs to be logged in order to best answer these questions. Once a question comes up, we can answer it using only the data and knowledge that we have on hand. In emergent situations such as an unforeseen system failure, we cannot change the system to log new data to answer questions about the current state of the system.
The ASP.NET Core framework provides cross-platform support for web development, giving you greater control over how you build and deploy your.NET applications. With the ability to run.NET applications on more platforms, you need to ensure that you have visibility into application performance, regardless of where your applications are hosted. In previous posts, we looked at instrumenting and monitoring a.NET application deployed via Docker and AWS Fargate.
On this day in 1955, the first edition of the “Guinness Book of Records” was published in London.
Grafana Tempo 1.1 has been released, and like our major version suggests, there are no breaking changes. If you’d like, please check out the release notes . But if you find that release notes can sometimes be difficult to decode, fret not! All the highlights are below.
Providing an effective service – especially in a world with constantly evolving needs – goes beyond standard operating hours. Imagine if a bank only kept your investments secure while they were ‘open’ during their hours of standard operation? Issues can arise at any time and having effective service delivery monitoring and support for enterprise’s IT teams and managed service providers is critical.
It sounds like a wild claim, considering that billion dollar companies like Splunk, Datadog, New Relic, and Solarwinds are consistently making national headlines, for both good and bad reasons. Observability leaders are anything but invisible, so how can the perfect solution be different? Are they that far off?
HTTP/2 (originally named HTTP/2.0) was a major revision of the HTTP network protocol used by the World Wide Web published in 2015. Indeed, those in the Citrix/EUC ecosystem may remember Marius Sandbu investigating the benefits of HTTP/2 for NetScaler, Microsoft IIS, and Storefront users back in 2015/6. HTTP/2 was the first new version of HTTP since HTTP/1.1, which itself was standardized in RFC 2068 in 1997.
As I said before, Speed is King. Business requirements for applications and architecture change all the time, driven by changes in customer needs, competition, and innovation and this only seems to be accelerating. Application developers must not be the blocker to business. We need business changes at the speed of life, not at the speed of software development.
There is nothing worse than waking up to an angry customer complaining that your website is failing to accept their payment at checkout. This may be worrying for some since payments not being processed can be equivalent to losing money; however with Tag Spotlight, this should be a relatively quick problem to dissect. The key question here is whether this is an issue that all our customers are facing or an isolated event.
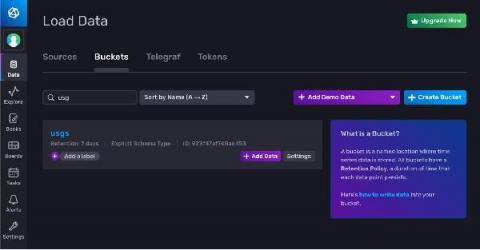
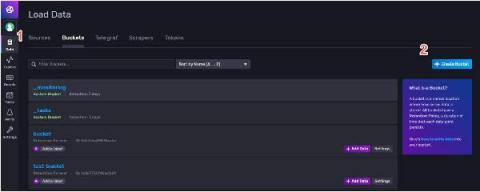
One of the best things about getting started with InfluxDB over traditional relational databases is the fact that you don’t need to pre-define your schema in order to write data. This means you can create a bucket and write data in seconds, which can be pretty powerful to developers who care way more about the application they’re building than the mechanics of storing the data.
Interlink Software’s capabilities have been gaining a good deal of industry analyst recognition in recent months. We’re pleased to announce yet more recognition; Interlink has been included on Constellation Research ShortList™ for“Using Artificial Intelligence in IT Operations (AIOps)”, Q3 2021.
Application performance management is one of the essential steps that every business must complete to ensure that their products work as desired and give the best experience to the end-users. There are many tools for application management available in the market, but if you want to select the best one for your business, you would need to try out each tool one by one.
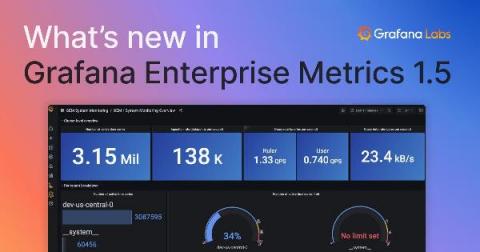
We’re thrilled to announce the release of Grafana Enterprise Metrics (GEM) 1.5. While this release packs in a ton of enhancements and bug fixes, we’d like to dive into two particularly exciting features: per-tenant usage metrics and a wildcard tenant for queries.
Conviva is a platform that helps businesses gain real-time insight into the overall performance and playback quality of their streaming video content. With video streaming workflows, slow start-up times and playback errors can hinder user experience and ultimately drive customers away. With Conviva, you can view key Quality of Experience (QoE) metrics, including video playback failures, rebuffering ratios, and other business-critical data to help monitor and enhance your viewer experience.
When your organization’s very ability to share, collaborate and meet depends on Microsoft Teams performing, solely watching Teams service availability simply isn’t enough. Employees operate on the assumption that every bit of technology they rely on just works. Teams is the modern example of the most critical application to businesses today, with over 145 million daily active users.
Following best practices when logging helps make sure they contain the right information when needed. Some common best practices for logging errors in.NET are listed below.
At the heart of RapidSpike is a development team who are passionate about pushing their abilities, learning new technologies and ultimately driving our software and product forward. We’ve researched and developed many cutting-edge features over the last 6 years but we’re shifting our focus this year. We’re taking a step back from new feature development in favour of upgrading, exploring and applying new technologies to existing functionality.
While we know the many benefits of going serverless – reduced costs via pay-per-use pricing models, less operational burden/overhead, instant scalability, increased automation – the challenges of going serverless are often not addressed as comprehensively. The understandable concerns over migrating can stop any architectural decisions and actions being made for fear of getting it wrong and not having the right resources.
Here is a quick round up of the newest product features, resources, and events!
All of us here at Catchpoint are passionate about continuously innovating and improving our product to make our customers’ lives better. Part of this process involves regular product releases is – and this latest one, Hercules, is no exception. A big focus area for this release has been improving the usability, quality, and performance of the Catchpoint portal and agent.
This post was written by James Hickey. Scroll below for full bio and picture following this article. Time series databases (TSDBs) can transform the way you handle streams of data in real time or IoT applications. In this tutorial, you’ll learn how to set one up in a C# application. Relational databases have their place. They’re great at things like data normalization, avoiding duplication, indexing over specific data points (like columns), and handling atomic changes to the schema.
At the moment I’m working at a tool for migrating Icinga 2 IDO history to Icinga DB . Sure, one could also run IDO and Icinga DB in parallel for one year and then switch to Icinga DB if they only care for the history of the past year. But the disadvantage is: one would have to wait one year. Nowadays (in our quickly changing world) that’s quite a long time.
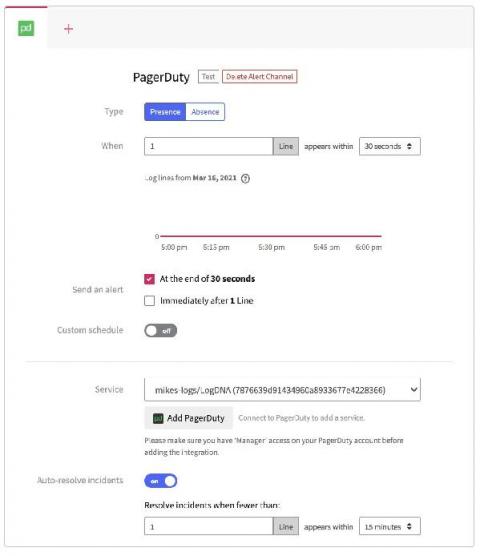
LogDNA integrates with your PagerDuty instance to help trigger incidents based on log data coming in from your ingestion sources. This allows your teams to quickly understand when there are issues with your application, and where in the logs you can investigate to understand root cause. To help further accelerate your team’s ability to understand the state of your applications, we are introducing the ability to automatically resolve those PagerDuty Incidents directly from LogDNA.
We are excited to announce that Elastic is joining forces with Cmd to accelerate our efforts in Cloud security - specifically in cloud workload runtime security. By integrating the capabilities of Cmd's expertise and product into Elastic Security, we will enable customers to detect, prevent, and respond to attacks on their cloud workloads.
A WS is a comprehensive platform with over 200+ types of cloud services available globally. As organizations adopt these services, monitoring their performance can seem overwhelming. The majority of AWS workloads behind the scenes are dependent on a core set of services: EC2 (the compute service), EBS (block storage), and ELB (load balancing).
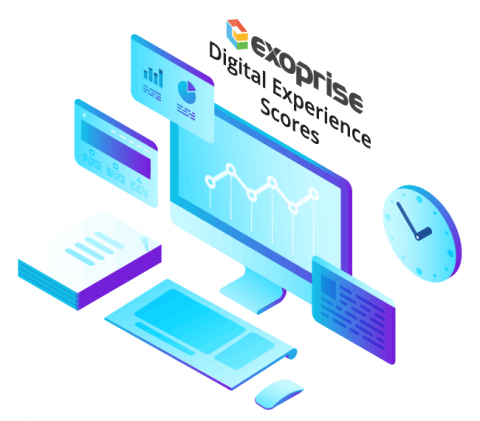
User experience is subjective. For example, asking tourists visiting New York City about their experiences gives different answers. Likewise, end-users who work remotely with different resources and disparate assets can have varied experiences with their business applications. How can IT teams gather this experience data and react faster to improve experience? The answer is Digital Experience Scores.
Observability is one of the biggest trends in technology today. The ability to know everything, understand your system, and analyze the performance of disparate components in tandem is something that has been embraced by enterprises and start-ups alike. What additional considerations need to be made when factoring in cyber resiliency? A weekly review of the headlines reveals a slew of news covering data breaches, insider threats, or ransomware.
Application Performance Monitoring is a crucial necessity for modern businesses. No application can survive without a proper monitoring system. There are way too many things that can go wrong, so you must put your best foot forward in terms of choosing a monitoring system that is effective and economical at the same time. This guide aims to help you decide between three top application performance monitoring tools in the market - AppDynamics, Splunk, and Scout.
A few weeks before I sat down to write this article, I reshared my two month review of OnlineOrNot around the internet. Surprisingly, the article was quite popular: So I thought I'd clear up some confusion for the folks who only just read my two month review: I started OnlineOrNot on February 25, 2021, shipped the first version for people to use on March 2, 2021, and here I am in August writing the six month review.
You have two choices when deploying eG Enterprise: Wherever you choose to locate your eG Manager, eG Enterprise does not and will never collect data from your systems. There is never a data feed going from eG Manager to any outside system unless specifically configured by the customer and we do not incorporate any dubious call-home technologies. Before installing eG Enterprise, you will also need to consider the factors discussed in the Where to locate the eG Manager?
This morning, we announced that Grafana Labs has raised $220 million in Series C funding . As with our previous rounds in 2019 and 2020 , this funding will enable us to focus on accelerating the development of our open source observability platform and supporting the success of our community and our customers.
High performance automobiles are built to be driven on the open road, at high speeds, hugging each curve and accelerating on the straightaways—they’re not for trips to the grocery store.
In early 1900, Sakashi Toyoda invented a loom that automatically stops when the thread breaks, limiting the need for someone to watch the machine constantly. This approach was later named “Jidoka” and became one of the two pillars of the TPS (Toyota Production System) with just-in-time production representing the second pillar.
We recently announced the new Splunk App for Content Packs, your single source for all the goodness that is content packs. This new app makes it easier than ever to get started with Splunk for IT use cases. Individual content packs come with prepackaged content and out-of-the-box searches and dashboards, helping streamline workflows and ensuring you get the most out of your usage with Splunk IT Service Intelligence (ITSI) and Splunk IT Essentials Work (ITE Work).
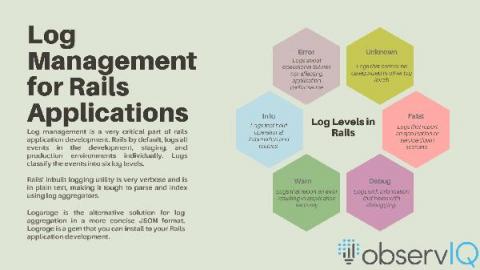
Logging is useful in building, managing and debugging Rails applications. Most logging functionalities are built into the application, and it is fairly simple to find the logs. However, as your applications scale up in volume, it becomes difficult to trace the source of an issue. That’s when you want to implement a cloud based log management system to get a unified view of all logs from your Rails application.
Logs are an essential part of an effective monitoring strategy, as they provide granular information about activity that occurs anywhere in your system. In serverless environments, however, you have no access to the infrastructure that supports your applications, so you must rely entirely on logs from individual AWS services when troubleshooting performance issues.
Slow apps frustrate users, which leads to bad reviews, or customers that swipe left to competition. Unfortunately, seeing and solving performance issues can be a struggle and time-consuming. Most developers use profilers within IDEs like Android Studio or Xcode to hunt for bottlenecks and automated performance tests to catch performance regressions in their code during development. However, testing an application before it ships is not enough.
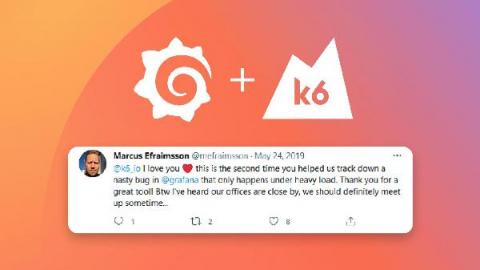
On the last day of GrafanaCONline in June, our CEO Raj Dutt announced that Grafana Labs had acquired k6 , the company behind the open source load-testing tool. In fact, our relationship with k6 had started more than two years earlier. At the beginning of 2019, we were working on replacing Grafana’s “remember me” cookie solution with a short-lived token solution for the Grafana 6.0 release.
HR people have a saying: right person, right place, right time, meaning that the right resources can make all the difference when it counts. The same goes for Incident management and response, where very often the wrong person, place, or time can contribute to mounting catastrophe. As systems grow, the right person really can make the difference during an outage simply due to command or knowledge of the system.
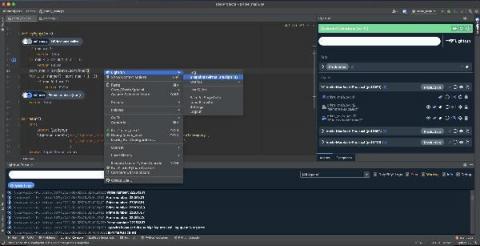
As developers, we spend a lot of time in our IDEs writing new code, refactoring code, adding tests, fixing bugs and more. And in recent years, IDEs have become powerful tools, helping us developers with anything from interacting with HTTP requests to generally boosting our productivity. So you have to ask — what if we could also prevent security issues in our code before we ship it?
We’ve seen time and again how serverless architecture can benefit your application; graceful scaling, cost efficiency, and a fast production time are just some of the things you think of when talking about serverless. But what about serverless security? What do I need to do to ensure my application is not prone to attacks? One of the many companies that do serverless security, Protego, came up with an analogy I really like.
Register for the webinar and download the full study to see and apply Forrester’s financial model to determine the observability ROI for your organization. Many teams want to adopt observability and Honeycomb—but run into budget roadblocks because budget holders may not clearly understand the quantifiable benefits to their end users, their teams, and the bottom line.
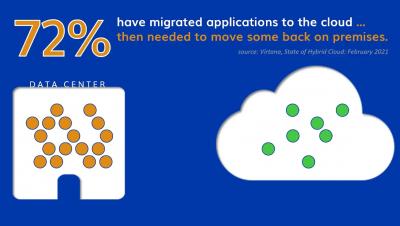
Migrating workloads to the cloud can be tricky. In fact, a study Virtana conducted earlier this year found that 72% of respondents had to move applications back on-premises after migrating them to the public cloud because they ran into a variety of problems. Clearly, organizations need to address these showstoppers.
As a Nexthink V6 Customer, you’re already realizing the power and value of a proactive, Digital Employee Experience (DEX) management solution: more productive employees, reduction in employee issues, and a smoother, more accelerated time-to-resolution for employee-reported IT issues.
A fundamental element of the Kubernetes microservices system is the services model, which gives teams greater understanding of how their applications are deployed. These objects running within pods and containers, by extension, are RESTful since they’re based on APIs. However, DevOps teams can’t hope to run a tight ship without managing their services. Communication and visibility are absolutely crucial in a Kubernetes system.
In the first post of this series, we covered the general idea and benefits of model-driven observability with Juju, but did not dive deep into the idea of contextualization and how it makes observability more actionable. In this post we start addressing what contextualization means in model-driven observability, starting from adding Juju topology metadata added to telemetry, and how that improves the processing and querying the telemetry for charmed applications.
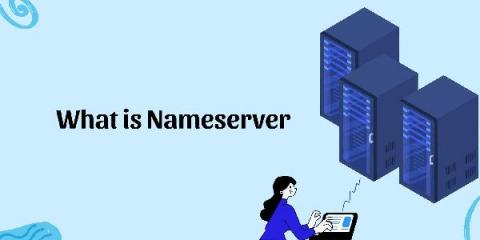
You may have come across the word "nameserver" if you maintain your own website. You may, however, have no true idea of what one is or how it works. Knowing a little about the “nameserver” concept can help you manage your website. Simply said, nameservers help browsers in establishing links between URLs and websites. They're essential since we'd have to memorize IP addresses to visit websites if we didn't have them.
Inevitably, in the lifetime of a service or application, developers, DevOps, and SREs will need to investigate the cause of latency. Usually you will start by determining whether it is the application or the underlying infrastructure causing the latency. You have to look for signals that indicate the performance of those resources when the issue occured.
Over the last 15-plus years, the Payment Card Industry Data Security Standard – a.k.a. PCI DSS – has endured as the bellwether of IT security standards. For today’s e-commerce vendors and cloud centric retailers, maintaining alignment with “PCI” remains as relevant as ever, especially given the continued proliferation of threats and diversity of cloud and hybrid environments.
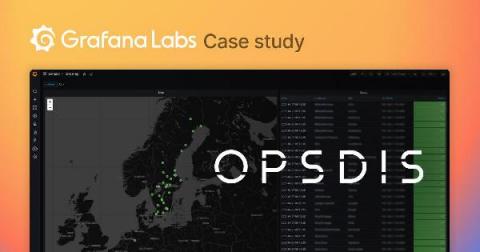
Companies are always looking for transparency and visibility when it comes to monitoring, but as monitoring requirements and methods evolve, it’s not always easy to keep up. That’s why Opsdis, an observability consulting company based in Göteborg, Sweden, was founded. The firm focuses solely on helping clients implement systems for monitoring and metrics so they can keep up with the ever-expanding world of cloud computing and containerized environments.
We launched the Stanza log agent just over one year ago. Stanza is the result of an uncompromising stance on performance, processing, and configurability for log telemetry. It took mere days for friends and colleagues in the space to raise the obvious objection – there are already so many logging agents, so why spend time on a *new* one? We also heard from competitors who had a snarkier take…
Developers must have access to the information that they need. Accessing this information, however, can be time-consuming. With the wrong tools or workflow, it’s frustrating and challenging to filter logs by source. Tags are an easy solution from LogDNA that helps developers get a more granular view of what’s going on in our services.
Developers of any skill set find it frustrating when we don’t have access to the information we need. We want easy and complete access to application logs so that we can troubleshoot application problems. Quickly resolving issues requires a complete picture of what’s going on. Using the wrong tools limits our ability to determine what’s wrong, slowing the repair process.
You’ve seen the movie. You know the scene. There’s a diabolical criminal on the loose, a city in fear—and one obsessed investigator in dogged pursuit of justice. Her eyes are bloodshot from too many sleepless nights, too much caffeine, and too many cigarettes. She paces frantically in a windowless room. On the wall is a corkboard festooned with maps, notes, and pictures, and a web of red string is woven haphazardly across a clutter of seemingly unrelated clues.
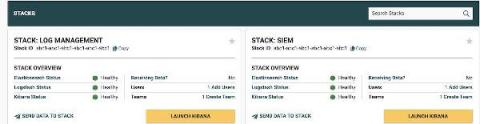
We are pleased to announce our newly launched dashboard design which we have created to assist cross team collaboration for users that prefer to use multiple Stacks per account. We understand that Cybersecurity specialists, Sysadmins, Product owners, developers and CTOs may all have different requirements for using our platform for logs and metrics analysis.
Engineering time is a precious resource. We often have to balance many tasks and often conflicting priorities. In this article, we’ll look at ten activities for which allocating more time can be beneficial. Let’s learn from the mistakes of others.
Generating and collecting logs is one thing. Generating and collecting actionable logs can be quite another. That's a problem because logs that are not actionable – meaning they can be easily used to derive valuable insights or resolve issues – are not very valuable. If you don't generate actionable logs, you might as well not log at all. Fortunately, ensuring that you generate useful logs is not tricky. Keep reading for seven tips on making your logs actionable and valuable.
Almost all tasks within a Linux system, whether it’s an application, system daemon, or certain types of user activity, are executed by one or more processes . This means that monitoring processes is key to detecting potentially malicious activity in your systems, such as the creation of unexpected web shells or other utilities.
Modern software development teams use CI/CD tools to ship features quickly and rely on best practices like shift-left testing to find application errors before they become user-facing bugs. But you still face the risk that any code you deploy could contain errors that your testing did not surface. To help you deploy with confidence and mitigate the effects of a bad deployment, Datadog APM now provides Automatic Faulty Deployment Detection.
Handling large images has always been a pain in my side since I started writing code. Lately, it has started to have a huge impact on page speed and SEO ranking. If your website has poorly optimized images it won’t score well on Google Lighthouse. If it doesn’t score well, it won’t be on the first page of Google. That sucks.
See how the Logit.io platform helped give Youredi a more streamlined reporting and data visualisation alternative to using Microsoft’s Power BI in our latest customer case study. Outside of its BI capabilities, the Logit.io platform is used throughout Youredi by everyone from their technical teams through to their customer support and professional services department.
Digital transformations can entail significant shifts in technology, such as migrating from on-site architecture to cloud services, and these complex transformations generate massive amounts of data. Data transparency is a must-have, and observability with AIOps delivers the solution. Through a unified view of data, AIOps guides DevOps and SRE teams through the swamp of information
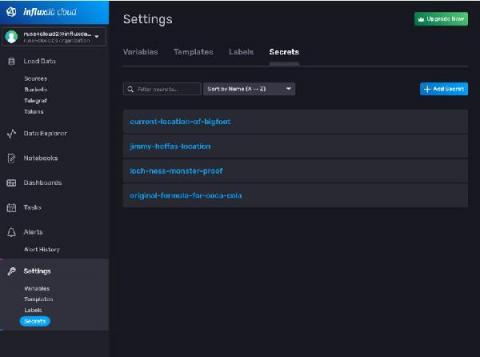
Directly embedding passwords and API keys into the code you write is a bad practice. Of course, everyone knows this, but I’ll be the first to admit that it still happens now and then. In the world of source control and shared codebases, leaking a password can be a huge problem that costs your team time and money. Of course, today many companies leverage a secrets management system to lower the probability of something like this happening.
Businesses are flooded with constantly changing thresholds brought on by seasonality, special promotions and changes in consumer habits. Manual monitoring with static thresholds can’t account for events that do not occur in a regularly timed pattern. That’s why historical context of influencing events is critical in preventing false positives, wasted resources and disappointed customers.
This article originally appeared in VentureBeat. “I feel like my job performance is based on a rigged lottery.” That’s what the Director of End User Computing at a large European bank told me two weeks ago. Every quarter, her company runs an NPS-style survey asking employees about their IT Experience. If you work in a corporate setting, you’ve probably seen these questionnaires before.
Many organizations are moving from monolithic to microservices-based architectures. Microservices allow them to improve their agility and provide features more quickly. Although developing a single microservice is simpler, the complexity of the overall system is much greater. Here, we’ll review how to add distributed tracing to C++ with the OpenTelemetry collector and send to Logz.io. One of the biggest challenges is finding efficient tools to quickly debug and solve production problems.
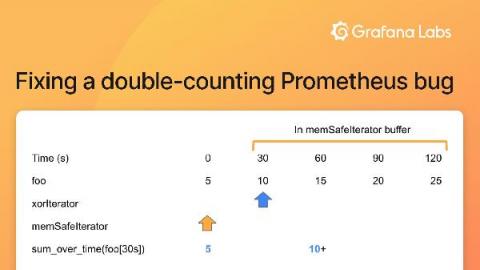
In my role as a software engineer at Grafana Labs, I recently worked on a project that involved generating PromQL queries. One of the ways we verified the correctness of the generated queries was with a suite of integration tests. These tests would execute the generated PromQL queries against a local instance of the Prometheus query engine with some test data, and verify the results were as expected.
The global COVID-19 pandemic caused a massive and immediate shift to remote work which was bolstered by video conferencing telecommunication software such as Microsoft Teams. Although the world is still trying to heal (while simultaneously navigating new and evolving challenges) some organizations have started the process of having their employees return to work and explore new hybrid workforce environments.
Securing your environment requires being able to quickly detect abnormal activity that could represent a threat. But today’s modern cloud infrastructure is large, complex, and can generate vast volumes of logs. This makes it difficult to determine what activity is normal and harder to identify anomalous behavior. Now, in addition to threshold and new term –based Threat Detection Rules , Datadog Security Monitoring provides the ability to create anomaly.
In case you haven’t noticed, video marketing is on fire right now with compelling statistics around this trend hard to ignore. And for good reason — everyone from large enterprises and educational institutions to community groups and entrepreneurs are incorporating richer content into their websites, such as images and videos. Hence, the importance of choosing a high-quality content delivery network (CDN) provider.
Function as a service (FaaS) offerings like AWS Lambda are a blessing for software development. They remove many of the issues that come with the setup and maintenance of backend infrastructure. With much of the upfront work taken out of the process, they also lower the barrier to start a new service and encourage modularization and encapsulation of software systems. Testing distributed systems and serverless cloud infrastructures.
Creating a new Host within the Icinga 2 configuration files is fairly easy. Basically you only have add an object of the type “Host” to a config file and reload Icinga 2. Doing the same with Icinga Director is even easier, you don’t even have to bother with terminal editors and configuration files. However, what sounds so easy for an experienced user may not be so obvious for beginners.
Technology has paved the way for businesses to reach out to more customers and clients. One of the most effective ways to reach more people is through the Internet, by creating a great website. Nowadays, businesses with websites have a name and face in the online world. However, as technology advances, so do security risks. If hackers get into a website, they can steal sensitive data – say, customer information (i.e., payment methods, addresses, etc.).
Just how smart is your storage management? Storage is one of the most promising ways to shift from the "more is better" philosophy to the "work smarter" philosophy. What do I mean by that? Historically, IT managers who needed more storage responded in the most obvious way: they bought more. Then they deployed it, integrated it, and waited until the problem recurred.
Last week at Grafana Labs, we launched our new Grafana Meetup Program with our East Coast Virtual Meetup. It was a ton of fun bringing together the community for this first event in our meetup series, but the road to getting here has been quite a journey! As a community-driven company, going more than a year without any in-person events has been pretty rough on all of us Grafanistas.
Have you been a frustrated customer at the end of the service line waiting to achieve a resolution for your problem? After all the waiting, you'll hear a voice giving you a standard response: your request will be addressed and resolved soon. An incident need not be a harrowing experience, but can be turned into a positive customer experience using customizable and publicly accessible status pages for timely incident communication.
Your path to creating an elevated version of your current Microsoft 365 services is one that you already know is needed to create predictability for you and for your customers- predictability yields profitability. The reality is that Microsoft is more focused today on the commodity customer than your specific business needs as an MSP. This is one of the reasons most MSPs tend to take the backup/DR/cybersecurity angle.
Applicare 9 is a release focused on ease of use – SingleAgent, easy agent deployment and remote administration. Applicare 9 SingleAgent includes infrastructure monitoring, web servers monitoring, java app servers monitoring, databases monitoring and logs monitoring.
When you are experiencing an issue with your application or service, having deep visibility into both the infrastructure and the software powering your apps and services is critical. Most monitoring services provide insights at the Virtual Machine (VM) level, but few go further. To get a full picture of the state of your application or service, you need to know what processes are running on your infrastructure.
We are excited to announce support for Google Compute Engine (GCE) N2 general purpose virtual machine (VM) types, and additional hardware configuration options powered by N2 custom machine types. N2 VMs leverage Intel 2nd Generation Xeon Scalable processors and provide a balance of compute, memory, and storage. N2 machine types also offer more than a 20% improvement in price-performance over the first-generation N1 machines.
The Biden administration signed an executive order recently to regulate security practices among federal agencies and establishments. The decision modernizes and improves government networks in pursuit of fool-proof federal cyber defense. This comes in the wake of a series of malicious cyberattacks that targeted both public and private entities in the past year. In the largest breach in US history, SolarWinds
We are excited to announce that Logit.io has recently taken home three awards from Appvizer’s selection ranking the best log management and data analytics tools on their platform. In addition to this, we’ve also been named as one of their certified partners for 2021.
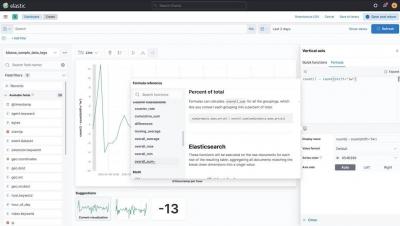
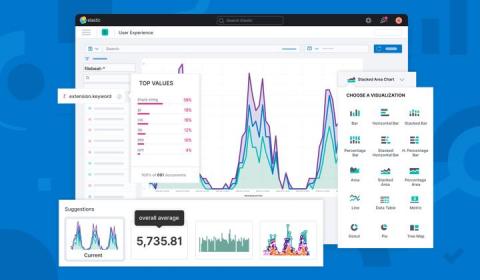
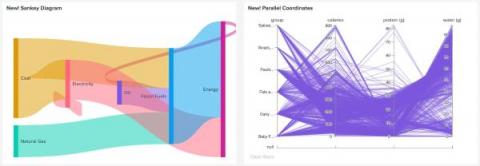
Kibana creates easy ways to do powerful things with all of your data — to ask and answer questions and follow the flow of analysis. Many times the answer to your question requires calculations based on queried data. Formulas allow you to author your own metrics by combining multiple aggregated fields using math operations. In addition, moving through and replaying your data in time and space are powerful ways to gain historical context and understand additional insight about the present.
When you’re running databases at scale, finding performance bottlenecks can often feel like looking for a needle in a haystack. In any troubleshooting scenario, you need to know the exact state of your database at the onset of an issue, as well as its behavior leading up to it.
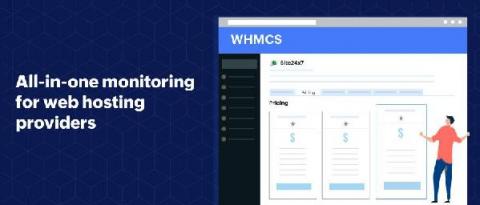
Web Host Manager Complete Solution(WHMCS) is a leading tool for web hosting management. Site24x7 has partnered with WHMCS to extend its monitoring capabilities to WHMCS users directly via the WHMCS console.
Efficient root cause analysis is vital to incident management. How quickly an issue can be understood determines the mean time to resolve (MTTR), which directly impacts the digital experience. When there is a sudden outage or a performance degradation, root cause analysis can become laborious given the complexity of all the components involved and the potentially huge amount of observability data generated from different sources.
An application running in production is a difficult beast to tame. Most experienced developers–ones who spent enough late nights or Saturday mornings trying to break apart a nasty production bug–will try and create the clearest possible picture for their later selves while writing their code, so that they could understand what’s actually going on in the system during an incident.
An application running in production is a difficult beast to tame. Most experienced developers–ones who spent enough late nights or Saturday mornings trying to break apart a nasty production bug–will try and create the clearest possible picture for their later selves while writing their code, so that they could understand what’s actually going on in the system during an incident.
If the last year has taught those of us at ScienceLogic anything, it is that we underestimated how much our customers and partners relied on us. It’s understandable, really, since no one could have anticipated the pandemic-driven chaos, and how it would push IT to its limits—and beyond.
OpenTelemetry (or “OTel”) helps you get your instrumentation started quickly, and it helps you get the most out of that telemetry data by providing flexible exporting options. As a result, it’s emerging as the new standard for instrumentation. To that end, today we’re sharing more insight into the work we’ve done (and are doing) to enable a path for all Honeycomb users toward OTel adoption. We hope you’ll be as excited as we are to embrace these open standards!
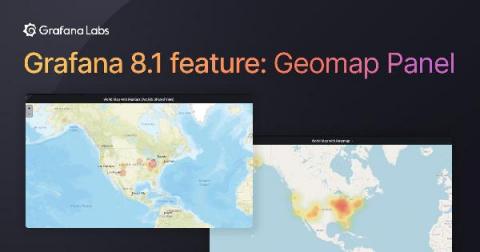
The Worldmap panel in Grafana is an existing feature in OSS that has been widely used, but it has some limits that weren’t easily fixed. Now with the release of Grafana v8.1 , we have introduced an upgrade to the Worldmap panel with the new Geomap panel visualization that allows you to view and customize a world map using geospatial data, all while sharing the same infrastructure with our core UI.
Have you ever found yourself late at night combing through a myriad of logs attempting to determine why your cluster went down? Yes, that’s a really stressful job, especially when you think about how much money your company loses as a result of these incidents. Gartner estimates that the revenue lost due to outages is around $5,600/minute, which amounts to more than $330K/hour.
Have you ever wanted to check the status of your Splunk Cloud Platform deployment but can't easily access your laptop? We've got you covered— the Cloud Monitoring Console is now available on Spunk Mobile.
In the last century we had very primitive computers and now, at the dawn of a new millennium are we the users who have become primitive!? Want to learn more? Let’s get to know User Experience Monitoring My first computer, in 1987, was a laptop with a monochrome LCD screen and 16 kilobytes of program memory. They were 15,584 precious bytes and they were read and executed very quickly.
Software development has always played a vital role in the development of a business. But software development is not only the coding of a part of the software; it also extends to debugging, testing, releasing frequently, and monitoring. Application performance monitoring is one of the most essential things that every software needs to do because a running software application can always go wrong in ways unimaginable.
TThe Management Pack provides clear and precise performance indicators and timely alerts enriched by pinpointing problem identification and troubleshooting information. It streamlines the workflow and helps for better planning based on detailed reports. The integration into System Center enables a single pane of glass view into your Oracle environment, secured by Microsoft technologies.
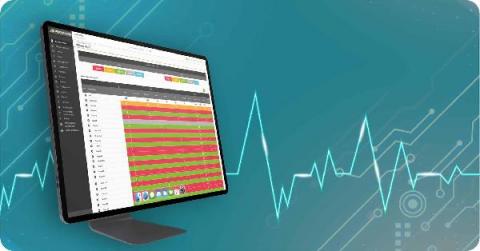
Networks today are moving towards increased agility and dynamic capabilities to support advanced networking requirements and business-critical processes. This causes the IT infrastructure to span across wireless, virtual, and hybrid environments as well. But with networks evolving quickly, IT admins have a hard time managing them without the right solutions in place.
So you’re interested in time series databases, and you decided to explore InfluxDB Cloud or InfluxDB v2. Perhaps you just created a free account or downloaded the binary, and now you’re playing around with the InfluxDB User Interface (UI) and learning Flux. The hardest thing for beginners to understand are the return results from a Flux query or Annotated CSV.
Here’s a direct quote from an IT Manager I spoke with recently: “We’ve been using virtual desktop infrastructure (VDI) for a large percentage of employees for a few years now, but between you and me, it’s been a mess.
Canary deployment is a risk mitigation strategy for software releases. it allows applications developers to limit the damage caused by the release of faulty software updates and roll back such faulty updates quickly and safely without compromising the entire software assets.
A typical IoT application with any physical system or process in the field can have hundreds of on-site sensors generating copious amounts of data every second and possibly communicating in several different protocols.
Current IT monitoring software lacks the necessary metrics for minimizing downtime for systems and applications. Most provide system and application metrics but there is much more than this required for properly monitoring your infrastructure. With eBPF there is a technological advancement that allows monitoring software to provide rich information from the Linux kernel and present it.
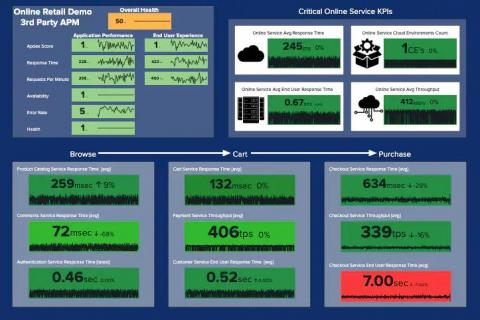
Today you likely have one or more legacy APM (Application Performance Monitoring) solutions. You are moving from a monolithic architecture to microservices, and you are accelerating your journey to Cloud, and you need to deliver at speed with scale and quality to your customers. Sadly, visibility into these results are limited to each of these solutions and their interfaces.
The Splunk Dataflow template is an indispensable tool that allows Google Cloud customers to easily engineer a horizontally scalable and fault-tolerant logging export pipeline into Splunk® Enterprise and Splunk Cloud Platform™.
You’re likely familiar with local debugging—the ability to go through your code line by line to find and eliminate bugs. However, with the ever-increasing complexity of development environments, working efficiently with remote systems is becoming more necessary. In this case, “remote” can mean any machine you don’t have native OS-level access to, such as Virtual Machines, Docker containers, and entirely separate devices accessed over the network.
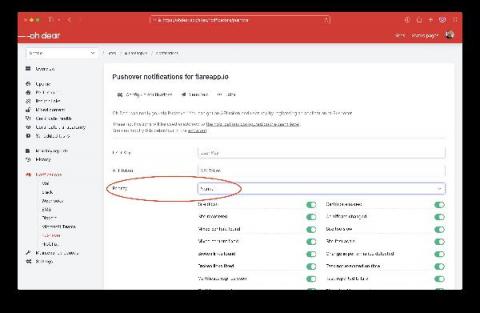
When we detect something wrong with your site (it is down, a broken link is detected, the certificate is invalid, ...), we can notify you via one of the many notification channels we support. One of those channels is Pushover, an excellent service to send native notifications to mobile devices. We have supported Pushover since we launched a couple of years ago. Now, we've added a nice option that several of our users we're asking for: setting the priority.
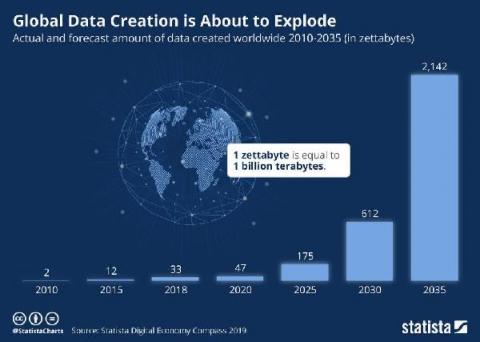
“Observability,” is the process in DataOps of recording data generated by digital systems as they go about their processes. There are some great companies in the observability space, generating a whopping $17 billion annually, and contributing a significant portion to the modest 2.5 quintillion bytes of data created every year.
When the Citrix architecture moved from v6 to v7, one of the main components that was introduced in the v7 architecture was the Citrix Delivery Controller (CDC). A Citrix Delivery Controller is a server-side component that is responsible for managing user access and brokering (enabling application and desktop access) and optimizing connections. Each site will have one or more delivery controllers.
Keeping the experience of your end user in mind is important when developing applications. Observability tools help your team measure important performance indicators that are important to your users, like uptime. It’s generally a good practice to measure your service internally via metrics and logs which can give you indications of uptime, but an external signal is very useful as well, wherever feasible.
On this day in 1889, William Gray patented the first coin operated telephone with the first model installed at the Hartford Bank in Connecticut.
The past year has been significant for continued development of both DevOps practices and new developments across the open source community. To that end, Logz.io is moving forward with renewed support for the Fluentd log shipper. This new proxy will serve as an alternative to Filebeat and Logstash, which recently moved away from open source licensing. Additionally, this integration utilizes an HTTP proxy instead of the SOCKS5 proxy necessary for Filebeat.
The Four Golden Signals of monitoring and observability get a lot of things right. But they could be even better.
Troubleshooting production issues with virtual machines (VMs) can be complex and often requires correlating multiple data points and signals across infrastructure and application metrics, as well as raw logs. When your end users are experiencing latency, downtime, or errors, switching between different tools and UIs to perform a root cause analysis can slow your developers down.
Node.js projects in Honeybadger can now officially take advantage of source maps, just like Client-Side JavaScript projects can.
If you are a candidate looking for your next role that involves an in-depth knowledge of Elasticsearch and the wider Elastic Stack then you will want to revise beforehand. In this resource guide on the top ELK interview questions, we've listed all of the leading questions that candidates are commonly asked about Elasticsearch, Logstash & Kibana (and their contemporary tools and plugins) alongside the answers. Want to improve your knowledge further?
Honeycomb is known for its incredibly fast performance: you can sift through billions of rows, comparing high-cardinality data across thousands of fields, and get fast answers to your queries. And none of that is possible without our purpose-built distributed column store. This post is an introduction to what a distributed column store is, how it functions, and why a distributed column store is a fundamental requirement for achieving observability.
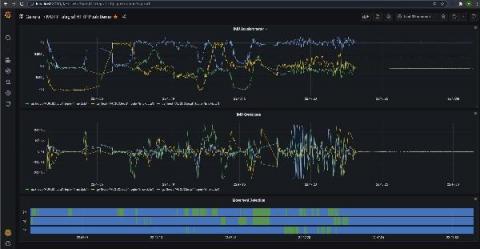
Within the world of robotics and automation one of the most recurring needs is that of capturing and visualizing real-time data from hardware components such as sensors and actuators, which provide insights into how a system is behaving overall and helps diagnose any potential issues that might arise overtime.
Welcome to Part 1 of our multipart series on Distributed Tracing for Full Stack Developers. In this series, we’ll be learning the ins-and-outs of distributed tracing and how it can assist you in monitoring the increasingly complex requirements of full stack applications.
Kubernetes is the de-facto platform for orchestrating containerized workloads and microservices, which are the building blocks of cloud-native applications. Kubernetes workloads are highly dynamic, ephemeral, and are deployed on a distributed and agile infrastructure. Although the benefits of cloud-native applications managed by Kubernetes are plenty, Kubernetes presents a new set of observability challenges in cloud-native applications. Let’s consider some observability challenges.
I’m Tim, a Product Design Manager at LogDNA and a massive coffee and magic enthusiast. My team is responsible for creating a beautiful and easy-to-navigate user interface so that you can easily access, and gain value from, your logs. We’ve been working on making our product more accessible and are about to roll out some subtle changes.
With Elastic 7.14, the filestream input, the successor of log input, is now generally available in Filebeat. This new, superior input provides better support for reading active log files, with faster reaction time when there is backpressure in the system, quicker registry updates, better cooperation with external log rotation tools, and more.
The content delivery network (CDN) has been an integral part of application infrastructure for more than two decades. A CDN is critical to the end-user experience, but it is no longer considered to be just a caching server. It has evolved to provide security from cyber threats, including DDOS attacks along with front end optimization. Although CDN services are now an indispensable part of any application infrastructure, visibility into CDN performance remains limited.
Here’s everything you need to know to get started with Dashbird – the complete solution for End-to-End Infrastructure observability , Real-time Error Tracking, and Well-Architected Insights. When working with AWS, One cannot emphasize enough the architectural best practices for designing workloads. One of those best practices is to design the solution in such a way that the monitoring of infrastructure and troubleshooting of errors and problems is achieved effortlessly.
Every now and then, issues occur that disrupt the very fabric of global software engineering. Chief amongst them is the recent mass outage of Github. Github is a fundamental building block in software productivity, hosting over 190 million code repositories. Github hosts our code and libraries, runs build pipelines, and much more. It is a central hub of activity and it is consumed by tens of thousands of organizations.
At Seniorlink, we provide services and technology to support families caring for their loved ones at home. In the past two years we’ve expanded our programs across the United States, and so our need to observe our application systems has grown too.
Last year we cooked a holiday ham using Sysdig. Honestly, just revisiting that makes me hungry, but it got me thinking. What about dessert? Today, I’d like to discuss baking a pie and eating it with Prometheus Remote Write. But not just any pie: a Raspberry Pi. Specifically, I’d like to introduce you to Pi-hole, an open-source project that has become very popular in the community. In this article you’ll learn how easy is Monitoring Pi-hole with Prometheus Remote Write.
Monitoring services and applications in just a few clicks – that’s the dream of every SRE and developer, but this is very difficult because most applications don’t expose metrics in a standardized format. This article will introduce the current pros and cons of the Prometheus exporters ecosystem and how we leveraged the power of the open-source exporters in Sysdig to radically simplify the user experience to allow you to monitor your applications in just a few clicks.
We are excited to announce that Prometheus Remote Write functionality is now generally available in Sysdig Monitor. This feature allows Prometheus users to easily push metrics directly from their Prometheus servers to Sysdig’s Managed Prometheus Service. Sysdig Monitor provides not only a scalable long term storage solution for custom metrics but also radically simplifies Prometheus monitoring.
In modern software systems, it is common for several developers to work on the same project simultaneously. Siloed working with infrequent merging of code in a shared repository often leads to bugs and conflicts that are difficult and time-consuming to resolve. To solve this problem, we can adopt continuous integration.
Most everyone has some source of information on the health of their environments. Your experts know where to go and what to do when you get those cryptic messages and log files. To those content with the deep knowledge and where events and log files supply you with everything you need, I applaud you – you belong to a rare breed. Combing through logs or events takes time and effort, and rarely does it yield the speediest “return-to-service” solution.
Like many in 2020, executives at this large oil and gas services company made the decision to have most employees work from home and to restrict all nonessential business travel in order to keep their employees safe. The company rose to this challenge at the very outset of the pandemic. A virtual private network (VPN) is the most common and secure way to provide access to company resources and data when employees are traveling or working remotely.
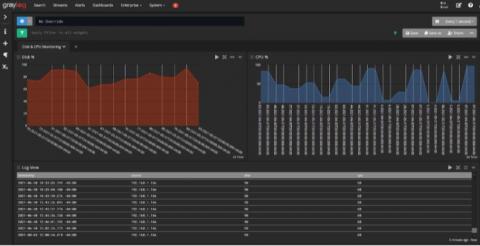
Many IT professionals think of Graylog primarily as a security (SIEM) solution, and of course it can be used in that way to great effect. However, Graylog’s industry-leading log aggregation, search, visualization, and classification capabilities go far beyond that role alone.
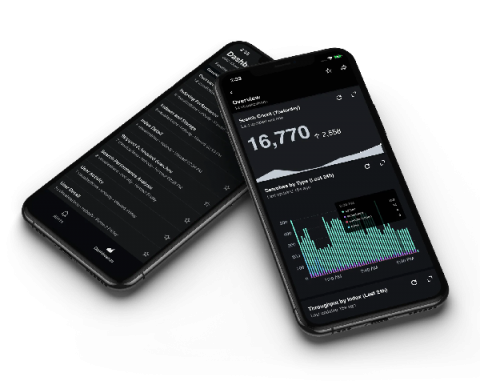
Want to access your Splunk data on the go? We’re making it easier than ever to unlock value from your data anywhere at any time. Regardless of your role or level of technical expertise, you can use Splunk Mobile to view dashboards and take action from your mobile device.
Komodor is a Kubernetes-native platform we’ve created to streamline troubleshooting. It was born out of frustrations we felt as developers, when we were required to waste hours of our time on troubleshooting, instead of focusing on what we really wanted to do - creating and innovating. Komodor sits on top of your K8s cluster and integrates with every existing tool you have, be it CI/CD, repo, monitoring, alerting, or communication.
When you’re troubleshooting an application on Google Kubernetes Engine (GKE), the more context that you have on the issue, the faster you can resolve it. For example, did the pod exceed it’s memory allocation? Was there a permissions error reserving the storage volume? Did a rogue regex in the app pin the CPU? All of these questions require developers and operators to build a lot of troubleshooting context.
The Citrix Ready team recently recorded a podcast with eG Innovations for their Tech Fusion podcast series. Hosted by Neil C. Hughes from The Tech Blog Writer, Rachel Berry from eG Innovations’ product team, and CTP, Richard Faulkner, (Enterprise Solutions Architect, Conversant Group) discussed how eG Enterprise enhances and goes beyond native Citrix tools.
The power of community makes Grafana one of the most composable platforms for monitoring and observability across a wide variety of use cases. The Grafana Plugin Directory features not just plugins created by our team here at Grafana Labs, but by Grafana community members all over the world. It’s the best place to browse for new data source integrations, panels, and applications you can install on your dashboard to extend Grafana’s functionality.
Archiving is in and your logs are here to stay! We develop features that streamline the log management processes for our users. Logs are information assets, and we understand that you need to retrieve, re-asses and draw insights from your historic logs. observIQ offers a simple integration with Amazon Web Services (AWS) for extended retention. It takes less than 30 seconds to set up and archive logs directly to an S3 bucket in your AWS account.
After adding new features in June we worked on fixing some minor bugs and improving the stability of our service. We’re happy to announce that besides those fixes, we were also able to introduce a major update to our heartbeat (background job) monitoring. It was requested by many, so let’s take a look at the details!
NiCE and Teqwave join forces to enable next-level Citrix monitoring on Microsoft SCOM. Both companies have a long-standing relationship in delivering SCOM-based monitoring services to large-scale enterprises. Our companies are partnering to help Citrix solution owners and administrators providing even better services and end-user experience. The Citrix Management Pack by Teqwave is a proven solution enabling discovery, monitoring, advanced analytics, and reporting on essential Citrix components.
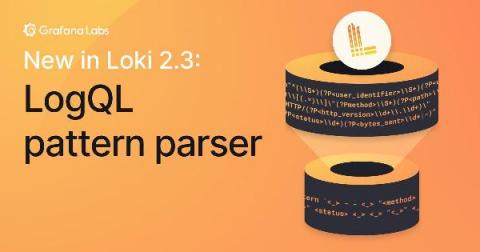
Writing LogQL queries to access Loki’s log data just got easier, thanks to the new pattern parser released with Loki 2.3. It makes writing queries for unstructured log formats simple. And the pattern parser can be an order of magnitude faster than the regular expression parser. Let’s take a closer look.
Logs are an essential part of troubleshooting applications and services. However, ensuring your developers, DevOps, ITOps, and SRE teams have access to the logs they need, while accounting for operational tasks such as scaling up, access control, updates, and keeping your data compliant, can be challenging. To help you offload these operational tasks associated with running your own logging stack, we offer Cloud Logging.
Leading an IT team often involves a careful balancing act between two priorities. On one hand, IT leaders must have an eye for innovation in order to keep up with rapidly changing environments. Meanwhile, there’s the constant pressure to reduce technological costs and ensure that IT is driving real value for the business. Within a nonprofit organization, managing these two priorities becomes an even more delicate process.
Adding annotations to your data is a great way to share context with other members of your team. In May, we added the ability to annotate individual points in your data. Today, we have added the ability to add ranged annotations to your dashboard graphs. We’ve also reworked some of the interactions with annotations based on user feedback so that they can be added quickly and easily. To learn more about working with annotations, check out our documentation.
If you’ve been following recent tech news, you’ll know that Windows 11 is one of the hottest topics right now. Most of the conversation has been focused on users of the Home version, as Microsoft tries to get the average consumer excited with hot new features and a fresh look. But what about enterprise users who won’t have a choice in whether they upgrade or not? How are they going to feel about Windows 11?
A typical SAP deployment is usually a sprawling, complex system and is one of the most critical applications an enterprise relies on to keep the business functioning, with it interacting with production, sales, dispatch, HR, and other areas of the business. Monitoring the performance and availability of SAP is therefore the key. Proactive monitoring may allow minor issues to be resolved before they become major issues.
Telegraf is one of the coolest open source agents for collecting metrics. It’s part of the TICK Stack (Telegraf, Influx, Chronograf and Kapacitor) and with Telegraf you can collect metrics from a wide array of inputs and write them into a wide array of outputs. It is plugin-driven for both collection and output of data so it is easily extendable.
Today, we’re launching a major upgrade that will improve the way yourteam manages application errors, with more error states, error assignments,severity labels and a “my incidents” overview. Your team’s communication around incidents will improve significantly.You’ll know exactly how severe an error is, who’s responsible, and howyou handled this error historically.
Hi! 👋 Colin, the creator of StatusGator, here with big news. TL;DR We just rolled out a massive update (with 7+ new features) and redesigned the entire website. One thing we often heard from people seeing StatusGator for the first time is that it had a rather outdated look. Landing on our website, many people got the impression StatusGator was created 10 years ago and forgotten about.
Serverless event-driven architectures are composed of AWS Lambda functions that regularly interact with databases, APIs, message queues, and other resources to facilitate complex workflows and functionalities. It is therefore crucial to monitor every component of your stack to ensure your applications perform optimally at scale. But traditionally, telemetry data for AWS resources has lived in silos, making it difficult to quickly get the context you need to debug issues.
The Java Persistence API (JPA) is used in most Java applications to interact with a relational database. One of its most popular implementations is the Hibernate ORM, because it uses object-relational mapping to abstract database interactions and makes implementing simple CRUD operations very simple. But this abstraction also has its downsides. Hibernate uses a lot of internal optimizations and hides all database interactions behind its API.
18 months later, organizations around the globe are slowly but surely starting to welcome their employees back to the office – or at least thinking about it. But this is not a “back to normal” kind of thing. Most will recognize that something’s different this time around. Firstly, there is no clear one-size-fits-all return-to-office strategy.
The OpsRamp Monitor is back, capturing the latest buzz around what’s trending in the world of ITOps and related technology. It’s been a busy month!
Is GitOps changing observability as we know it? GitOps has been the buzz word in the DevOps space for several years. GitOps, to those that are not familiar, is an operational methodology for DevOps that leverages a continuous deployment approach with Git as the single source of ‘truth’ for declarative control over both infrastructure and applications.
During the execution of a PHP application, it is possible for it to generate a wide range of warnings and errors. For developers seeking to troubleshoot a misbehaving application, being able to observe these errors is critical. Developers, on the other hand, frequently encounter difficulties when attempting to display errors from their PHP applications. Instead, their applications simply stop working.
Excellent new features have arrived in Loki v2.3.0. Bug fixes too. And performance increases on top of that. While we have been quiet, we have been very busy!
Containers are lightweight, portable, easily scalable, and enable you to run multiple workloads on the same host efficiently, particularly when using an orchestration platform like Kubernetes or Amazon ECS. But containers also introduce monitoring challenges. Containerized environments may comprise vast webs of distributed endpoints and dependencies that rely on complex network communication.
In Part 1 of this series, we looked at EFS metrics from several different categories—storage, latency, I/O, throughput, and client connections. In this post, we’ll show you how you can collect those metrics—as well as EFS logs—using built-in and external tools.
In Part 1 of this series, we looked at the key EFS metrics you should monitor, and in Part 2 we showed you how you can use tools from AWS and Linux to collect and alert on EFS metrics and logs. Monitoring EFS in isolation, however, can lead to visibility gaps as you try to understand the full context of your application’s health and performance.
Amazon Elastic File System (EFS) provides shared, persistent, and elastic storage in the AWS cloud. Like Amazon S3, EFS is a highly available managed service that scales with your storage needs, and it also enables you to mount a file system to an EC2 instance, similar to Amazon Elastic Block Store (EBS).
In the ScienceLogic webinar, “Clearing the Path for Automated Operations,” we look at how one global technology organization got their IT house in order through the application of AIOps and a strategic approach to implementation, based on ScienceLogic’s AIOps Maturity. ITOps teams are overloaded with manual, repetitive work that creates management bottlenecks and takes time away from new projects.
SquaredUp helps customers create dashboards that connect the dots. They do this by assisting users in visualizing and sharing data. And, for the most part, they do this by displaying in dashboards what is happening now. Of course, some visualizations show some historical values or whatnots, but tiles like the WebAPI tile only display a specific value at one particular moment in time. But have you ever wanted to “see” what your application looked like right before an outage?
As a startup, we always want to focus on the most important thing — to deliver value to our customers. For that reason, we are a huge fan of the serverless options provided by AWS (Lambda) and GCP (Cloud Function) as these allow us to maintain and quickly deploy bite-size business logic to production, without having to worry too much about maintaining the underlying servers and computing resources.
GitHub Actions are a powerful way to add automation to any source code repository. When you take that power and connect it with InfluxDB, you get an amazing combination that allows you to automate data generation, manage GitOps workflows, and a whole lot more. This post will highlight some of the interesting ways to use InfluxDB and GitHub Actions.
Everywhere you look, you see something to do with software and applications. But for all this software to work well, the people behind them have to know how they work. For a software developer, this comes as no surprise. They need to know how their code is working when deployed. Before the software deploys, they want to iron out errors, so they don’t become problematic and frustrate customers.
After building Lightrun for the JVM – an easier way to get a better grasp on production applications written in Java, Scala, and Kotlin – we’re pleased to announce the release of Lightrun’s developer-native observability platform for Python!
We are excited to announce the release of Grafana 8.1. This release builds upon our promise of a composable, open observability platform with new visualizations and dynamic panel configuration options while extending the functionality we launched in Grafana 8.0. Get 8.1 You can get started with Grafana in minutes with Grafana Cloud. We have free and paid Grafana Cloud plans to suit every use case — sign up for free now. And now, on to the highlights for 8.1.
Your feedback is what makes Honeycomb better. We ship changes often (you can see updates in real time on our changelog), so it can be easy to miss some of the new improvements that can help you get the most out of Honeycomb. Whether it’s a big new product feature or an enhancement of existing features, you may not always be up on the latest goodness waiting for you in Honeycomb.
When you migrate workloads from on-premise infrastructure into a public cloud, you can improve the performance, reliability, and security of your application, and you might also lower your costs.
Once upon a time there was the internet, and it was good, and it was global. We built our businesses across its networks and expanded our commerce from computer to cloud. Like with any physical trade route, the journeys are not always consistent. If your website is your flagship, your reports are your map. Sites rely on servers and it’s possible that your site might be UP in the UK but DOWN in Dallas.
Visualizing trends in your logs is critical when troubleshooting an issue with your application. Using the histogram in Logs Explorer, you can quickly visualize log volumes over time to help spot anomalies, detect when errors started and see a breakdown of log volumes. But static visualizations are not as helpful as having more options for customization during your investigations.
We recently heard that a customer, a power user of Prometheus, was grappling with 18,000 individual rules for its metrics, because its setup involved creating an individual rule group for each generated metric. Surely there was a better, more efficient way to handle this scale of metrics? In fact, we did come up with a solution, and this blog post will walk you through how you might benefit from it too.
Buying software is often the answer for busy engineering teams in search of a quick solution with minimum aftercare. But while your team may be sure of the problem, how do you go about searching for a product to fix it? Far from being the 'easy option', there is a lot you need to consider before you invest in a bought solution – user experience, cost comparisons, and support features to name a few. Let’s explore some of the considerations when making a good decision.
Observability is a hot term in the industry, but don’t let it fool you: having visibility into your organization's apps and services only gives you partial clarity into a system’s overall performance. To get a full understanding of your monitoring data, you need to apply contextual intelligence.
Elastic received honors from two key partners, Microsoft and Google — a recognition of our efforts to ensure that customers can easily find and use Elastic products in the environments that best suit their needs. Elastic was named the 2021 Microsoft US Partner Award Winner in Business Excellence in the Commercial Marketplace. In addition, for the second year in a row, Elastic was selected by Google Cloud as the 2020 Technology Partner of the Year for Data Management.
Many organizations immediately pivoted to a largely remote workforce in March of 2020. For many IT teams, across all industries, this meant a huge rushed effort to make sure employees had the technology to work from home effectively. Fortunately, many companies, specifically in the insurance industry, already had remote workers and have weathered this transition well.
This blogpost is a followup to the blogpost Icinga Web permissions and restrictions (how do they work, examples). These two additions provide flexibility to manage web access control..
A database is a collection of organized information for easy access and management. Computer databases generally consist of aggregated data or files that contain information about customers, transactions, or inventories. Regular monitoring of the database’s performance is necessary to ensure that it is running properly and to detect issues as they arise. Here is a short database monitoring guide that can assist you in choosing the right tools.
Logging helps developers in reducing errors and cyber-attacks. The application is designed to be dynamic. We can't always predict how an application will react to data changes, errors, or program changes. Logging in allows us to better understand our own programs. For all applications, an absolute logging solution is essential. A good logging system increases the application's stability and makes it easier to maintain on the production server.
As we all know, the pandemic changed everything, from the way we shopped to the way we received healthcare. It introduced a whole new way to interact with healthcare professionals for yearly check-ups, consultations, and more. The pandemic also put the network in the spotlight as a critical method to deliver reliable applications experiences. All, if not most medical professionals used the telehealth application as one of the only ways to provide quality patient care.
The word "forecast" typically brings to mind weather predictions that have evolved through sources like snippets on television, newspaper columns, or the very popular, "Alexa, what's today's weather?" However, a financial forecast is something very different.
The artificial neuron was first hypothesized in the 1930s, but only in the last decade have we seen the widespread application of artificial neural networks and machine learning to everyday technologies. Broadly speaking, machine learning describes a technical discipline defined by computer algorithms that improve automatically through experience and the use of data. These days, the combination of machine learning and "big data" power an increasing number of digital tools that we interact with daily.
As IT landscape is changing from in-house systems and servers to cloud ones, server monitoring has become an essential task. Without server monitoring, it’s not possible to detect issues in memory, operating systems, storage drives or applications. Server monitoring is vital to know what went wrong and what was the cause behind the problem.
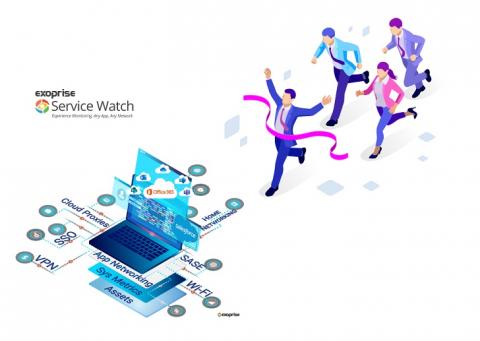
Digital Experience Monitoring (DEM) solutions like those from Exoprise monitor SaaS and custom web applications behind the firewall or cloud to deliver optimal performance to end-users. In a survey done by Forrester, 51% of technology teams and individuals are now objectively managed on providing the right technology to improve and manage the end-user experience. While the onset of COVID may have led companies to restructure a year ago, the same companies are now presented with new challenges to support a hybrid workforce and retain the best employees.
Bilt Graphic Paper Private Limited (BGPPL), a subsidiary of Bilt Paper B.V., is a paper manufacturing company based in India, with manufacturing plants in Bhigwan, Ballarpur, and Ashti in the state of Maharashtra. BGPPL established the most modern technology in the writing and printing segment in India intending to meet every demand of the rapidly progressing printing industry.
The ASP.NET Core framework enables you to build and deploy .NET applications on a wide variety of platforms, each of which has different observability concerns. In a previous post, we looked at monitoring a containerized ASP.NET Core application. In this guide, we’ll show how Datadog provides visibility into ASP.NET Core applications running on AWS Fargate. We’ll walk through.
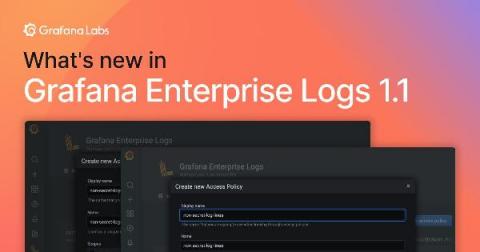
Back in February, we introduced Grafana Enterprise Logs (GEL) into the Grafana Enterprise Stack. GEL is a new way for large organizations to ingest and query their full log volume, without the cost or operational complexity associated with other solutions. (View a demo here.) We just released GEL 1.1, and one of its key features is label-based access control (LBAC).
At Rollbar, we know security matters. Our customers represent the leading technology companies in the world today, and keeping their data secure is our top priority. Look no further than our investment in security and compliance. Rollbar is fully compliant with stringent industry standards like GDPR and HIPAA. We have also received ISO27001, SOC 2 Type 1, and Type 2 compliance certifications to ensure that even the most security-conscious companies can use our SaaS platform.
No matter what you’re using Kubernetes for, visibility into your applications’ performance and activity is a beneficial and often essential undertaking – essential, but colossal, requiring entire teams dedicated to nothing but maintaining deployments, auditing, debugging, and keeping up with compliance. Kubernetes has robust support documentation dedicated exclusively to assisting customers with Monitoring, Logging, and Debugging.
Do you also find yourself confused by all the Open-this and Open-that names flying around? There are currently a good few Open projects, standards, tools – OpenTelemetry, OpenTracing, OpenCensus, OpenSearch… heck, even my podcast is called OpenObservability! And new Open names seem to be popping up every other day. If you too feel this way, there’s no need. Many feel similarly confused.
Elastic made their latest minor Elasticsearch release on May 25, 2021. Elasticsearch Version 7.13 contains the rollout of several features that were only in preview in earlier versions. There are also enhancements to existing features, critical bug fixes, and some breaking changes of note. Three more patches have been released on the minor version, and more are expected before releasing the next minor version.
Once a year we let our imagination go wild for a whole week during our annual Hackweek event. It’s where we come up with product updates, like dark mode support, design them and implement prototypes. The mobile engineering team came up with the idea for a Sentry mobile app that focuses on Release Health. We wanted to give developers a concise but comprehensive view of if a release was healthy, errored, or experiencing abnormal crash sessions across multiple projects.
We are pleased to announce the general availability (GA) of Elastic 7.14, including our Elastic Enterprise Search, Observability, and Security solutions, which are built into the Elastic Stack — Elasticsearch and Kibana. Elastic 7.14 empowers organizations with the first free and open Limitless XDR, which delivers unified SIEM and endpoint security capabilities in one platform.
Elastic Security's newest features define the potential of XDR for cybersecurity teams. Our single platform brings together SIEM and endpoint security, allowing users to ingest and retain large volumes of data from diverse sources, store and search data for longer, and augment threat hunting with detections and machine learning. Security vendors are using the term “XDR” with increasing frequency, applying varied definitions to suit their respective technologies.
For many CSPs, increasingly complex networks and immature technological solutions result in a typically long time to the detection and resolution of incidents that impact the customer experience, the brand’s reputation, and the bottom line. With RAN, Mobile and IP core, transport and applications and dozens of other integrated components, the network is one of the most complex areas to monitor.
A few days ago, we hosted a very well received webinar presented by Barry Schiffer (CTP) from eG’s Benelux team and George Spiers, CTP and real-world Citrix Administrator. They covered key questions and workflows, such as: A colleague and I were answering questions during the live webinar, and we received a lot of questions. One of the best things about participating in these webinars is the high quality and breadth of questions that we receive from the attendees.
Here on the Splunk Dashboards team we take your feedback seriously. While we can't get to every request right away, we do add most requests to the backlog so we can roll your feedback into the product. In this blog post, we'll cover new features and improvements to Dashboard Studio in Splunk Cloud Platform 8.2.2106 based on feedback from you, our customers.
Today we’re releasing our next major version of Icinga 2. Icinga 2.13 includes many long awaited enhancements and bug fixes, but also a lot of smaller changes.
Website uptime monitoring is exactly what it sounds like; a service that monitors your website from the countries you’ve selected, to see if it is up and running. This saves you the stress of having to constantly use your resource to check for any downtime, or individual errors/issues, or run the risk of your customers telling you it’s down. The best part about uptime monitoring is that you can choose how often you’d like your site to be monitored.
In recent days web application has become a vital part of our day-to-day life. We often don’t understand the technology behind an application as how it works, what type of programming languages have been used or what kind of databases are used to store and retrieve data. But when you try to create one such application you should definitely know how to build an application and the technology stack behind it.
Application Performance Management is all about gaining a complete picture of your applications' inner workings so you can make sure they're performing as they should. APM tools make it easier for developers to spot issues that are preventing their applications from providing outstanding user experiences. Furthermore, these monitoring services can help to limit the danger of fatal outages and downtime, which can be extremely costly for any company.
VirtualMetric presents a new feature as part of our Log Tracking Suite – VirtualMetric Log Reader. The new capability of the product connects to any device within your IT infrastructure, collects the log information, parses it and transforms it into easy to analyse charts and graphs. No need to add any data sources or to read logs manually.
We have recently published a script for the integration of the Anomaly Detection System (ADS) with a Check Point firewall. This ensures automated threat detection and response where attackers are blocked from accessing the network resources and causing even further harm. The previous integration with Fortinet describes a way of stopping the attacker at the perimeter. The following use case is largely the same, except with a Check Point firewall instead.
We’re launching a new line-of-code based method of grouping errors. Ifyou enable this grouping method in “App settings”, we will find the lineof code that was the source of the error and use that to split out errorsthat otherwise have the same type. To access the feature, upgrade to the latest AppSignal APM for Node.js integration. This is especially useful for Node.js andElixir parts because in these languages different errors often have the same type.
Qiao Han is a Software Engineer at BasisAI and co-author of Boxkite. He is interested in everything related to observability and has contributed to popular open source projects like libcurl and aiohttp. This post is written together with his coworker Linh Nguyen, who is a Tech Lead at BasisAI.
We recently introduced a new Map graph type into InfluxDB Cloud to help users visualize time series data that includes position. Above is a graph showing the most recent earthquakes in California, where the color of the marker indicates their magnitude. In this post, I’m going to walk through the ways to ingest geotemporal data into InfluxDB Cloud, and how to use the new Maps visualization type.
Performance profilers mainly aid developers in analyzing the performance of applications. The purpose is to improve poorly performing sections of code that make up the functions of the application. When you say performance profilers, common names that come to mind are Visual Studio performance profilers and Prefix by Netreo. In this article, we will focus on the specific Visual Studio profiling tools for memory and CPU usage.
Many companies are continuously modernizing their infrastructure – but there is no standard way for the perfect IT infrastructure. Still, hybrid architectures have become the status quo in enterprises. Almost all organizations have migrated at least parts of their assets to the cloud or run applications as cloud services. At the same time, businesses want to dovetail their IT architecture with software development and are therefore embracing dynamic infrastructures.
We are excited to inform all of our users that we will be bringing OpenSearch and OpenDashboards onto the Logit.io platform in the coming months. You may have already been aware that we’ve previously announced our support for the previous iteration of OpenSearch & OpenDashboards known as Open Distro in our response here. Due to our early public support of these oncoming changes you can see our platform cited on the official AWS OpenSearch website.
Intermittent network problems frustrate users, affect productivity levels, overwhelm your IT team, and are a pain for network administrators to solve. There are many problems that can affect network performance, and some of them are very complex to identify and understand. To help you proactively identify network problems that may be plaguing your network, we’re running you through some of the most common network problems!
AWS Simple Storage Service (S3) is by far the most popular service on AWS. The simplicity and scalability of S3 made it a go-to platform not only for storing objects, but also to host them as static websites, serve ML models, provide backup functionality, and so much more. It became the simplest solution for event-driven processing of images, video, and audio files, and even matured to a de-facto replacement of Hadoop for big data processing.
The global pandemic has changed B2C markets in many ways. In the U.S. market alone in 2020, consumers spent more than $860 billion with online retailers, driving up sales by 44% over the previous year.eCommerce sales are likely to remain high long after the pandemic subsides, as people have grown accustomed to the convenience of ordering online and having their goods – even groceries – delivered to their door.
The end-to-end monitoring of complex software systems is difficult, toil-intensive and error-prone. Developers, SREs and Platform teams must continuously invest effort in setting up and maintaining the monitoring setups that underpin the observability of their systems, or accept the risk of being unaware of ongoing issues and their impact on end users. Enter model-driven observability powered by Juju!