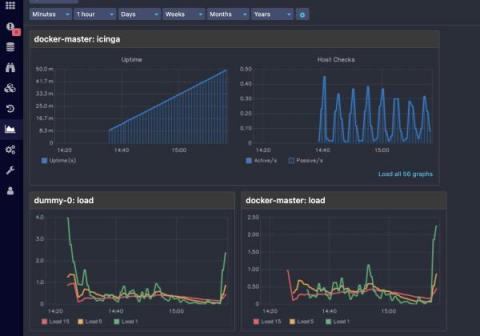
We are announcing Icinga-X!
Some would say, it’s “just” a release. We say it’s revolutionary. Never seen before. One of a kind. Exceptional. Why, you wonder? Because we have reinvented monitoring.
The Graphite module of Icingaweb2 is a great tool for rendering graphs from performance data. The latest version 1.2.0 introduces some bug fixes and new features like dark and light mode support, a lot of new templates, support for path wildcard, etc. The support for wildcard * was already available in the previous version. We have extended this support and added all the wildcards that graphite offers.
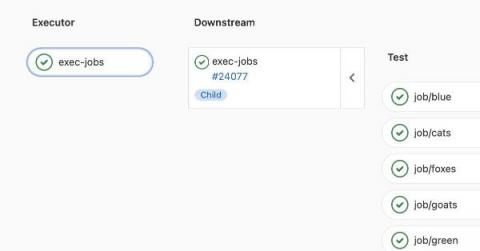
While doing packaging for Icinga, I noticed we have a lot of YAML files describing GitLab pipelines doing very similar jobs. The same build job across different operating systems. That’s wasteful behaviour, which leads to a bigger workload when it comes to modifying these jobs. Tasks like adding new versions and especially adding new operating systems become tedious. What I’m looking for is a way to have interchangeable values for our building jobs.
Today we’re announcing the general availability of Icinga Web v2.10.0. You can find all issues related to this release on our Roadmap. Please make sure to also check the respective upgrading section in the documentation.
We started the Feedback Week, because we wanted to hear what your thoughts around the Icinga Universe are. Whether it is about Icinga as a company, the products or the Community: in order to know what you feel and think about Icinga, we can develop the best possible monitoring tool for you. So here we are, recently finished off the second Feedback Week with a total of nearly 1300 votes all over Social Media and the Community!
This is a guest blogpost from Linuxfabrik At Linuxfabrik we have been developing a collection of currently 130+ plugins for Icinga, Nagios and other compatible monitoring systems for more than two years now. Each of these plugins is a specialized command line tool written in Python.
A few months ago I wrote about sending notifications to Rocket.Chat. While that messaging tool is quite powerful, one may also prefer to keep it simple. So let’s also address the good old IRC.
We´re proud of our many customers and users around the globe that trust Icinga for critical IT infrastructure monitoring. That´s why we´re now showcasing some of these enterprises with their Success stories. It´s stories from companies or organizations just like yours, of any size and different kinds of industries. Some of them are our long-standing customers, others have just recently profited from migrating from another solution to Icinga.
Icinga DB web has a better layout and is more user friendly. This makes monitoring more simple. Hence it would be nice if we could adapt all the Icinga modules to Icinga DB. In this blogpost, I will discuss how to adapt Icinga Web modules to Icinga DB. To do this, first and foremost, install and enable the Icinga DB module. Currently, monitoring backend is the default backend for all the modules.
This release of Icinga Director includes a bunch of new options to make your daily monitoring business easier and more comfortable. It includes many fixes as well as some new features for Sync Rules, Configuration Baskets and Permissions. Check out the Changelog for a detailed list about all changes. You can get started with Icinga Director by just adding the module to your Icinga installation: Follow the installation guide.