Operations | Monitoring | ITSM | DevOps | Cloud

Icinga

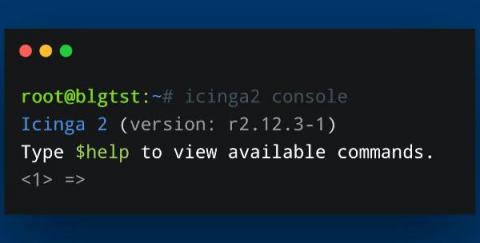
How to connect to the Icinga 2 API via the Icinga Console

Today I will show you a couple of small functions you can use with the Icinga Console. Using the Icinga Console can help with scripting in general and provides a quick and easy-to-use way of extracting information from your Icinga environment. We will take a look at extracting information belonging to the service objects in Icinga. Obviously, you can pinpoint different objects, like host objects, with which you can work via the Icinga 2 API and Console.

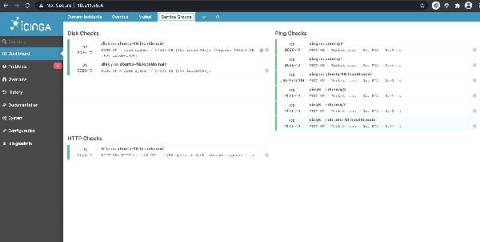
Creating dashboards based on custom filters

In this blogpost, I explain how to create dashlets using custom filters. This way you can create dashlets of your own which you find is necessary. Having dashboards in fact improves monitoring. Dashlets are the different sections under the given dashboard, which are the snapshots of some monitoring views and are defined by a name. Requirements: Icinga 2 and Icinga Web 2 installed.

Icinga 2 Config Sync: DIY Edition

Two weeks ago, Icinga 2 Config Sync: Behind the Scenes explained how the config sync in Icinga 2 works and how you can look behind the scenes. Today, we will put our knowledge from that post to the test and try to manually replicate the config sync. The most important takeaways will be recapped in this post, but if you are interested and have the time, the other post is also worth a read.

Icinga for Windows - Hyper-V and Cluster Plugins Preview

Today we finally have great news to share for everyone using Icinga to monitor Hyper-V and Windows Cluster environments. For quite some time we’ve been working on multiple new plugins to provide better monitoring option for Hyper-V and Windows Cluster. The new plugins are based on our PowerShell framework provided by Icinga for Windows. For the new plugins we decided to provide a preview first, in favour of a final release.

Icinga 2 Config Language (DSL): Advanced Apply Rules

As many users of Icinga don’t know what the DSL has to offer, I’m going to show you how to use custom variables and apply for rules to make your life easier when writing configuration for your Icinga environment. In this example we will use custom variables on a host to configure a dynamic set of services to monitor multiple web services behind a reverse proxy. On the host we define a custom dictionary called http_vhosts and assign our virtual hosts to it.

Icinga 2 Config Sync: Behind the Scenes

Today’s blog post dives into the internals of Icinga 2 and will give you an overview how the config synchronization works internally. We will take a small cluster as an example and follow the configuration files through the synchronization mechanism. We assume some familiarity with distributed Icinga 2 setups as this post will not go into details on how to set up an Icinga 2 cluster.

Sol1 Releases Meerkat - Next Generation Dashboards for Icinga 2

Meerkat is a lightweight Go and Javascript Icinga 2 client, that connects to the API and displays the status of various checks using elements, like cards, SVGs or images. If you need new users to see at a glance what is important and how it is laid out, Meerkat is the tool for you. It can even play sounds, making for the ultimate sysadmin soundboard! It is quick and easy to setup and use, simply grab the docker container or build from source.

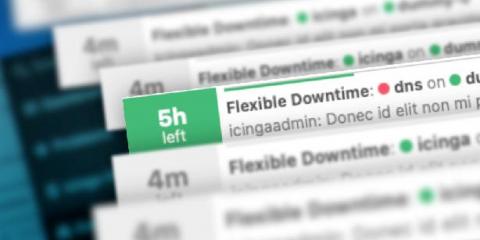
How downtimes are displayed in Icinga DB Web

With the development of Icinga DB we not only rebuilt the core of how Icinga stores and reads monitoring data. With a complete rebuild of the monitoring module we took the chance and refined most aspects of the user interface as well. One aspect that got attention is the display of downtimes, using their time based nature and putting the resulting data into context and visualizing it. Here are some of the details. Icinga DB Web Downtime List.