Operations | Monitoring | ITSM | DevOps | Cloud

Icinga

Environmental Monitoring and Alerting via Text Message

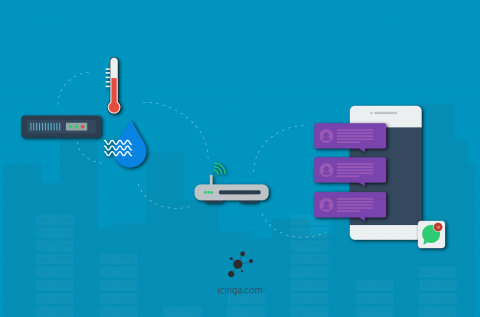
We are proud to announce that icinga.com is now also hosting integrations of hardware for monitoring environmental sensors and alerting via text message. The devices from the manufacturers listed on Icinga Integrations can easily be implemented into your Icinga monitoring by using plugins provided on Icinga Exchange.

A complete Logstash pipeline for your Icinga logs

When we hunt down problems in Icinga setups we ask for logs most of the time. While you get used to sifting through logs and collect some bash magic during the process there’s always the wish for this routine to be easier and especially faster. If you get logfiles from several days where each of the nodes produces millions of logfiles per day, every time you start your grep’s over and over get’s you madder and madder. So I started searching for a solution.

Icinga 2.11 Release Candidate

For months we have been working on one of the biggest and most important releases since the creation of Icinga 2. Icinga 2 version 2.11 includes improvements for performance, stability and scalability. After many changes of lines of code, additions and deletions we believe we’re finally there. But we want to have you on board, so we decided to go with a Release Candidate first. Today we’re happy to announce the general availability of this release!

Icinga Cube 1.1.0 is out!

As a little introduction for everyone who has not heard about the cube yet: The cube module is there to show statistics grouped by the custom variables that have been set for the hosts and services. They are then displayed in up to three dimensions for a quick overview to show the relations. The most prominent change is the addition of services: While it used to be only possible to have the hosts in a cube, the module has now been extended to provide full functionality with services as well.

Icinga Reporting - Hands On

After our initial release of Icinga Reporting for early adopters we continued our development and are happy to release v0.9.1 today. The release includes bug fixes and some minor enhancements for the usability. I want to take this opportunity to write a post aimed at the people who are new to the whole reporting shabang – like me. This week I set out to figuring out for myself why one would need to use reporting and how to get there – and to share my new knowledge with you!

Monitoring Automation with Icinga - Certificate Monitoring

In our ongoing efforts to make it easier to automate monitoring environments we recently introduced a new module for Icinga Web 2. This module is first and foremost a platform which lets you have an overview over all the certificates you are using in your environment to prove the identity of your devices. You can take a quick glance or a very detailed look at them.

10

Last week I told Blerim that Icinga came to life on 6.5.2009 … really, 10 years already? A small group of Nagios community members stood up and wanted to create more than a monitoring core with an enhanced web interface. APIs, integrations, backends, scaling, metrics, … A lot of passion and love was received from the community and actually, the Nagios ecosystem became more active again.