Operations | Monitoring | ITSM | DevOps | Cloud
August 2023
Strategies for Success in Business Energy Management
Why every developer needs to learn about source maps (right now)
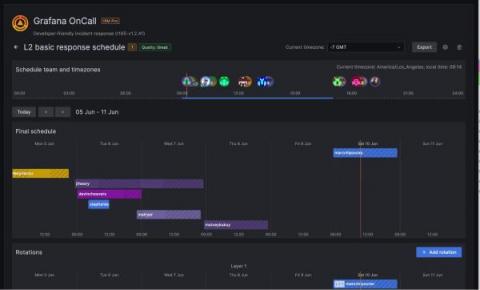
A better Grafana OnCall: web-based scheduling, mobile app, email support
Does anyone really enjoy being on-call? That looming dread over what could go wrong? The alarms in the middle of the night when everything does in fact go wrong? Of course not! But that doesn’t mean on-call shifts need to be a giant bundle of anxiety and exhaustion. This is something near and dear to our hearts at Grafana Labs, since the majority of our engineers participate in on-call shifts.
Monitor Google Cloud Vertex AI with Datadog
Vertex AI is Google’s platform offering AI and machine learning computing as a service—enabling users to train and deploy machine learning (ML) models and AI applications in the cloud. In June 2023, Google added generative AI support to Vertex AI, so users can test, tune, and deploy Google’s large language models (LLMs) for use in their applications.
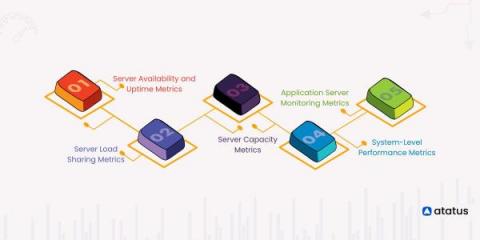
10 Critical Server Performance Metrics You Should Consider
More and more developers are worried about the end-to-end delivery of online apps as the DevOps movement gains attention. This covers the application's launch, functionality, and upkeep. Understanding the function of the server becomes more and more important as an application's user base grows in a live setting. You must collect speed data for the computers hosting your web apps in order to assess the health of your applications.
Operational Intelligence: 6 Steps To Get Started
Incident Management Today: Benefits, 6-Step Process & Best Practices
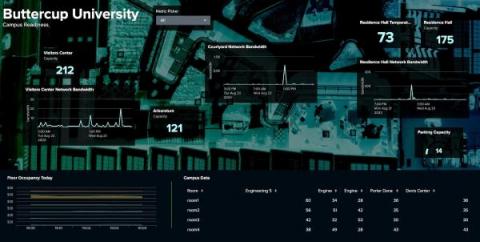
Dashboard Studio: How to Configure Show/Hide and Token Eval in Dashboard Studio
Shift Left Monitoring: A Pathway to Optimized Cloud Applications
I recently worked on a customer project to migrate an in-house application to the cloud, using a shift-left monitoring and testing strategy. The original application was developed with LAMP architecture and was being migrated to Spring Boot to modernize it and then run it on the cloud. I was fortunate to be part of the conversation during the day-0 talks. Not all IT managers do this.
What's New with Fluentd & Fluent Bit
At the recent KubeCon EU, we learned the significant news of the FluentBit v2.0 major release with numerous new features. What’s new and what’s to come for this key log aggregation tool? On the latest OpenObservability Talks, I hosted Eduardo Silva, one of the maintainers of Fluentd, a creator of Fluent Bit and co-founder of Calyptia.
What's New in Sysdig - August 2023
“What’s New in Sysdig” is back with the August 2023 edition! My name is Jonathon Cerda, based in Dallas, Texas, and the Sysdig team is excited to share our latest feature releases with you.
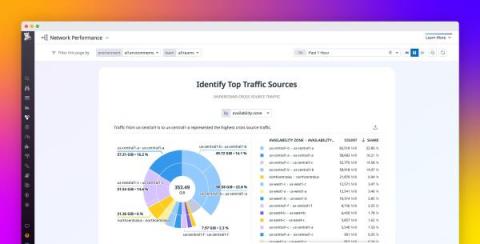
Discover the network maps
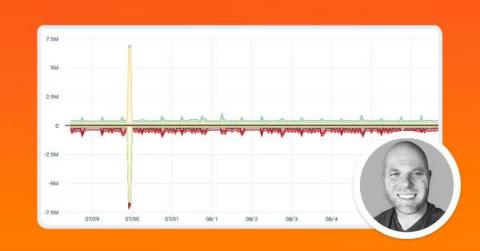
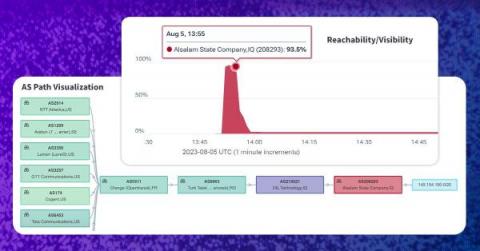
A Tale of Two BGP Leaks
Doug Madory investigates two large BGP leaks from August 28 and 29, 2023 and how RPKI ROV and other technologies can help mitigate widespread internet disruptions that can result for incidents like these.
How To Increase Revenue and Protect Your Business from Internet Disruptions with IPM
Over the last few months, we’ve been analyzing the thought-provoking findings of a recent study conducted by Forrester Consulting. This study illuminated the notoriously challenging-to-measure financial impact of Internet disruptions on eCommerce companies.
Accelerate your success with Splunk!
This Month in Datadog: DASH 2023 Recap, featuring Bits AI, Single-Step APM Instrumentation, and more
The Impact of Network Topology
LogicMonitor Envision Dexda Demo
Log Data 101: What It Is & Why It Matters
Enriching your Search Results with Lookups
It’s quite common for data from a Search to contain references to information that is, well, unintuitive. Error or Message Codes, Port Numbers, Reference IDs, and Customer Numbers are all useful pieces of information, but far from being human-readable. That information is often available in a collateral location, often a spreadsheet or database, where it can be looked up with a “key” field.
k6 extensions updates with Ivan Szkiba (k6 Office Hours #99)
How to learn Grafana with Grafana Play (Grafana Office Hours #10)
Serverless Elasticsearch: Is ELK or OpenSearch Serverless Architecture Effective?
Here's the question of the hour. Can you use serverless Elasticsearch or OpenSearch effectively at scale, while keeping your budget in check? The biggest historical pain points around Elasticsearch and OpenSearch are their management complexity and costs. Despite announcements from both Elasticsearch and OpenSearch around serverless capabilities, these challenges remain. Both of these tools are not truly serverless, let alone stateless, hiding their underlying complexity and passing along higher management costs to the customer.
Join hundreds of content publishers and IT consultants earning big from the ManageEngine Affiliate Program
The ManageEngine Affiliate Program helps content publishers, IT consultants, and bloggers monetize their traffic. With a wide range of over 60 IT solutions built by ManageEngine for enterprises and small- and medium-sized businesses, both cloud and on-premises, affiliates can use easy link-building tools to direct their audience to their recommendations and earn from qualifying purchases.
Azure Service Bus Dead-Letter Queue Monitoring
Simplifying Microservices Debugging on Kubernetes with Istio, OTel, and Apica
Microservices architecture has become increasingly popular in modern software development due to its scalability, resilience, and flexibility. However, with the benefits of microservices come the challenges of debugging and monitoring these distributed systems. Using the Istio service mesh, OpenTelemetry distributed tracing, and Apica’s Kubernetes-native observability platform, developers can easily collect and visualize performance data in real-time to identify and fix issues quickly.
Beyond the Hype: The Power of AI and Large Language Models in Networking
Artificial intelligence is certainly a hot topic right now, but what does it mean for the networking industry? In this post, Phil Gervasi looks at the role of AI and LLM in networking and separates the hype from the reality.
Getting Started With Sentry Cron Monitoring
Getting started with RabbitMQ
RabbitMQ is an open-source message broker software that facilitates communication and data exchange between various components of distributed applications. Acting as an intermediary, RabbitMQ enables different software systems, services, and devices to exchange information in a seamless and efficient manner. It follows the Advanced Message Queuing Protocol (AMQP), a standardized communication protocol designed for robust and scalable messaging.
Tracking Errors in a Node.js Application
Production bugs slow down velocity and often affect the complete trajectory of your release roadmap. It helps if you have a robust error tracking setup to rely on. In this article, we'll look at how to make tracking errors in your Node.js application more convenient, automated, and safe. Let's begin!
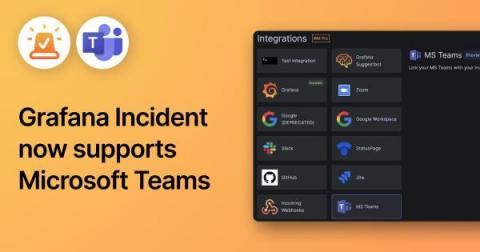
How to configure Grafana Incident with Microsoft Teams
Grafana Incident, the powerful incident response tool that is part of the Grafana IRM suite in Grafana Cloud, comes with a range of integrations out of the box, including Zoom and Google Meet spaces, GitHub and JIRA issues, and even a Google Doc template for post-incident review documents. One of the key features in Grafana Incident is the chatbot integration, which previously only supported Slack.
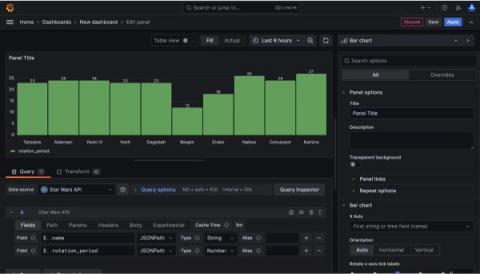
Grafana JSON API: How to import third-party data sources in Grafana Cloud
Have you ever wanted to test out Grafana Cloud but don’t have any available data to monitor? Well, have no fear! With the Grafana JSON API plugin, you can query publicly available JSON endpoints. The JSON API is a wonderful way to start using Grafana Cloud. You can quickly see data in action, and there are a multitude of things you can build, analyze, and monitor using the JSON API.
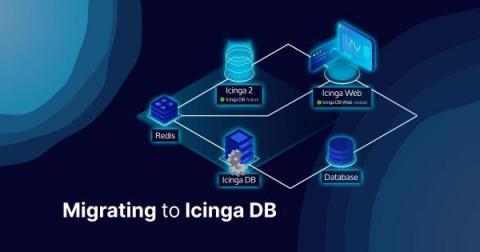
Migrating to Icinga DB
Although Icinga DB has been around for some time and many customers and users are already using it, there may still be some who are wondering how to upgrade/migrate to Icinga DB. This post will briefly explain the components of the Icinga DB and how to install them in a reasonable order. Note that it is assumed that all components are installed on the Icinga primary node(s) using a MySQL/MariaDB database.
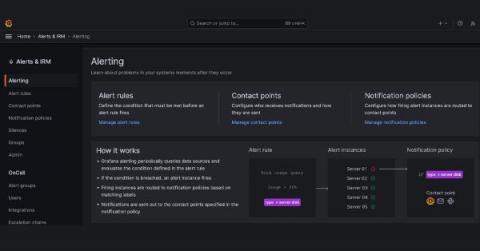
Alerting with Grafana and InfluxDB Cloud Serverless
Combining these two platforms provides an efficient, scalable and customizable tool for real-time data monitoring and alerting. In the data analytics and visualization world, it is crucial to have a system that not only effectively monitors your data, but can also alert you about any potential discrepancies or anomalies that may arise. One powerful tool set that enables you to monitor and alert on time series data is Grafana and InfluxDB Cloud Serverless.
Calculating Sampling's Impact on SLOs and More
What do mall food courts and Honeycomb have in common? We both love sampling! Not only do we recommend it to many of our customers, we do it ourselves. But once Refinery (our tail-based sampling proxy) is set up, what comes next? Since sampling is inherently lossy, it’s good to be sure the organization’s most important measurements aren’t negatively affected.
LogicMonitor Envision Platform UIv4 Overview Demo
Resilience Training
Enhancing Your Heroku Postgres Performance: A Guide to Effective Monitoring with Hosted Graphite
When it comes to managing your database, monitoring is crucial for maintaining data integrity, optimizing performance, and ensuring efficient resource allocation. In today's fast-paced technological landscape, having real-time insights into your database's health is more important than ever. This is where Heroku Postgres and Hosted Graphite come into the picture.
Hosted Graphite and Printers: Boosting Efficiency and Performance
Printers play a crucial role in various industries, helping businesses efficiently manage their document workflows. However, ensuring optimal printer performance and minimizing downtime can be a challenge. This is where hosted graphite comes into the picture. Hosted graphite is a powerful monitoring tool that allows businesses to graph metrics and gain valuable insights into their printer systems.
Ditch Nagios Errors for A Streamlined Alternative: "Return code of x is out of bounds"
In the realm of IT infrastructure monitoring, Nagios has long been a popular choice due to its robust feature set and flexibility. However, even reliable systems can encounter issues, and one recurring problem that Nagios users might encounter is the "Return code of x is out of bounds" error. In this blog post, we'll dive into the details of this error, what causes it, and how it can impact your monitoring efforts.
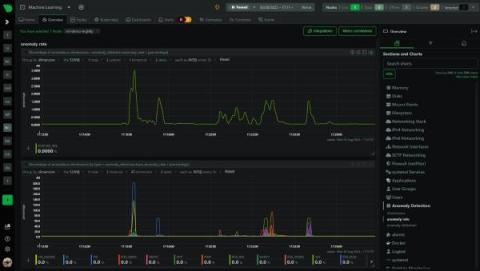
Anomaly Rate By Type
We have recently added a more detailed anomaly rate chart to Netdata that breaks out the overall node anomaly rate by type, this lets you more easily see what parts of your infrastructure might be experiencing an uptick in anomalies when you see the overall node anomaly rate increase.
SMTP Monitoring Uncovered: How Does It Work?
SMTP, which stands for Simple Mail Transfer Protocol, is a crucial component in the world of email communication. It’s a protocol used within the TCP/IP suite that facilitates the sending and receiving of email. SMTP is commonly used by a range of email clients such as Gmail, Outlook, Apple Mail, and Yahoo Mail. As of 2023, the number of daily worldwide emails reached an astounding 4.26 billion worldwide.
How to Monitor VoIP PBX Systems for Call Quality
If you’ve ever used a business phone system, chances are that you’ve used a VoIP PBX or IP PBX system at least once. There are many advantages of using VoIP PBX for your business, but like most applications that work over a network, they’re prone to performance issues if network problems arise. In this article, we’re running you through how to monitor VoIP PBX systems to ensure optimal call quality with network monitoring.
Distributed Systems Explained
Deepening the Path from Open Source to Essential Observability
For nearly a decade, Logz.io has offered a proven pathway for organizations using the world’s most popular open source tools to monitor and analyze their cloud systems—allowing them to enlist a far more efficient and cost-effective approach.
Why Observability Architecture Matters in Modern IT Spaces
Observability architecture and design is becoming more important than ever among all types of IT teams. That’s because core elements in observability architecture are pivotal in ensuring complex software systems’ smooth functioning, reliability and resilience. And observability design can help you achieve operational excellence and deliver exceptional user experiences. In this article, we’ll delve into the vital role of observability design and architecture in IT environments.
Building, deploying and observing SDKs as a Service - Part 3
Welcome back to the final installment in our three-part series on building your own SDK generator.
The Quirky World of Anomaly Detection
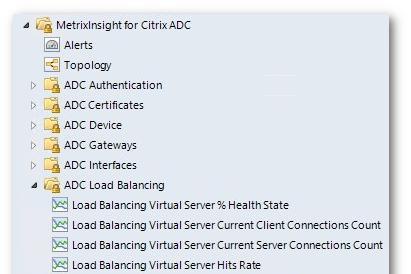
Why you should monitor Kubernetes in SCOM
2023 Cloud Cost Management Platforms: A FinOps Tools Competitive Analysis
Managing cloud costs has become a must for FinOps-focused businesses. Gotta keep a close eye on those expenses! So, what is the best way to do it? Find a platform that can help you get cost visibility and catch any cloud costs anomalies before they turn into a money waste! With tons of FinOps tools, how do you figure out which one suits your needs? And what exactly should you be looking at? We get it! There’s much to consider when picking the best platform to get those cloud cost insights.
Grafana Pyroscope 1.0 release: continuous profiling for a modern open source observability stack
When we launched Pyroscope in 2021, we had one clear goal: Give developers a powerful open source continuous profiling tool for collecting, storing, and analyzing profiling data. Grafana Labs had a similar goal when they released Grafana Phlare, a horizontally scalable, highly available open source profiling solution inspired by databases like Grafana Loki, Grafana Mimir, and Grafana Tempo.
Centralize AWS observability with Grafana Cloud
If you’re using AWS, you’re almost certainly using Amazon CloudWatch to collect and analyze observability data from your favorite AWS services. And while AWS remains the most broadly adopted cloud platform, not every company uses it exclusively, which means you need a tool that gives a centralized view across all your environments. With Grafana Cloud, you can do just that.
Infrastructure Monitoring Basics with Telegraf, InfluxDB, and Grafana
Earlier this year, I had the pleasure of speaking at the Open Source Summit North America. When choosing a topic, I felt it was time to return to our roots and discuss the subject that originally put InfluxDB on the map: infrastructure monitoring. What was especially exciting was the opportunity to showcase the new capabilities of InfluxDB 3.0 to the open source community and explain their significance for the future of infrastructure monitoring use cases.
LogicMonitor Azure Topology Mapping Demo
Datadog On Mobile Software Development
Prevent Critical Issues Resulting from Using EOL Citrix Receiver Versions
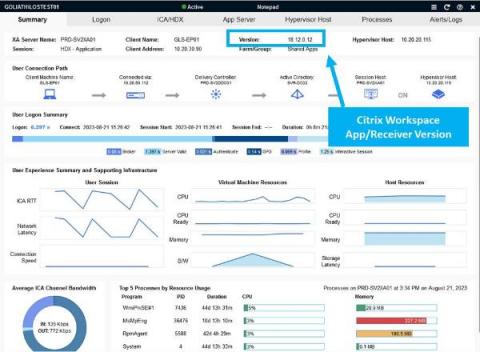
When I speak with IT professionals about end user experience and Citrix session performance, unsurprisingly, the subject of Citrix Workspace app versioning pops up. What is surprising, however, is their various degrees of attention toward maintaining up-to-date versioning of the Citrix Workspace app. Citrix Receiver was the previous iteration of Citrix Workspace app, but many organizations are still leveraging dated or unsupported Citrix Receiver versions.
Levitate - Last9's managed TSDB is now available on the AWS Marketplace
Levitate - Last9's managed TSDB is available on AWS Marketplace.
Coralogix Deep Dive - Remote Query for Logs
High Performance Archive Queries in Coralogix
Unlocking the Power of Hosted Graphite and Machine Learning
Monitoring and optimizing IT infrastructure, applications, and networks is crucial for businesses in today's digital landscape. It allows them to proactively identify issues, ensure optimal performance, and deliver a seamless user experience. However, traditional monitoring methods often fall short when it comes to handling the increasing complexity and scale of modern systems. That's where hosted graphite and machine learning come into play.
Making your JavaScript projects less noisy
If you’re using Sentry for JavaScript error monitoring, you may be familiar with a common challenge: sifting through noisy, low-value errors that hinder identifying high-priority issues for you and your team. Capturing errors in JavaScript browser project can be tricky. Why? Well, it’s not just a single environment.
Network Monitoring: A Comprehensive Overview
Imagine this: You’re a doctor. Your patient is a colossal network of computers, servers and cables, all intertwined and humming with activity. Your job? To keep an eye on this complex entity’s vital signs, ensure it runs smoothly and intervene when things start to look a little off. Welcome to the world of network monitoring and the role of network administrators.
Platform Engineers: Applied Best Practices Are Baked-in to Kubernetes Monitoring
Operating Kubernetes reliably and efficiently involves adhering to a set of best practices. These practices help ensure the stability, scalability and maintainability of your Kubernetes clusters and their applications. It's crucial for platform teams (responsible for the infrastructure) and software development teams (responsible for deploying applications) to work together in applying these practices.
The Top 4 Use Cases for Generative AI in Customer Experience
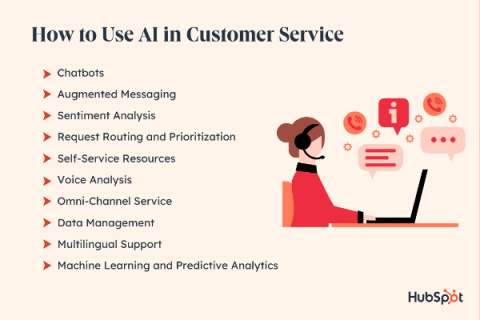
6 Underutilized Ways to Use AI in Customer Service in 2023
The 10-Step Guide To Your Online Presence with Squarespace
Scaling Window Event Forwarding with a Load Balancer
Scaling to collect Windows Event logs with the Windows Event Forwarding Source can be tricky. Luckily, you can use a load balancer, and with some math to scale the number of workers to collect the amount of data you expect, you can use workers to collect Windows logs from a large number of endpoints. Endpoint logs are the lifeblood of observability in an incident response program.
Manually Fetching Elasticsearch Metrics #devops #elasticsearch
Advancing Seamless IT Infrastructure Monitoring
We hope you’ve enjoyed a fantastic summer and are all eager to gear up for the next phase of advancing seamless IT infrastructure, services, and performance monitoring. As a seasoned SCOM administrator, you know the intricacies of orchestrating IT infrastructure monitoring. The landscape has evolved dramatically in recent years, with an exponential surge in monitoring alongside the expected depth of observations.
Rogers Outage: How to Identify Network Outages & Internet Outages
The nationwide Rogers outage in Canada majorly disrupted the lives of many, affecting wireless, Internet, and even people’s ability to call 911. When major network outages or Internet outages occur, it’s important to be notified as soon as they happen. Understanding the causes and identifying network outages or Internet disruptions is not only essential for individual users but also for businesses striving to maintain uninterrupted operations.
The Leading APM Use Cases
The majority of users continually depend on a variety of web applications to meet their everyday needs, so a business’s success is now often proportionate to the success of its application performance. As a result, the importance of using an appropriate APM solution has become even greater to businesses globally. Application Performance Monitoring (APM) still continues to grow in popularity and is now considered a must for observing the health and performance of your organization's applications.
Generative AI at Grafana Labs: what's new, what's next, and our vision for the open source community
As you’d imagine, generative AI has been a huge topic here at Grafana Labs. We’re excited about its potential role in bridging the gap between people and the beyond-human scale of observability data we work with every day. We’ve also been talking a lot about where open source fits in — especially if that Google researcher is right and OSS will outcompete OpenAI and friends. What role can we play to bring the community along?
DX NetOps in Action: Fujitsu Reduces TCO by 75% with Expanded "HumanCentric" Approach to NetOps
Fujitsu is a Japanese multinational information technology equipment and services company. Headquartered in Tokyo, Fujitsu has over 100 data centers worldwide. The company and its subsidiaries offer a diverse range of products and services in areas such as personal and enterprise computing (including x86), SPARC, and mainframe-compatible server products.
12 Best Application Performance Monitoring (APM) Tools
In today’s fast-paced world, applications are vital for driving businesses forward. However, without proper monitoring and insights into your application’s performance, you can’t identify what causes slow response times, high CPU usage, or database bottlenecks. But with an Application Performance Monitoring (APM) tool, you can gain deep visibility into your application’s performance by tracking critical metrics.
What are the Benefits of Using Cribl Stream with Amazon Security Lake?
In a recent user group meeting, guest speaker Marc Luescher from Amazon Web Services (AWS) joined us to give an overview of Amazon Security Lake. We talked about Cribl use cases and how Cribl Stream can bring your non-AWS data into the Security Lake. Enterprises are dealing with some significant challenges with security data in 2023. Inconsistent, incomplete, poorly-formatted log data is simultaneously scattered across companies and locked up in different silos within the organization.
Parquet File Format: The Complete Guide
How you choose to store and process your system data can have significant implications on the cost and performance of your system. These implications are magnified when your system has data-intensive operations such as machine learning, AI, or microservices. And that’s why it’s crucial to find the right data format. For example, Parquet file format can help you save storage space and costs, without compromising on performance.
Deleting Fields with BindPlane OP
How to deploy Hello World Elastic Observability on Google Cloud Run
Elastic Cloud Observability is the premiere tool to provide visibility into your running web apps. Google Cloud Run is the serverless platform of choice to run your web apps that need to scale up massively and scale down to zero. Elastic Observability combined with Google Cloud Run is the perfect solution for developers to deploy web apps that are auto-scaled with fully observable operations, in a way that’s straightforward to implement and manage.
Detecting Performance Monitoring Issues in Prometheus & Grafana | 2023 Guide
Advanced Monitoring and Observability Tips for Kubernetes Deployments
Cloud deployments and containerization let you provision infrastructure as needed, meaning your applications can grow in scope and complexity. The results can be impressive, but the ability to expand quickly and easily makes it harder to keep track of your system as it develops. In this type of Kubernetes deployment, it’s essential to track your containers to understand what they’re doing.
LogicMonitor Kubernetes Helm Monitoring
What is Synthetic Monitoring?
Introducing Error Groups to the Raygun API
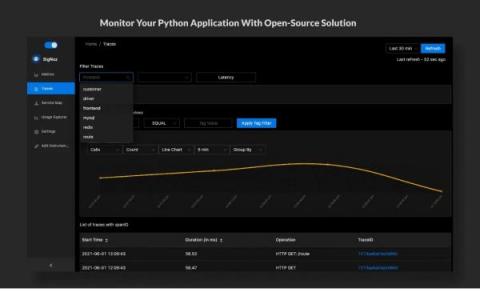
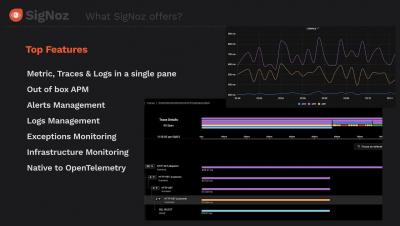
Monitor your Python application with full stack open source APM tool - SigNoz
In this article, learn how to setup application monitoring for Python apps using an open-source solution, SigNoz.
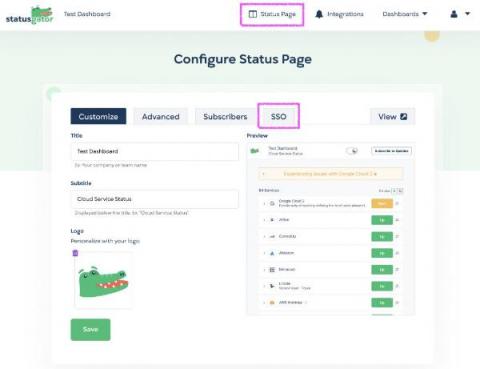
New Feature: Enhance Security with Status Page SSO
We’ve heard your feedback and it’s here: Status page SSO is now available on our Enterprise plan. Status Page Single Sign-On (SSO) empowers StatusGator customers to safeguard their status pages through a seamless Single Sign-On experience. You can now restrict access to your status page to only your team, employees, or users who have SSO access through your organization’s identity provider.
Getting started with Grafana Loki (Grafana Office Hours #09)
25 Essential Salesforce Monitoring Strategies for Optimal Performance and Security
Blackhat 2023 Recap: How Will Advanced AI Impact Cybersecurity?
How Nagarro transforms SAP operations with Avantra
E-3 Magazine, in the June 2023 issue, featured a cover story about Avantra and the collaboration with our customer Nagarro. Reason enough to let the mind wander a bit and write a little more about this exceptionally good collaboration. It all started in 2013, back when CIBER Managed Services GmbH and our solution was not yet called Avantra, but Xandria. From the initial product presentation in Freiburg im Breisgau, my hometown, it was easy to see how well the attendees understood the solution, and from the questions and answers, it became clear how well we, at Avantra, knew the problems of a fast growing managed services business.
A complete guide on Azure Integration Services
Top MySQL Monitoring Tools
As a database administrator, ensuring the smooth running of your MySQL database is paramount. Keeping an eye on vital statistics such as uptime, query performance, and resource utilization is a crucial aspect of maintaining database health. Fortunately, several monitoring tools are available in the market to help you keep track of these metrics. These tools provide you with insights that enable you to optimize database performance and prevent any potential threats.
Everything You Need to Know About Kubernetes
Welcome to the world of Kubernetes - a powerful container orchestration platform. Before we dive deep into the concepts of Kubernetes, let's grasp the concept of containers - a lightweight, and isolated units that package applications along with their dependencies, ensuring seamless deployment and portability. In this blog, you will witness Kubernetes incredible abilities. It can handle the ups and downs of your applications, ensuring they scale seamlessly, even when facing tough challenges.
How to Utilize Dark Web Monitoring Protection
Odds are, you've heard about the dark web. Nevertheless, you may be unsure about its threat to your business and how to address it. The dark web is a set of anonymously hosted websites within the deep web accessible through anonymizing software, commonly "TOR" (The Onion Router). The anonymity these websites provide makes them the perfect online marketplace for illegal activities.
Mean Time to Repair (MTTR): Definition, Tips and Challenges
Coralogix Deep Dive - Events2Metrics
A complete guide to metrics cost management in Grafana Cloud
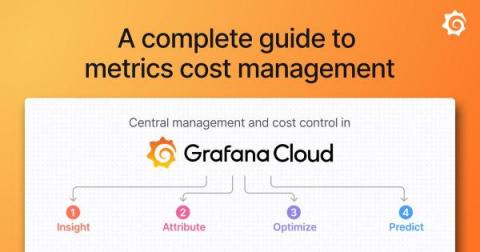
The macro economy can put a lot of pressure on organizations to reduce costs, typically with the central SRE and platform engineering teams coming under scrutiny. One common workaround we’ve seen countless teams make is compromising their observability by ingesting fewer metrics in the name of cost savings. But for centralized SRE/observability teams, the response to macro conditions should not be monitor less, but rather monitor smarter.
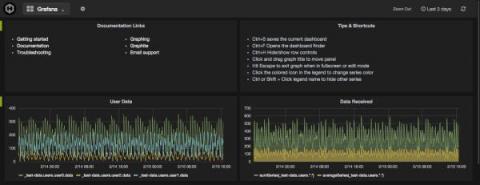
Grafana vs. Kibana
Every organization requires data analysis and monitoring solutions to gain insights into their data. Grafana and Kibana are two of the most popular open-source dashboards for data analysis, visualization, and alerting.
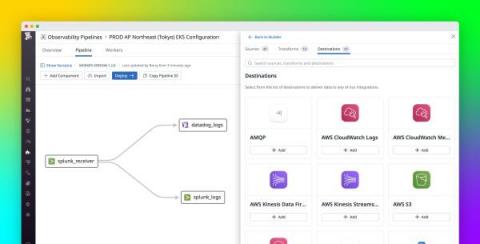
When Two Worlds Collide: AI and Observability Pipelines
25 Best Status Page Examples Showcasing Top Communication Practices
Status pages are a transparent and effective way to inform users of any downtime or incidents disrupting the company’s service. Without a status page, users are left in the dark, and support tickets pile up, affecting your relationship with them and their trust. That’s why having a status page is essential for a business in 2023.
PromQL Macros in Levitate
Define PromQL Macros to standardize complex PromQL queries in Levitate.
A Release Strategy for Continuous Innovation
At Cribl, we take pride in doing things differently. Our Customers First mentality is at the heart of everything we do as an organization–from free education and sandboxes, community programs, and platforms, to streamlining legal reviews on contracts. We strive to solve problems from first principles – understanding root causes to build optimal experiences vs. piecemeal solutions together. We aim to be a partner—working with you to address your challenges holistically.
What is MITRE ATT&CK and How to Use the Framework?
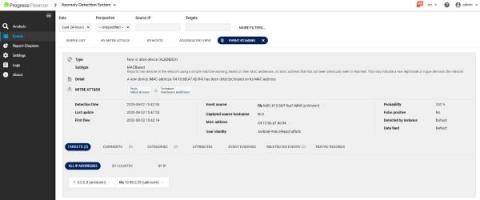
The MITRE ATT@CK® framework is one of the most widely known and used. The Flowmon Anomaly Detection System (ADS) incorporates knowledge of the MITRE ATT&CK framework. Using ADS and its MITRE ATT&CK knowledge makes detecting advanced threats against networks and IT systems easier and simplifies explaining the danger and risks when outlining an attack to all stakeholders.
How a Globoplay engineer discovered the power of SigNoz, with Paulo Henrique de Morais Santiago
Top tips: 3 ways emerging technologies can transform banking
Top tips is a weekly column where we highlight what’s trending in the tech world today and list out ways to explore these trends. This week, we’re sharing a few tips on how cutting-edge technologies can transform banking. The latest advancements in technology have improved banking in numerous ways. Cashless payments and digital banking have gained immense popularity in the last few years, so that traditional methods of banking are almost obsolete.
What is a Real-Time Data Lake?
Grafana 10.1 release: Enhanced flame graphs, new geomap network layer, and more
Grafana 10.1 is here! The latest Grafana release introduces new features and improvements that help deepen your observability insights in Grafana, including an improved flame graph, a new geomap network layer, simplified alerting workflows, and more. Grafana 10.1: Download now! For an overview of all the features in this release, check out our What’s New documentation. And to learn the details about all the Grafana 10.1 updates, read our changelog for more information.
Grafana k6 v0.46.0 release: TLS per gRPC connection support, new usage reports in Grafana Cloud k6, and more!
Grafana k6 v0.46.0 is here! The new release features the ability to configure TLS, new usage reports and PDF reports in Grafana Cloud, and tons of improvements for Grafana k6 OSS and Grafana Cloud k6. Here’s an overview of Grafana k6 v0.46.0, as well as some other important updates from the k6 team and community.
A Practical Developer's Guide on How to Troubleshoot HTTP 5XX errors
Imagine the following situation: You are on call, and your monitoring dashboard has flickering red lights due to an increased number of 5xx HTTP responses from one or more of your Kubernetes services. Now it is time to start to troubleshoot 500 Errors. Instead of panicking, you can use this blog as a guide.
Implementation Guide and Use Cases for Setting Up API Endpoint Monitoring
Stopping in Style: 9 Unique Designs for Website Maintenance Pages
We’ve already demonstrated how to maintain a fresh and functional website. Now, let’s explore some examples of creative maintenance pages! Nothing brings a good scrolling session to a halt quite like stumbling upon a website maintenance page. While maintenance pages can be annoying interruptions, they can also serve as attractive temporary visuals for sites undergoing updates. Many brands even elevate these pages into imaginative and artistic displays.
Everything You Need To Know About Log Viewers
Whatever the size of your network, as an engineer you will often notice a significant amount of log data being generated. This data will require centralizing for further analysis and management, which can be particularly challenging if you have varying log formats, such as plain text or HTML.
Introducing Rage & Dead Click Detection for Session Replay
Sentry developers work ridiculously hard to make sure that every update makes the developer experience better. And, just like you, we use Sentry to monitor…Sentry. While our issues feed seems under control, alerts aren’t popping off, and our releases are all healthy, our experience has taught us the undeniable value of taking a proactive approach to unseen customer-impacting issues.
Coralogix vs Splunk: Support, Pricing and More
Splunk has become one of several players in the observability industry, offering a set of features and a specific focus on legacy and security use cases. That being said, how does Splunk compare to Coralogix as a complete full-stack observability solution? Let’s dive into the key differences between Coralogix vs Splunk, including customer support, pricing, cost optimization, and more.
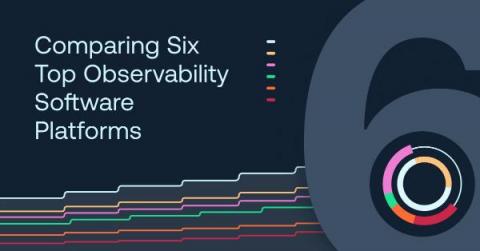
Comparing Six Top Observability Software Platforms
When it comes to observability, your organization will have no shortage of options for tools and platforms. Between open source software and proprietary vendors, you should be able to find the right tools to fit your use case, budget and IT infrastructure. Observability should be cost-efficient, easy to implement and customers should be provided with the best support possible.
Honeycomb + Tracetest: Observability-Driven Development
Our friends at Tracetest recently released an integration with Honeycomb that allows you to build end-to-end and integration tests, powered by your existing distributed traces. You only need to point Tracetest to your existing trace data source—in this case, Honeycomb. This guest post from Adnan Rahić walks you through how the integration works.
ExpressJS Container Debugging
In recent years, the landscape of application development has experienced a paradigm shift, largely driven by the rise of containerization and microservices architectures. Amid this transformation, Express.js has emerged as a dynamic and versatile framework that stands as a one-stop shop for crafting robust web applications. Its popularity owes much to its minimalist approach, allowing developers to swiftly build APIs and web applications with ease.
Preventing Outages: Implement an Internet Performance Monitoring Plan
Top Features of Grafana Versions 7 & 8
Grafana is a monitoring system that helps you visualize your infrastructure and provides notifications when errors occur. It offers interesting features on some versions as it's the case on v7 and v8. We will go through some that are very interesting in particular Panel editor, Tracing UI, bar graph, and visualization. With MetricFire specializing in hosted monitoring, you can easily make a Grafana dashboard by booking a demo or signing on to the free trial immediately.
GCP Managed Service For Prometheus vs. Levitate
A detailed comparison of Levitate and Google Managed Prometheus - Cost, Scale and Ease of Use.
Breaking the Cloud Illusion: The Hard Truth about Successful Migrations
How to Detect Microsoft Teams Outages: Is MS Teams Down?
Unleash an Avalanche of Streaming Data into Snowflake Snowpipe with Cribl Stream
Cribl Stream users have been successfully setting up security data lakes alongside, instead of, and underneath their SIEM solutions. Regardless of their architecture, they all want to reduce their latency and cut their costs. Snowflake, a popular choice for security data lakes due to its scalability and ease of use, recently released a new streaming ingest capability that Cribl Stream is ready to unlock.
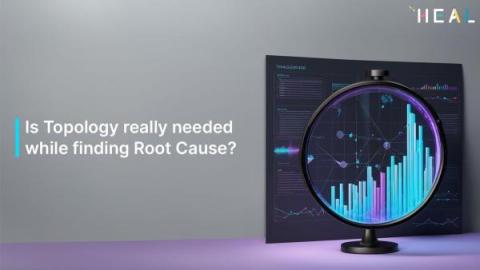
Is Topology really needed while finding Root Cause?
There are many instances in our lives where we are stuck in issues and try to understand what caused them. Our initial thoughts are to identify the reason and the cause. We aim to trace the issue back to the origin and try to address them from where it all started. Just like, when we get common cold, we try to figure out where we contracted it. Was it the late-night smoothie or exposure to someone with COVID symptoms? We never know until we figure out.
Network Health and Performance Monitoring: SolarWinds MIB DB
Network Health and Performance Monitoring: Custom Pollers
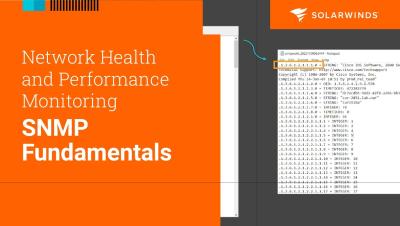
Network Health and Performance Monitoring: SNMP Fundamentals
4 Tips for AWS Lambda Performance Optimization
By the end of this AWS Lambda optimization article, you will have a workflow of continuously monitoring and improving your Lambda functions and getting alerts on failures. Serverless has been the MVP for the last couple of years and I’m betting it’s going to play a bigger role next year in backend development. AWS Lambda is the most used and mature product in the Serverless space today and is also at the core of Dashbird.
Apica wins the Silver Stevie Award in IoT Analytics Solutions
In the ever-evolving landscape of digital performance monitoring and observability, Apica has proven once again that it stands at the forefront of innovation. The recent recognition of Apica’s exceptional contributions comes in the form of the prestigious Silver Stevie Award in the Product & Service Category. The winners were announced in the 20th International Business Awards on August 14, 2023. We are elated to win the Silver Stevie Award in the category of (IoT) Analytics Solutions.
TensorFlow Lite Tutorial: How to Get Up and Running
The TensorFlow framework, developed by Google, is one of the most important platforms for creating deep neural network research and for training machine learning algorithms. Generally, it runs on the server side using powerful GPUs, consuming power and a lot of memory.
How eG Enterprise IT Monitoring Licensing is Cost-Effective and Flexible
IT monitoring tools are often complex to license and their licensing models are not always cost-effective. Today, I’ll cover some of the licensing models you may encounter as you evaluate IT monitoring tools. I will also highlight how eG Enterprise licensing makes it a cost-effective, affordable and flexible choice for our customers using our monitoring and observability platform.
What's New in the Kubernetes 1.28 Second Release
From its humble beginnings, Kubernetes’ growth story continues to be a testament to the power of open-source collaboration, and its current 1.28 second release is certainly no exception. It’s not just a product of ingenious coding but also the sweat and night oil of a global community – from seasoned industry stalwarts to students just making their debut in the open-source world.
A case for Observability outside engineering teams
Observability is being built by engineers for engineers. In reality, o11y is for all.
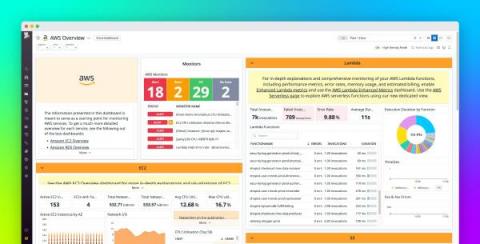
AWS Monitoring Demo
The Future of Observability: Navigating Challenges and Harnessing Opportunities
Observability solutions can easily and rapidly get complex — in terms of maintenance, time and budgetary constraints. But observability doesn’t have to be hard or expensive with the right solutions in place. The future of your observability can be a bright one.
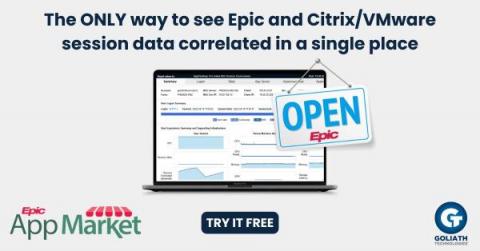
Epic 2.0 Module Launch
Philadelphia, PA – August 23, 2023 – Goliath Technologies, a leading provider of end-user experience monitoring and troubleshooting solutions, is proud to announce the second version of its Epic Module, which further enhances our exclusive integration designed to help improve clinician and healthcare worker satisfaction with Epic. Goliath is an Epic App Market Member, and our new module is available on the Epic Connection Hub.
Fixing Docker's Slow Performance on MacOS
Docker is designed for Linux. It works most efficiently on Linux systems due to its close integration with the Linux kernel. When handling large filesystems, like the ones built with PHP and Node, Docker desktop (MacOS Environment) experiences significant lag. The main reason is how file synchronization is implemented in Docker for Mac. Plus, disk space consuming behavior of such big PHP Projects.
Splunk and the Four Golden Signals
How we scaled Grafana Cloud Logs' memcached cluster to 50TB and improved reliability
Grafana Loki is an open source logs database built on object storage services in the cloud. These services are an essential component in enabling Loki to scale to tremendous levels. However, like all SaaS products, object storage services have their limits — and we started to crash into those limits in Grafana Cloud Logs, our SaaS offering of Grafana Loki.
Getting to the Root Cause of an Application Error
Cisco AppDynamics GovAPM delivers FedRAMP authorized all-in-one visibility
A FedRAMP authorized, single source of truth for your multi-layer tech stack. Similar to private sector counterparts, government organizations are embracing innovative cloud strategies. Cloud migration can unlock powerful outcomes, but it doesn’t change the need for compliance and great application performance. Cisco AppDynamics GovAPM delivers both — and much more.
Escaping Cloud Jail
Cloud costs are spiraling out of control at companies of all sizes. Here’s how to not let your cloud infrastructure costs handcuff your business.
Dashboard Stories: Gamified bug bash tracking
Black Hat 2023 Recap: The Future is Artificial
After a solid week in Vegas and another solid week of recovery, I’m back in the office (AKA sitting on my couch eating Doritos with chopsticks so I don’t get my keyboard dirty) to bring you my official Black Hat 2023 recap. This year’s event was noticeably scaled back, with fewer people swag surfing the business hall and more technical security folks in search of solutions for actual business problems.
Application Monitoring in WhatsUp Gold
Quick Tip: Application Monitoring in WhatsUp Gold
Quick Tip: Application Monitoring Overlay in WhatsUp Gold
From Service to Seeking Opportunities: How to Translate Your Talents to the Workplace
Quick Tip: Device Roles in WhatsUp Gold
New Item List
We are proud to announce that we are starting to roll out access to the new version of the item list page. The new page has been redesigned, refreshed and rebuilt from scratch; the fresh new look and feel is mobile friendly and also brings a number of immediate new benefits compared to the legacy page. Access will be available through a header to allow users to switch to the new page, with the ability to switch back to the legacy page if needed.
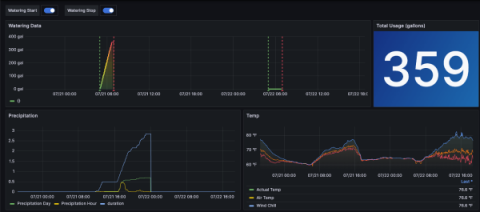
Dashboard Stories: Observing Garden Irrigation water usage with SQL
How to Use Kentik to Perform a Forensic Analysis After a Security Breach
In this post, Phil Gervasi uses the power of Kentik’s data-driven network observability platform to visualize network traffic moving globally among public cloud providers and then perform a forensic analysis after a major security incident.
Top 4 best practice recommendations to reimagine AWS Lambda monitoring
AWS Lambda monitoring best practices Site24x7's AWS monitoring tool for AWS Lambda enhances real-time visibility into your Lambda functions. It monitors the health, efficiency, and log details of your Lambda functions. Site24x7 provides effective management of serverless operations by gathering statistics on function engagement, code execution duration, and anomalies, enhancing the performance of your AWS serverless functions.
Catchpoint recognized in Six Gartner Hype Cycle 2023 Reports
Catchpoint is pleased to announce that Gartner has released six new Hype Cycle reports that mention Catchpoint in respective categories. Gartner Hype Cycles provide a graphic representation of the maturity and adoption of technologies and applications, and how they are potentially relevant to solving real business problems and exploiting new opportunities.
NestJS Monitoring with Atatus
NestJS is a popular and powerful open-source framework for building scalable and maintainable server-side applications with Node.js. It follows the principles of Object-Oriented Programming (OOP), Dependency Injection (DI), and Functional Programming (FP), making it an excellent choice for developers who prefer a modular and organized codebase. NestJs facilitates the creation of reliable, efficient, and scalable server-side applications using Node.js.
Code, Coffee, and Unity: How a Unified Approach to Observability and Security Empowers ITOps and Engineering Teams
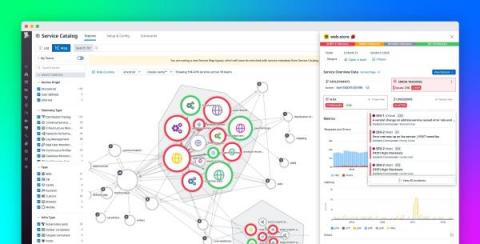
Visualize service ownership and application boundaries in the Service Map
The complexity of microservice architectures can make it hard to determine where an application’s dependencies begin and end and who manages which ones. This can pose a variety of challenges both in the course of day-to-day operations and during incidents. Lacking a clear picture of the ownership and interplay of your services can impede accountability and cause application development, incident investigations, and onboarding processes to become prolonged and haphazard.
Data Quality Metrics: 5 Tips to Optimize Yours
Amid a big data boom, more and more information is being generated from various sources at staggering rates. But without the proper metrics for your data, businesses with large quantities of information may find it challenging to effectively and grow in competitive markets. For example, high-quality data lets you make informed decisions that are based on derived insights, enhance customer experiences, and drive sustainable growth.
SLM for New-Age Infrastructure Observability with DX UIM from Broadcom
Dashboards & Reports for New-Age Observability with DX UIM from Broadcom
Configuring Kubernetes and OpenShift Monitoring with DX UIM by Broadcom
Sneak Peek: New-Age Infra Observability Viewer with DX UIM from Broadcom
IT Orchestration vs. Automation: What's the Difference?
Sumo Logic Customer Brown Bag - Observability - Alert Response - August 22, 2023
Using Traces for Testing - SigNoz Community Call with TraceTest and DevOps Educator Paulo
How to get actionable insights from your data
“When you peel back business issues, more times than not, you will find that the root cause is directly tied to data problems,” says Matthew Minetola, CIO at Elastic®. In today's world, all companies, new and old, are awash in data from multiple sources — stored in multiple systems, versions, and formats — and it’s getting worse all the time.
Writing your first Javascript test
VMware Horizon Monitoring
Regardless of whether you are a system administrator or an end-user, convenient and secure access to essential apps and desktops is essential to perform your tasks efficiently. Due to the new imperative of working remotely, virtual desktop infrastructure (VDI) solutions such as VMware Horizon, Citrix VDI, and many more have significantly boosted over the past few years. In fact, the VDI market is expected to grow from about $14 billion in 2022 to about $50 billion by 2030. Today we want to take a closer look at VMware Horizon, the importance of having proper monitoring, and what options to choose from.
Telegraf Deployment Strategies with Docker Compose
This article, written by Shan Desai, was originally published on his blog and is reposted here with permission. Shan is a Software engineer currently employed at Emerson Discrete Automation and is an Open-Source Contributor / DIY Tech Enthusiast currently working with Industrial IoT. Telegraf is widely used as a metric aggregation tool thanks to the diverse number of plugins it provides that interface with a multitude of systems without having to write complex software logic.
Simplifying Data Lake Management with an Observability Pipeline
Data Lakes can be difficult and costly to manage. They require skilled engineers to manage the infrastructure, keep data flowing, eliminate redundancy, and secure the data. We accept the difficulties because our data lakes house valuable information like logs, metrics, traces, etc. To add insult to injury, the data lake can be a black hole, where your data goes in but never comes out. If you are thinking there has to be a better way, we agree!
Lookup Tables and Log Analysis: Extracting Insight from Logs
Extracting insights from log and security data can be a slow and resource-intensive endeavor, which is unfavorable for our data-driven world. Fortunately, lookup tables can help accelerate the interpretation of log data, enabling analysts to swiftly make sense of logs and transform them into actionable intelligence. This article will examine lookup tables and their relationship with log analysis.
Scaling Monitoring Administration with Experience-Driven NetOps: AppNeta and DX NetOps
Today, pretty much every critical business service, every critical employee job function, every critical customer transaction, and so much more are all reliant upon network connectivity. It falls to network operations (NetOps) teams to ensure network connections continue to support these demands. Over time, the scale and the complexity of the networks the organization relies upon have continued to grow, making the job of NetOps teams increasingly challenging.
RISE with SAP for Managed Service Providers
What is Website Maintenance: Your Ultimate Guide to Keeping Your Site Functional
Website maintenance is not that different from keeping up with the maintenance of real brick-and-mortar stores. Would you shop at a dirty store, filled with broken furniture, and selling outdated products? We didn’t think so. Website maintenance plays the same role: it makes the business inviting, makes you look professional, and engages customers.
Observability and the DORA metrics
The Accelerate State of Devops Report highlights four key metrics (known as the DORA metrics, for DevOps Research & Assessment) that distinguish high-performing software organizations: deployment frequency, lead time for changes, time-to-restore, and change fail rate. Observability can kickstart a virtuous cycle that improves all the DORA metrics.
Less is more: How Grafana Mimir queries run faster and more cost efficiently with fewer indexes
Over the past six months, we have been working on optimizing query performance in Grafana Mimir, the open source TSDB for long-term metrics storage. First, we tackled most of the out-of-memory errors in the Mimir store-gateway component by streaming results, as we discussed in a previous blog post. We also wrote about how we eliminated mmap from the store-gateway and as a result, health check timeouts largely disappeared.
A Closer Look at AlertBot's Alert Group Feature
If we start by sharing that AlertBot’s alert group feature lets you, well, alert certain groups, then you might wonder what earth-shattering revelations we have in store — such as water is wet, fire is hot, and the pain of Game of Throne’s final season will never, ever go away (seriously, whatever happened to Gendry?!). Yes, you’re right: the alert group feature IS about alerting groups of people about a site failure — but as George R.R.
CISO's MOST WANTED: Outsmarting Cyber Criminals with Tips from a Former FBI Agent
SolarWinds Replacements: 6 Best Alternatives
SolarWinds is a trusted name in the world of IT management. This comprehensive suite of tools is designed to help organizations manage, monitor and troubleshoot their IT infrastructure. Solarwinds encompasses several capabilities, including network performance monitoring, systems management, IT security, database management, and IT helpdesk. Still, many SolarWinds replacements exist for IT teams looking for an alternative.
Upgrading NPM and SAM to Hybrid Cloud Observability
Top Elasticsearch Metrics to Monitor | Troubleshooting Common error in Elasticsearch
The Power of Visibility: Energy Company Uncovers the True Root Cause At Last
If you work in end user computing, you’re no stranger to the irritation of mystery issues. Tickets come in weekly but no matter how many teams you talk to, or fixes you try to implement, the issues never go away. You search and search for the root cause - but can’t find it. Frustrated, you assume it’s something outside of your control. Maybe the issues is caused by home Wi-Fi or end user error. That must be it – right?
What causes Azure costs to increase?
Mastering Microsoft 365 Monitoring for Businesses
A Complete Guide to Tracking CDN Logs
The Content Delivery Network (CDN) market is projected to grow from 17.70 billion USD to 81.86 billion USD by 2026, according to a recent study. As more businesses adopt CDNs for their content distribution, CDN log tracking is becoming essential to achieve full-stack observability. That being said, the widespread distribution of the CDN servers can also make it challenging when you want visibility into your visitors’ behavior, optimize performance, and identify distribution issues.
Scaling microservices: Challenges, best practices and tools
Scaling the deployment, in order to meet demand or extend capabilities, is a known challenge in many fields, but it’s particularly pertinent when scaling microservices. This article looks at the challenges of scaling microservices and examines best practices to overcome them while maintaining app quality, dev efficiency, and a good developer experience.
OpenTelemetry Webinars - Getting Started with OpenTelemetry
Parsing logs with the OpenTelemetry Collector
Part two: 7 must-know object-oriented software patterns (and their pitfalls)
The Significance of Root Cause Analysis in Revolutionizing Enterprise IT Operations
Ever been jolted awake by a midnight alarm because some server decided to take a sudden break? If you’ve been in IT operations, you know this isn’t just about fixing a problem; it’s about understanding and fixing it. Think of a favorite detective show, the detective is not just identifying the culprit, they are aiming to unravel the mystery “who done it?” and understand the motive.
Monitoring machine learning models in production with Grafana and ClearML
Victor Sonck is a Developer Advocate for ClearML, an open source platform for Machine Learning Operations (MLOps). MLOps platforms facilitate the deployment and management of machine learning models in production. As most machine learning engineers can attest, ML model serving in production is hard. But one way to make it easier is to connect your model serving engine with the rest of your MLOps stack, and then use Grafana to monitor model predictions and speed.
DX NetOps In Action: How Altice Accelerates Network Transformation with Broadcom
Altice Portugal is a wholly owned subsidiary of Altice Group, a multinational cable and telecommunications company. They have a presence across Europe, including in Belgium, France, Luxembourg, Portugal, and Switzerland, as well as in the Dominican Republic, the French West Indies, and Israel. With annual revenues of more than $2.8 billion (2,629 million Euros), Altice Portugal is Portugal’s largest telecom company. Altice offers fixed, mobile, and satellite network services to consumers.
Top Microsoft Azure Cloud Services Explained with Use Cases
Microsoft Azure is one of the most comprehensive and broadly adopted cloud service providers in the industry, offering over 200 fully featured services from data centers globally. A wide spectrum of organizations across all verticals use Azure – to lower costs, become more agile and innovate faster. Tight integrations with the Microsoft ecosystem and product portfolio make Azure highly attractive to many.
Choosing a Client Library When Developing with InfluxDB 3.0
A common question we get asked is “what client library should I use with InfluxDB 3.0?” This question isn’t as simple as it may seem. It can get confusing when deciding which client library to use while developing applications to write to and query from InfluxDB. There are numerous options to choose from and the answer may differ based on the following criteria: At first, this seems like an easy answer.
Understanding the Rasmussen model for failures
What does the Rasmussen model teach us about Site Reliability Engineering?
What Is ITOPs? IT Operations Defined
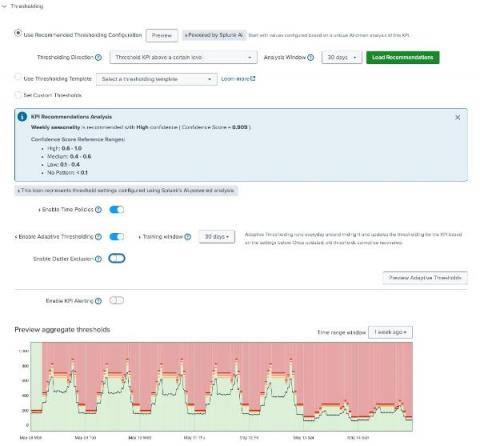
Developing the Splunk App for Anomaly Detection
ITSM and monitoring: A match made in IT heaven
Exploring & Remediating Consumption Costs with Google Billing and BindPlane OP
BindPlane OP Architecture Overview
Using Kubernetes with AWS Lambda: Scaling Up Your Serverless Applications
In today’s world, with Large tech giants and businesses looking forward to moving toward serverless architecture, there has been a significant demand for scaling the applications. It’s therefore no surprise that millions of companies worldwide have adopted, or are planning on migrating to a Kubernetes and AWS Lambda solution to take their serverless applications to the next level.
Grafana vs. SolarWinds - The Dashboards
Dashboards are great ways to visualize different KPIs in a single place. Metrics from all over your system can be framed together and viewed on a single screen, helping to correlate them and reducing the overall effort of analysis. But when it comes to Grafana vs. SolarWinds, which one is better? It is often difficult to choose between their dashboarding capabilities. Both tools provide their own visualizations and help bring out interactive dashboards for users to use.
Improving infrastructure visibility through custom monitoring with plugin integrations
Revolutionizing IT Monitoring with AIOps and generative AI
Understanding Site24x7's NCM Automation, reports, and compliance
Mastering Capacity Planning with ManageEngine Site24x7
DGTTG short - The Spindlewhorl Enigma of Serverless Debugging
Debuggers Guide to the Galaxy - Pilot Episode
How Gaming Analytics and Player Interactions Enhance Mobile App Development
Top tips: 5 use cases for digital twins in the manufacturing sector
Top tips is a weekly column where we highlight what’s trending in the tech world today and list out ways to explore these trends. This week we take a look at how manufacturing firms can use digital twins to completely overhaul the production process. A depiction of the digital twin-enabled industry of the future.
How to Identify Network Problems & Diagnose Network Issues
Just because your network is "UP," doesn't mean it’s working well! Network issues like choppy VoIP, jerky video calls, and network and application slowness issues can affect your business in drastic ways - which is why it’s important to know how to identify network issues for network performance troubleshooting. There are many problems that can affect network performance, and some of them are very complex to identify and understand.
10 Observability Tools in 2023: Features, Market Share and Choose the Right One for You
Understanding what's happening within your systems is a necessity. Have you ever wondered how experts keep an eye on systems to make sure everything's running smoothly? That's where observability tools come in! Observability tools are like helpers that give you a peek inside your tech. In this blog, we will talk about observability tools and how they can be used in different situations so it's easier for you to choose the right one for your organization.
Eliminating Bias in Machine Learning: Gold In, Garbage Out
How to Strengthen Kubernetes with Secure Observability
Kubernetes is the leading container orchestration platform and has developed into the backbone technology for many organizations’ modern applications and infrastructure. As an open source project, “K8s” is also one of the largest success stories to ever emanate from the Cloud Native Computing Foundation (CNCF). In short, Kubernetes has revolutionized the way organizations deploy, manage, and scale applications.
Infinite Retention with OpenTelemetry and Honeycomb
The needs of observability workloads can sometimes be orthogonal to the needs of compliance workloads. Honeycomb is designed for software developers to quickly fix problems in production, where reducing 100% data completeness to 99.99% is acceptable to receive immediate answers. Compliance and audit workloads require 100% data completeness over much longer (or "infinite") time spans, and are content to give up query performance in return.
Using DX NetOps Dashboards To Harness the Power of AppNeta Data
In today’s dynamic, complex network environments, there’s a big difference between having monitoring data and having intelligence. To troubleshoot issues quickly, it’s vital to have timely, intuitive visibility into the metrics that matter. With the combination of AppNeta and DX NetOps, teams can gain the insights they need to efficiently and intelligently manage their environments.
Dual Subsea Cable Cuts Disrupt African Internet
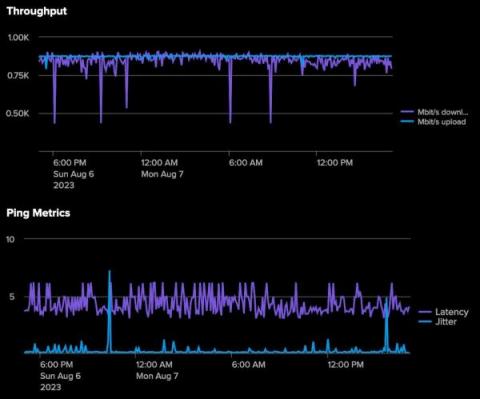
On Sunday, August 6, an undersea landslide in one of the world’s longest submarine canyons knocked out two of the most important submarine cables serving the African internet. The loss of these cables knocked out international internet bandwidth along the west coast of Africa. In this blog post, we review some history of the impact of undersea landslides on submarine cables and use some of Kentik’s unique data sets to explore the impacts of these cable breaks.
Sentry Profiling now supports Browser Javascript, React Native, and Ruby
Profiling is an essential component of a developer’s toolkit for identifying and addressing the thorniest performance bottlenecks. Whether you’re a backend developer looking to cut down cloud infrastructure costs, a frontend developer trying to speed up page load times, or a mobile app developer working to ensure smooth scrolling for users, Sentry Profiling pinpoints hot code paths in your production environment, so you can identify and optimize the slowest parts of your code.
Incident Management: A Complete Introduction
In the dynamic landscape of IT operations, incidents are bound to occur. Incident management is a structured and proactive approach to address and resolve these unexpected events promptly and effectively. It forms a crucial component of IT service management (ITSM), ensuring smooth operations and minimizing the impact of incidents on an organization’s productivity and customer experience.
How to Effortlessly Deploy Cribl Edge on Windows, Linux, and Kubernetes
Collecting and processing logs, metrics, and application data from endpoints have caused many ITOps and SecOps engineers to go gray sooner than they would have liked. Delivering observability data to its proper destination from Linux and Windows machines, apps, or microservices is way more difficult than it needs to be. We created Cribl Edge to save the rest of that beautiful head of hair of yours.
Easily install the Datadog Agent using AWS Systems Manager
AWS Systems Manager (SSM), an end-to-end management solution for AWS resources, provides a marketplace of pre-packaged software scripts for SSM-managed Windows and Linux instances, enabling AWS users to automatically install custom software on large groups of instances.
Sending Metrics - MetricFire Tutorial
New API authentication Pandora FMS
How Request Metrics manage data filtering in comparison to the removal of views in GA4
Monitoring Kubernetes with Prometheus
In part I of this blog series, we understood that monitoring a Kubernetes cluster is a challenge that we can overcome if we use the right tools. We also understood that the default Kubernetes dashboard allows us to monitor the different resources running inside our cluster, but it is very basic. We suggested some tools and platforms like cAdvisor, Kube-state-metrics, Prometheus, Grafana, Kubewatch, Jaeger, and MetricFire.
IBM performance monitoring with OpManager: How governance eliminates outages
Performance monitoring is an essential practice in network monitoring. When something goes wrong with a device, be it a physical server, a network storage system, or a virtual switch, there are often signs or symptoms. These symptoms might display in various places, and they could be related to the CPU, to the hardware, or maybe bandwidth usage. Only by tracking them can you be aware of performance issues.
The Importance of Monitoring XML Broker Services in Citrix StoreFront
In the complex and dynamic landscape of modern IT environments, the availability and smooth functioning of Citrix StoreFront are paramount. Citrix StoreFront is responsible for providing users with access to their virtual apps and desktops, but what ensures this seamless accessibility? Enter the critical role of XML broker services, and why monitoring them is an absolute necessity.
Monitor all operating systems with one solution: Icinga 2
We as a company build monitoring software. And we have committed to diversity. It is just logical and consequent for us to apply this principle not only to the people who do the work, but also to the work itself. To the monitoring software we build. Especially to Icinga 2 which, in a perfectly monitored environment, runs on every single machine. I.e. on every single OS powering all those machines.
What Is AI Monitoring and Why Is It Important
Artificial intelligence (AI) has emerged as a transformative force, empowering businesses and software engineers to scale and push the boundaries of what was once thought impossible. However as AI is accepted in more professional spaces, the complexity of managing AI systems seems to grow. Monitoring AI usage has become a critical practice for organizations to ensure optimal performance, resource efficiency, and provide a seamless user experience.
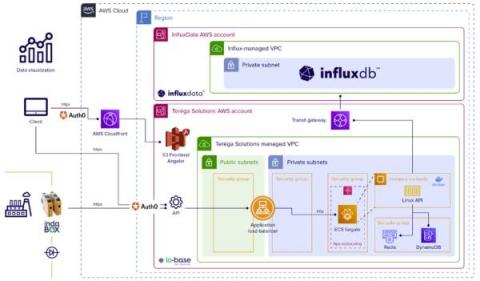
Teréga Replaced Its Legacy Data Historian with InfluxDB, AWS, and IO-Base
Teréga, a gas storage and transportation company in southwest France, manages a network of 5,000 kilometers of natural gas pipelines. The company’s mission is to accelerate the energy transition currently taking place, both at a territorial and a European level. It aims to extend a culture of responsibility to all its business and day-to-day activities.
Unveiling Splunk UBA 5.3: Power and Precision in One Package
4 Ways a Consistent Schema Drives More Value From Your Observability Data
One of the hardest challenges in computer science is deciding what to name things. Adoption of consistent nomenclature is difficult because there is no one right answer. In fact, it’s not uncommon for different teams within organizations to choose different names for the same technologies. In the world of monitoring and observability, this can create quite a lot of confusion – not to mention wasted resources.
How business acumen boosts application security
To outpace the competition in an era where high-performing, secure digital experiences are expected, business acumen can inform AppSec priorities. Now more than ever, business leaders are racing to build, modernize and deploy business-critical apps on-premises and within distributed, cloud native environments.
Troubleshooting and Fixing Kubernetes CrashLoopBackOff
In this post, we'll dive into what CrashLoopBackOff actually is and explore the quickest way to fix it. Fasten your seat belts and get ready to ride. Everyone working with Kubernetes will sooner or later see the infamous CrashLoopBackOff in their clusters. No matter how basic or advanced your deployments are and whether you have a tiny dev cluster or an enterprise multi-cloud cluster, it will happen anyway. So, let’s dive into what CrashLoopBackOff actually is and the quickest way to fix it.
Prometheus vs. AppDynamics
In the fast-evolving landscape of technology and software applications, ensuring optimal performance and reliability has become paramount. This article delves into two powerful tools that facilitate effective monitoring and management of digital systems: Prometheus and AppDynamics. With a focus on different aspects of application performance, these tools offer distinct advantages to businesses aiming to elevate their user experiences and operational efficiency.
Advance Azure message failure tracking for efficient business transaction management
Reduce MTTR with Grafana, Grafana k6, and Prometheus: Inside DHL's observability stack
Each year, more than 296 million packages are shipped around the world via DHL and their premium service, Time Definite International. And at DHL Express Switzerland, a local unit of the international logistics and shipping company, the IT team provides solutions for tracking customs clearance progress, analytics, mobile and optical character recognition (OCR) scanning, and warehouse management on every package that moves through Switzerland.
Introducing the new Avantra Editions
Getting _____________ for Less from Your Analytics Tools
Modernizing Monitoring: LogicMonitor's Latest Innovations
SQL Sentry Quick Demo | Query Tuning
SQL Sentry Quick Demo | Performance Monitoring
SQL Sentry Quick Demo | Capacity Planning
SQL Sentry Quick Demo | Alerting
Apica Acquires LOGIQ.AI to Revolutionize Observability
In the world of observability, having the right amount of data is key. For years Apica has led the way, utilizing synthetic monitoring to evaluate the performance of critical transactions and customer flows, ensuring businesses have important insight and lead time regarding potential issues.
OpenTelemetry Webinars: Getting Started with OpenTelemetry
Generative AI and Observability Automation - Sajid Mehmood & Michael Gerstenhaber
Optimizing cloud resources and cost with APM metadata in Elastic Observability
Application performance monitoring (APM) is much more than capturing and tracking errors and stack traces. Today’s cloud-based businesses deploy applications across various regions and even cloud providers. So, harnessing the power of metadata provided by the Elastic APM agents becomes more critical. Leveraging the metadata, including crucial information like cloud region, provider, and machine type, allows us to track costs across the application stack.
What is eBPF?
eBPF, or Extended Berkeley Packet Filter, is a kernel technology available since Linux 4.4. It lets developers run programs without adding additional modules or modifying the kernel source code. Think of it as a lightweight, sandboxed virtual machine (VM) within the Linux kernel that lets you run Berkeley Packet Filter (BPF) bytecode that uses certain kernel resources. Utilizing eBPF removes the need to modify the kernel source code and improves the software’s capacity to use existing layers.
The Benefits of Using Application Performance Monitoring Software for Website Performance Optimization
Website performance optimization has become critical for businesses in this digital era. If you want to maintain a competitive edge and ensure exceptional user experiences, application performance software is necessary. This indispensable tool empowers businesses to monitor, analyze, and optimize their website and application performance proactively. This article will explore the seven key benefits of implementing APM software for website performance optimization.
Is your cloud provider telling you everything, everywhere, all at once?
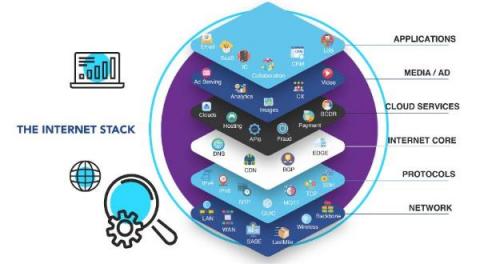
Today the Internet IS the new enterprise network your organization relies upon. However, most of your key applications and systems are outsourced to the cloud. In fact, huge parts of your Internet Stack are either outsourced to the cloud or to 3rd-parties who themselves rely upon the cloud. And that's an issue because if any of those cloud-based services go down, your network is going to be impacted.
Maximizing Efficiency and Savings: Explore Virtana's Latest Innovations to IPM and Cloud Cost Management
In today’s rapidly evolving business landscape, where IT infrastructure and cloud costs play a pivotal role, organizations demand advanced solutions that streamline operations, optimize performance, and drive cost efficiency. Virtana, a trailblazer in infrastructure monitoring and observability and true multicloud cost management, has taken another leap forward by introducing a host of groundbreaking features to our flagship products.
How to create custom assertions with Playwright's "toPass()" method
Performance Testing: Types, Tools & Best Practices
Cloud Analytics 101: Uses, Benefits and Platforms
From Disruptions to Resilience: The Role of Splunk Observability in Business Continuity
Reducing Mean Time to Diagnosis: How Salary Finance Uses Honeycomb to Ask the Right Questions
Salary Finance is a UK-based financial well-being employee benefit program. Over the last seven years, the company grew from a startup to a scaleup, earning rave reviews along the way from its more than 4,000 customers. However, with fast growth also comes natural growing pains. As their customer base expanded, so did the number of incidents they experienced, which also became harder to diagnose due to lack of visibility into their increasingly complex environment.
Right Size, Right Performance, Right Time
CTO Fireside Chat
Efficiency and Effectiveness
Configure Google Cloud Destination
Managing your applications on Amazon ECS EC2-based clusters with Elastic Observability
In previous blogs, we explored how Elastic Observability can help you monitor various AWS services and analyze them effectively: One of the more heavily used AWS container services is Amazon ECS (Elastic Container Service). While there is a trend toward using Fargate to simplify the setup and management of ECS clusters, many users still prefer using Amazon ECS with EC2 instances.
OpenTelemetry Webinars - Gathering data with the OpenTelemetry Collector
What Does Real Time Mean?
Cindy works long hours managing a SecOps team at UltraCorp, Inc. Her team’s days are spent triaging alerts, managing incidents, and protecting the company from cyberattacks. The workload is immense, and her team relies on a popular SOAR platform to automate incident response including executing case management workflows that populate cases with relevant event data and enrichment with IOCs from their TIP, as well execute a playbook to block the source of the threat at the endpoint.
A Deep Dive into Microsoft Cloud Monitoring for IT Pros
How to Perform a Forensic Analysis After a Security Breach
7 Ways to Better Website Performance
Veteran technology leader, Microsoft Data Platform expert returns to SolarWinds to focus on DataOps, SQL, cloud migration
Item Summarization
We are happy to announce the release of item summarization - a powerful tool to help users understand and utilize the data contained within the occurrences that make up an item. Organizations and engineers often deal with many occurrences within an Item when investigating underlying causes. With such vast amounts of data, spotting patterns and insights can be incredibly challenging and time-consuming.
The Sound of Code: Instrument with OpenTelemetry - Civo Navigate NA 2023
SigNoz Demo - Application Monitoring (APM), distributed tracing, Logs Management, Exceptions, Alerts
Dashboards, Metrics & Alerts management in SigNoz
Exceptions Monitoring in SigNoz
Query Builder Capabilities in SigNoz
OpenTelemetry - Why it's important?
APM & Distributed Tracing in SigNoz
Logs Management & Correlating Logs with Traces in SigNoz
The Top 15 Application Performance Metrics
Monitoring the key metrics of your application’s performance are essential to keep your software applications running smoothly as one of the key elements underpinning application performance monitoring. In this article, we will cover many of the key metrics that you should strongly consider monitoring to ensure that your next software engineering project remains fully performant.
Enhancements To Ingest Actions Improve Usability and Expand Searchability Wherever Your Data Lives
How to monitor pool water levels from anywhere with Grafana
I’ve had a swimming pool at my house in Massachusetts since 2016. One of the problems that pool owners like myself face when we go on vacation or leave for several days is evaporation from the pool and the water level dropping below the skimmers. This can happen due to sunlight and warm temperatures. It can also happen when temperatures drop at night and the pool is being heated — the water temperature is warmer than the air, causing the water to evaporate.
Netreo How To: Troubleshooting No Alerts Received
henToo many alerts are frustrating and have an even worse trickle down effect on IT teams. When alert deluge turns to alert fatigue, critical issues may be ignored. But seasoned IT pros will tell you that receiving no alerts causes even greater distress. When monitoring tools go silent, user complaints are sure to follow. Even with Netreo’s high-value, intelligent alert management capabilities, issues can go undetected from time to time.
Best Practices for Collecting and Querying Data from Multiple Sources
In today’s data-driven world, the ability to collect and query data from multiple sources has become a very important consideration. With the rise of IoT, cloud computing and distributed systems, organizations face the challenge of handling diverse data streams effectively. It’s common to have multiple databases/data storage options for that data. For many large companies, the days of storing everything in the singular database are in the past.
Exploring the Intelligence Gap: Robocop and Cyber Criminals
As technology professionals, we must consider the evolution of security and its connection to literature, such as George Orwell’s “1984” and Aldous Huxley’s “Brave New World.” The digital threats we face are often unseen, lying dormant until they can be weaponized for both good and evil purposes. Advancements in machine learning and algorithms have revolutionized data analysis, allowing us to observe and analyze behavioral patterns both online and offline.
Troubleshooting Salesforce with Exoprise
How the user interface of Request Metrics differs from Google Analytics 4
#Shorts Tired of the hassle of building custom reports in Google Analytics 4? Say hello to Request Metrics! We provide instant answers to common questions like screen sizes and user activity. No more manual setup or slow processes. Discover a better way to understand your users at https://drp.li/dPLro. 🚀
#analytics #googleanalytics #dataanalytics #userexperience #business
Monitoring Django Performance with Scout APM: A Step-by-Step Guide
Django is one of the most popular web frameworks for building applications. Its elegance and flexibility make it a favorite among developers, enabling them to craft intricate applications with ease. However, as applications grow in complexity and user traffic grows, the need for active performance monitoring becomes imperative.
Monitoring Your Metrics with Aiven
An Introduction to Frontend Testing
How to manually instrument iOS Applications with OpenTelemetry
What is an API Gateway?
API Gateways are vital components in today's digital landscape, facilitating seamless communication between systems and applications. To ensure optimal performance, monitoring API Gateways is crucial. MetricFire offers a comprehensive monitoring platform that tracks and analyzes key metrics, providing real-time insights into performance indicators such as latency, error rates, and throughput.
Effective Remote Debugging with VS Code
This post will discuss remote debugging in VS Code and how to improve the remote debugging experience to maximize debugging productivity for developers. Visual Studio Code, or VS Code, is one of the most popular IDEs. Within ten years of its initial release, VS Code has garnered the top spot among popularity indices, and its community is growing steadily. Developers love VS Code not only for its simplicity but also due to its rich ecosystem of extensions, including the support for debugging.
The Evolution of the Service Model In the Data Industry
How we tame High Cardinality by Sharding a stream
Using 'Sharding' to tame High Cardinality data for Levitate - Our Time Series Data Warehouse.
Azure Monitoring Agent: Key Features & Benefits
How Does The Food Industry Secure The Quality Of The Final Product
Observing the Internet of Things (Grafana Office Hours #08)
What's new in k6 browser? (k6 Office Hours #98)
Netdata v1.42.0 Release Meetup
New Raygun JS provider v2.27.0 to support performance timing
Top 5 network management trends in 2023
New trends emerge in network management every year, and 2023 is no exception. This year the industry is set to witness a plethora of advancements and breakthroughs that will revolutionize network administration. From the adoption of sophisticated analytics and machine learning to the proliferation of cloud-based solutions and the surging significance of cybersecurity, here are the top network management trends to watch out for in 2023.
10 Best Dynatrace Alternatives [2023 Comparison]
Dynatrace has established itself as a prominent player in the field of application performance management, but given that Dynatrace is an expensive solution aimed at large enterprises, exploring your options is essential. This comprehensive article presents a handpicked selection of the top 10 Dynatrace alternatives, each offering distinct advantages and capabilities.
What is Network Troubleshooting? - The Ultimate Survival Guide
Are you tired of feeling like a lost sailor on a stormy sea of computer problems? Well, fear not, dear reader, for we are about to embark on a journey to demystify the world of network troubleshooting! Intermittent network problems interrupt your flow of work, frustrate users, and can wreak havoc on your business. Troubleshooting network problems as fast as possible is the key to making sure that doesn’t happen.
Create PromQL alerts in Cloud Monitoring now in Public Preview
You can now create globally scoped alerting policies based on PromQL queries alongside yourtheir Cloud Monitoring metrics and dashboards.
Follow Splunk Down a Guided Path to Resilience
Top 10 Datadog APM Alternatives
When focusing on application performance monitoring (APM), there are currently many options to select from. With many of the tools available offering similar features, it can often be challenging to make an informed decision. One tool that appears to be on almost every list of ‘the best APM tools’ is Datadog.
Trace Propagation and Public API Endpoints in .NET: Part 1 (Disable All)
The W3C trace context specification is an amazing standard and a massive leap in standardization of telemetry correlation in the current climate of microservices being the de facto for new systems (that’s a debate for another day).
ScienceLogic Wins the 2023 TrustRadius Tech Cares Award for Exemplary Employee Resource Groups (ERGs)
ScienceLogic is proud to announce that we’ve received the 2023 TrustRadius™ Tech Cares Award.
The Darkside of GraphQL
Innovating with Faster, Safer Experimentation
How Qonto used Grafana Loki to build its network observability platform
Christophe is a self-taught engineer from France who specializes in site reliability engineering. He spends most of his time building systems with open-source technologies. In his free time, Christophe enjoys traveling and discovering new cultures, but he would also settle for a good book by the pool with a lemon sorbet.
Integrating Calico statistics with Prometheus
Metrics are important for a microservices application running on Kubernetes because they provide visibility into the health and performance of the application. This visibility can be used to troubleshoot problems, optimize the application, and ensure that it is meeting its SLAs. Some of the challenges that metrics solve for microservices applications running on Kubernetes include: Calico is the most adopted technology for Kubernetes networking and security.
Splashing into Data Lakes: The Reservoir of Observability
Transforming Bank Operations
With the recent advancements in technology and online digital services have transformed the way the banks work. Decades ago, banks used to handle everything on paper and the services opted for were very limited. Services were not unified, and account holders were forced to visit the bank even for small number of deposits or withdrawals or just to raise concerns. Today, technology has penetrated almost every industry and the banking sector is no exception to this undeniable reality.
Empowering IT Teams: Harnessing Microsoft Teams User Ratings for Enhanced User Experience
In today’s digital landscape, effective communication and collaboration are vital for the success of any organization. Microsoft Teams has emerged as a leading platform for seamless teamwork, enabling teams to connect, share, and work together effortlessly. Ensuring a positive user experience on this platform is crucial for maximizing productivity and fostering a collaborative culture.
Sumo Logic Customer Brown Bag - Logging - Data Tiers - August 9, 2023
Fixing Citrix Issues with eG Enterprise's Automation
Without any ability to self-heal, fixing Citrix usually requires manual intervention to remediate problems. This leads to time spent on mundane tasks managing the care and feeding of Citrix. Automation of these tasks for fixing Citrix provides: In our latest release, eG Enterprise v7.2, we have added new auto-correction and auto-remediation capabilities for Citrix administrators that remove the need for scripting. There are a few issues that can be a cause of constant frustration for admins.
How to Assess Device Readiness for Enterprise-wide Windows 11 Migration using Nexthink
The modern workplace demands hybrid working, robust security, and enhanced user experience features. All these interactions rely heavily on the Operating System (OS) and associated software stacks. The sheer scale of migrating tens of thousands of remote devices and their users to a new OS can lead to potential technical failures, delays in migration roadmap and budget overruns. OS migration can be a daunting task for organizations, as it is plagued by uncertainities.
More modern monitoring: how telemetry and machine learning revolutionize system monitoring
The State of Client-Side JavaScript Errors
As JavaScript has grown more prevalent on the web, so have JavaScript errors. As an error monitoring service, we have a unique perspective on how errors impact the web globally, and we are constantly learning more about how the web breaks. We’re thrilled to share this report today so we can all understand it better, and build a better web. We produce this report every week, you can check it out anytime via the free Global Error Statistics report.
Data Retention Policy Guide
How system enterprise vendors are adopting AIOps through acquisitions/organic growth
How to Monitor the Performance of Mobile-Friendly Websites
Mobile-friendly websites are a must. We are all using mobile devices more and more to access information and perform all kinds of work and tasks – shopping, banking, communication, dating, etc. Needless to say, if you operate a website, you more likely want to ensure people accessing it using mobile devices – tablets, smartphones, etc. – have a great experience.
Agentless Network Monitoring: An Introductory Guide
From communication and collaboration to data storage and sharing, networks are critical to almost every business operation today. Thus, monitoring the reliability and security of your network infrastructure is more critical than ever. Network monitoring entails observing and analyzing network traffic to identify issues, optimize performance, and ensure security.
Container Security Fundamentals - Linux Namespaces (Part 4): The User Namespace
Three Code Instrumentation Patterns To Improve Your Node.js Debugging Productivity
In this age of complex software systems, code instrumentation patterns define specific approaches to debugging various anomalies in business logic. These approaches offer more options beyond the built-in debuggers to improve developer productivity, ultimately creating a positive impact on the software’s commercial performance. In this post, let’s examine the various code instrumentation patterns for Node.js.
Is Moore's Law True in 2023?
Introducing the Telemetry Cloud: An All-In-One Observability Platform All Enterprises Can Afford
We’re excited to announce that we just released the next-generation of our observability platform – the Circonus Telemetry Cloud™. Here’s a closer look at what it is and why we think it’s a standout in the monitoring and observability space.
Understanding Grafana k6: A simple guide to the load testing tool
Grafana k6 is a powerful, developer-friendly tool designed and engineered with a focus on load testing — but it boasts capabilities that extend far beyond that use case. Understanding the inner workings of k6 is helpful to fully leverage its potential, and to tailor the tool to your specific testing needs. Read on to learn how k6 is structured, and how its underlying design provides the best possible reliability and load testing experience.
Diving in to OpenTelemetry data with our new Trace and Logs Explorer
How to monitor Azure App Registration Client Secret Expiration Notification?
The Benefits of Business Monitoring in the Gaming Industry: Enhancing Savings, User Experience, and Performance
The gaming industry has always been a highly lucrative and adored field. According to online gaming industry statistics, it is projected to surpass $33.77 billion by 2026. However, a downside emerges when governments impose substantial taxes on the income generated from gaming. It’s happening now. The Indian government has decided to impose a 28% tax on online gaming, which may lead to a funding shortage and a decrease in investor confidence.
Iraq Blocks Telegram, Leaks Blackhole BGP Routes
This past weekend, the government of Iraq blocked the popular messaging app Telegram, citing the need to protect Iraqi’s personal data. However, when an Iraqi government network leaked out a BGP hijack used for the block, it became yet another BGP incident that was both intentional, but also accidental. Thankfully disruption was minimized by Telegram’s use of RPKI.
Leveraging Cribl as an Integral Part of Your M&A Strategy
One of the most exciting things about bringing products to market at Cribl is seeing customers continually find new ways to leverage them to help solve their data challenges. I recently spoke to a customer who described Cribl as the foundation of their data management strategy and a key part of their post-acquisition data engineering process. Let’s take a deeper look into how Cribl can help.
Key questions to ask when setting SLOs
Many organizations rely on service level objectives (SLOs) to help them gauge the reliability of their products. By setting SLOs that define clear and measurable reliability targets, businesses can ensure they are delivering positive end-user experiences to their customers. Clearly defined SLOs also make it much easier for businesses to understand what tradeoffs they may have to make in order to deliver those specific experiences.
The Guide to MSP Network Monitoring for Multi-Client Visibility
Restarting Kubernetes Pods: A Detailed Guide
This blog will help you learn all about restarting Kubernetes pods and give you some tips on troubleshooting issues you may encounter. Kubernetes pods are one of the most commonly used Kubernetes resources. Since all of your applications running on your cluster live in a pod, the sooner you learn all about pods, the better.
Install Pandora FMS with our online installation tool
Release 1.42.0 - Integrations Marketplace, SystemD Journal Function, and more!
Debuggers Guide to the Galaxy - Promo Video
Free Jaeger Alternatives [comparison 2023]
Checkly Advances Monitoring as Code with New User-Centric Features
Improved cost visibility and 60 percent price drop for Managed Service for Prometheus
We’ve dropped pricing for samples ingested into Managed Service for Prometheus by 60%, and improved our metrics management interface.
Unify your observability signals with Grafana Cloud Profiles, now GA
Observability has traditionally been conceptualized in terms of three core facets: logs, metrics, and traces. For years, these elements have been seen as the “pillars” of observability, serving as the foundational components for system monitoring and delivering key insights to improve system performance. However, with the exponential growth in system complexity, a more comprehensive and unified perspective on observability has become necessary.
Top 5 Guidance Report recommendations by Site24x7 to enhance visibility into your AWS EC2
AWS EC2 Monitoring- Guidance Report recommendations Getting visibility into your Amazon Web Services (AWS) Elastic Compute Cloud (EC2) instances is a challenge. Site24x7 enables you to enhance your visibility into AWS EC2 instances, consolidating all information in a unified location. You can replace the isolated monitoring approach for EC2 instances by combining instance metadata with system-level metrics. This allows for effective monitoring of your dynamic AWS EC2 environment.
Mainframe Observability with Elastic and Kyndryl
As we navigate our fast-paced digital era, organizations across various industries are in constant pursuit of strategies for efficient monitoring, performance tuning, and continuous improvement of their services. Elastic® and Kyndryl have come together to offer a solution for Mainframe Observability, engineered with an emphasis on organizations that are heavily reliant on mainframes, including the financial services industry (FSI), healthcare, retail, and manufacturing sectors.
Cribl Makes Waves at Black Hat USA 2023, Unveils Strategic Partnership with Exabeam to Accelerate Technology Adoption for Customers
One of our core values at Cribl is Customers First, Always. These aren’t just buzzwords we use to sound customer friendly; it’s ingrained in our daily communication and workload. Without our customers, we wouldn’t exist. One of the ways we’ve upheld this value is to seek out strategic partnerships with other companies aligned with our customers’ needs – both present and future.
Measuring the time between spans in an OpenTelemetry trace with a Clickhouse query
DataDog Flex Logs vs Coralogix Remote Query
While Coralogix Remote Query is a solution to constant reingestion of logs, there are few other options today that also offer customers the ability to query unindexed log data. For instance, DataDog has recently introduced Flex Logs to enable their customers to store logs in a lower cost storage tier. Let’s go over the differences between Coralogix Remote Query vs Flex Logs and see how DataDog compares. Get a strong full-stack observability platform to scale your organization now.
InfluxDB 3.0 is up to 45x Faster for Recent Data Compared to InfluxDB Open Source
With the release of InfluxDB 3.0, one of the big questions is: how does it compare to previous versions of InfluxDB? We have begun benchmarking InfluxDB 3.0 with production workloads to start giving users more insight into the benefits of adopting InfluxDB 3.0. In this post, we look at recent benchmarks comparing InfluxDB 3.0 to InfluxDB Open Source (OSS) 1.8.
Monitoring as Code in Your Software Development Lifecycle
When we launched the Checkly CLI and Test Sessions last May, I wrote about the three pillars of monitoring as code. Code — write your monitoring checks as code and store them in version control. Test — test your checks against our global infrastructure and record test sessions. Deploy — deploy your checks from your local machine or CI to run them as monitors.
How to monitor CoreDNS with Datadog
In Part 1 of this series, we introduced you to the key metrics you should be monitoring to ensure that you get optimal performance from CoreDNS running in your Kubernetes clusters. In Part 2, we showed you some tools you can use to monitor CoreDNS. In this post, we’ll show you how you can use Datadog to monitor metrics, logs, and traces from CoreDNS alongside telemetry from the rest of your cluster, including the infrastructure it runs on.
Tools for collecting metrics and logs from CoreDNS
In Part 1 of this series, we looked at key metrics you should monitor to understand the performance of your CoreDNS servers. In this post, we’ll show you how to collect and visualize these metrics. We’ll also explore how CoreDNS logging works and show you how to collect CoreDNS logs to get even deeper visibility into your Deployment.
Key metrics for CoreDNS monitoring
CoreDNS is an open source DNS server that can resolve requests for internet domain names and provide service discovery within a Kubernetes cluster. CoreDNS is the default DNS provider in Kubernetes as of v1.13. Though it can be used independently of Kubernetes, this series will focus on its role in providing Kubernetes service discovery, which simplifies cluster networking by enabling clients to access services using DNS names rather than IP addresses.
Enhancing Security Workflows with Real-Time Notifications via Microsoft Teams and Slack
The integration with popular collaboration platforms like Microsoft Teams and Slack marks a pivotal advancement in security workflows. We are introducing new capability to post events from Flowmon ADS into Teams channel or Slack to instantly notify security teams. Integrations scripts are based on simple webhooks and available out of the box on our support portal both for Teams and Slack.
Kubernetes Liveness Probe Guide
Kubernetes liveness probes are a critical component for monitoring the health and availability of application containers running within a Kubernetes cluster. They allow Kubernetes to determine whether a container is running as expected and take appropriate actions if it is found to be unresponsive or in an unhealthy state. Liveness probes periodically check the health of containers by sending requests to a specified endpoint or executing a command within the container.
9 Popular Kubernetes Distributions You Should Know About
Kubernetes has become the go-to platform for container orchestration, allowing teams to more efficiently manage their containerized applications. Vanilla Kubernetes, as well as managed Kubernetes, are the two options available when building up a Kubernetes system. A group of programmers using vanilla Kubernetes must download the source code files, follow the code route, and set up the machine's environment.
SRE in Transition: From Startup to Enterprise
From On-call to Non-call: Resolving Incidents Before They Even Happen
Troubleshooting Cloud Application Performance: A Guide to Effective Cloud Monitoring
The scalability, flexibility, and cost-effectiveness of cloud-based applications are well known, but they’re not immune to performance issues. We’ve got some of the best practices for ensuring effective application performance in the cloud.
Unleash Microsoft Call Quality Dashboard Insights
Finding answers when someone has a Teams performance issue is clunky and time-consuming for IT teams. The Microsoft Call Quality Dashboard (CQD) has a wealth of data, but there’s so MUCH data that it can be hard to find the answers quickly to optimize Microsoft Teams performance.
Integrate Monitoring as Code into your Software Development Lifecycle
From Solution to Startup
ML-Powered Assistance for Adaptive Thresholding in ITSI
Monitoring with Graphite: Installation and Setup
This section outlines how to install and set up Hosted Graphite independently. MetricFire's product, Hosted Graphite, runs Graphite for you so you can have the reliability and ease-of-use that is hard to get while doing it in-house.
ITOps vs. DevOps: what's the difference?
Deliver exceptional digital experiences with Cisco Cloud Native Application Observability
Thanos vs. VictoriaMetrics
A deep dive comparison between Thanos and VictoriaMetrics: Performance and Differences.
Observability vs. Telemetry vs. Monitoring
Observability vs Telemetry vs Monitoring - What they are, differences and what lies in future.
OpenTelemetry Webinars: Gathering data with the OpenTelemetry Collector
ManageEngine Site24x7: One-stop observability platform for website monitoring
Best tools for monitoring IoT devices
The security camera is one of the most prevalent IoT devices being used today. Ironically, one of these cameras' primary vulnerabilities is that they may be stolen or damaged - you need protection for the security cameras. Having gadgets that operate independently saves time since you may leave them to do the job they intended. However, remotely placed, unsupervised equipment must be monitored, and the most effective method is through the use of an automated monitoring system.
What's new in distributed trace visualization in Grafana
At Grafana Labs, we are constantly improving our feature set, and tracing is no different. Traces are often overshadowed by logs and metrics, but they’re a pillar of observability for a reason. Used correctly, organizations that can quickly and successfully follow a chain of events through a system gain a more holistic view of their systems and are better equipped to find and fix issues faster.
Unraveling AWS Lambda: Exploring Scalability and Applicability
In our previous blog, we shared our firsthand experience of implementing a tracing collector API using serverless components. Drawing parallels with Amazon Prime Video’s architectural redesign, we discussed the challenges we encountered, such as cold-start delays and increased costs, which prompted us to transition to a non-serverless architecture for more efficient solutions.
IT Event Correlation: Software, Techniques and Benefits
When Third-Party Plugins Go Wild
Every single day RapidSpike detects thousands of problems with website third-party plugins that are causing revenue and customer experience issues, and 90% of them are not just affecting our users; they are affecting every user of that third party. The difference is with RapidSpike, we tell them about it. In 2018, a major e-commerce website experienced a significant performance failure due to a third-party plugin.
Introducing the new Lumigo Live Tail
As developers, we understand the immense value of having real-time access to live traces. It significantly enhances our ability to identify, debug, and troubleshoot potential issues within applications, streamlining the development and deployment process. Today, we are excited to introduce the new and improved Live Tail feature at Lumigo, which enhances your observability experience to a whole other level.
Cut through the complexity of your public sector cloud migration
Learn how application performance monitoring can ease cloud migration challenges for public sector agencies. Cloud technology has come of age, and organizations across every industry are rapidly migrating their key applications to these flexible environments. Like their enterprise counterparts, public sector agencies are excited about the potential of cloud services.
The Road Ahead: 4 Ways AIOps Will Build More Resilient IT Operations
Benefits and challenges of containerization for IT operations
Custom Java Instrumentation with OpenTelemetry
Elasticsearch Vs OpenSearch | Comparing Elastic and AWS Search Engines
Microsoft Teams Monitoring to Troubleshoot & Optimize Performance
A glimpse into the day-to-day life of a software monitoring expert
How to install Rollbar in a Vue JS app
A guide to single-page application performance
Operationalizing AI: MLOps, DataOps And AIOps
Automate network topology mapping with OpManager's topology software
Network topology mapping is the process of mapping topological relationships between network components and establishing those relationships in the form of network diagrams. Network mapping helps visualize physical and logical connections between all elements and nodes, thus simplifying network management. A network topology mapper is a tool that helps perform network mapping effectively.
How to Transform the Management and Modernization of Your Infrastructure to Maximize Business Outcomes
Driving A Successful SD-WAN Migration: Obkio's NPM Solution Empowers StableLogic in a Global SD-WAN Deployment
Synthetic Monitoring: What is it, Challenges, and How to Get Started
With Infrastructure as Code and service-oriented development, a modern web app can consist of countless moving parts developed by multiple development and DevOps teams. When establishing a high-velocity development environment, the main question is, "How can you guarantee a stellar end-user experience when lots of engineers are constantly pushing and deploying code?" Solid, easy-to-write, and clearly defined monitoring practices are the only answer to this question.
Mastering Kubernetes Pod Restarts with kubectl
Managing containerized applications efficiently in the dynamic realm of Kubernetes is essential for smooth deployments and optimal performance. Kubernetes empowers us with powerful orchestration capabilities, enabling seamless scaling and deployment of applications. However, in real-world scenarios, there are situations that necessitate the restarting of Pods, whether to apply configuration changes, recover from failures, or address misbehaving applications.
Troubleshooting Wi-Fi Issues for Hybrid Workers: Key Requirements for NetOps Teams
In recent years, employees have grown increasingly accustomed to the untethered connectivity of Wi-Fi. For many, the days of having a computer tethered to an ethernet cable can seem like a distant memory. That was true when employees were working in an office, and it is all the more the case as we’ve moved to a hybrid work world.
Monitoring Redis Clusters with Prometheus
This article will outline what Redis database monitoring is and how to set up a Redis database monitoring system with MetricFire. Then we’ll show what the final graphs and dashboards look like when displayed on Grafana. We will be using Prometheus and Grafana to power the monitoring, and we'll use a simulated Redis DB to generate the data for the Grafana dashboards.
I am so tired of Google Analytics
#Shorts Tired of the new Google Analytics interface? Frustrated with building reports from scratch? Join me as I introduce Request Metrics, a game-changing analytics tool that provides ready-made answers without the headache of DIY reports. Say goodbye to the analytics struggle and hello to simplified data analysis.
Modeling and Unifying DevOps Data
13 Best Cloud Cost Management Tools in 2023
Businesses are increasingly turning to cloud computing to drive innovation, scalability, and cost efficiencies. For many, managing cloud costs becomes a complex and daunting task, especially as organizations scale their cloud infrastructure and workloads. In turn, cloud cost management tools can help teams gain better visibility, control, and cost optimization of their cloud spending. These tools not only provide comprehensive solutions to track and analyze, they also optimize cloud expenses.
IDC Market Perspective published on the Elastic AI Assistant
IDC published a Market Perspective report discussing implementations to leverage Generative AI. The report calls out the Elastic AI Assistant, its value, and the functionality it provides. Of the various AI Assistants launched across the industry, many of them have not been made available to the broader practitioner ecosystem and therefore have not been tested. With Elastic AI Assistant, we’ve scaled out of that trend to provide working capabilities now.
Cloud Observability: Unlocking Performance, Cost, and Security in Your Environment
A robust observability strategy forms the backbone of a successful cloud environment. By understanding cloud observability and its benefits, businesses gain the ability to closely monitor and comprehend the health and performance of various systems, applications, and services in use. This becomes particularly critical in the context of cloud computing. The resources and services are hosted in the cloud and accessed through different tools and interfaces.
Creating a Location Based Business Service
Elastic APM - Automatic .NET Instrumentation with OpenTelemetry
SOLD IN 6 SECONDS: Formulas to Fast & Friction-Free E-commerce
Managing Prometheus cardinality in Grafana Cloud: Adaptive Metrics FAQ
One of the most talked about topics in observability today is centered around the question of how to get more value out of the ever-increasing amount of data collected by agents, collectors, scrapers, and the like. Back in May, we announced Adaptive Metrics, a new feature in Grafana Cloud that allows you to reduce the cardinality of Prometheus metrics and the overall volume and costs of your metrics.
Creating budgets and budget alerts in Google Cloud #FinOps
How to monitor connector's API Connections in Logic Apps?
4 Node.js Logging libraries which make sophisticated logging simpler
How Cribl Drives Your Business Strategy Forward | Cribl Overview Video
Coralogix Deep Dive - Alerts on the Coralogix Platform
Rethinking Observability with MinIO and CloudFabrix
Load Testing vs. Performance Testing vs. Stress Testing
Just conducting one type of testing is generally not enough. For example, let’s say you decide to perform unit testing only. However, unit tests only verify business logic. Many other types of tests exist to verify the integration between components, such as integration tests. But what if you want to measure the maximum performance of your application? Or what if you want to know how the application behaves under extreme stress?
Monitoring Digital Ocean with MetricFire
Cloud monitoring is like a health check-up for our online spaces. It tells us what's going well and what we need to improve. It is critical because it lets us fix problems before they get too big and helps our online services work at their best. This article talks about how we can use MetricFire to monitor DigitalOcean environments.
What are Traceroutes and How Do Traceroutes Work?
If you've ever wondered why your Internet connection seems slow or experiencing connection problems with a website, you might have heard of a tool called "traceroute." But what is a traceroute, and how does it work? In this article, we'll be giving a quick and simple introduction to what are traceroutes, and how traceroutes work to help identify and troubleshoot network problems.
The First 48 Hours of Ransomware Incident Response
Traces vs Spans
In the context of application performance monitoring (APM) and observability, traces and spans are fundamental concepts that help users to track and understand the flow of requests and operations within a system. They are essential in assisting users to identify bottlenecks, troubleshoot issues, and optimize application performance.
Benefits of using AIOps in ITSM
“Necessity is the mother of invention,” so here is a quick backstory to understand what brought AIOps into the ITSM landscape In the fast-paced world of Information Technology Service Management (ITSM), staying ahead of challenges and effectively managing complex systems is crucial. As organizations embrace digital transformation and adopt cutting-edge technologies, the volume of data and incidents generated becomes overwhelming for IT teams to handle manually.
The Quixotic Expedition Into the Vastness of Edge Logs, Part 2: How to Use Cribl Search for Intrusion Detection
For today’s IT and security professionals, threats come in many forms – from external actors attempting to breach your network defenses, to internal threats like rogue employees or insecure configurations. These threats, if left undetected, can lead to serious consequences such as data loss, system downtime, and reputational damage. However, detecting these threats can be challenging, due to the sheer volume and complexity of data generated by today’s IT systems.
IoT Dashboards with Grafana and Prometheus
The Internet of Things (IoT) - is a number of physical devices connected to one network that enables the system to interact with the external world. A great deal of the work surrounding IoT is monitoring, as it’s impossible to react without knowing the situation. For example, we might build a greenhouse system for agriculture that can maintain optimal conditions for growing crops. For this purpose, we need to have sensors picking up information about the temperature and humidity.
Integrating BindPlane Into Your Splunk Environment Part 2
How to Manually Instrument .NET Applications with OpenTelemetry
How to get started with Grafana and Docker (Grafana Office Hours #07)
Coralogix HATES Vendor Lock In
Structured logging best practices
Top tips: AI fatigue is a thing-navigating through AI challenges
Top tips is a weekly column where we highlight what’s trending in the tech world today and list out ways to explore these trends. This week we take a look at the effect of AI-related over-saturation and show you four ways to work around it.
Getting started with AWS CloudWatch
Out of more than 100 services that Amazon Web Services (AWS) provides, Amazon CloudWatch was one of the earliest services provided by AWS. CloudWatch was announced on May 17th, 2009, and it was the 7th service released after S3, SQS, SimpleDB, EBS, EC2, and EMR. AWS CloudWatch is a suite of tools that encompasses a wide range of cloud resources, including collecting logs and metrics; monitoring; visualization and alerting; and automated action in response to operational health changes.
Introducing Personalized Service Health: Upleveling incident response communications
Personalized Service Health sends custom granular alerts about Google Cloud service disruptions, and integrates with incident management tooling.
Dashboard Stories: High-level Jira ticket summary
Dashboard Stories: A unified view of NSW snowboarding conditions
Introducing: The Support Center
The Knowledge Base has had an upgrade, introducing our new Support Center! The Support Center is packed with tonnes of useful information to help you make the most of the RapidSpike platform.
Troubleshooting ECS Container Crashes
Amazon Elastic Container Service (ECS) is a versatile platform that enables developers to build scalable and resilient applications using containers. However, containerized services, like Node.js applications, may face challenges like memory leaks, which can result in container crashes. In this blog post, we’ll delve into the process of identifying and addressing memory leaks in Node.js containers running on ECS. First, let’s look closer at what a memory leak is.
Send your logs to multiple destinations with Datadog's managed Log Pipelines and Observability Pipelines
As your infrastructure and applications scale, so does the volume of your observability data. Managing a growing suite of tooling while balancing the need to mitigate costs, avoid vendor lock-in, and maintain data quality across an organization is becoming increasingly complex. With a variety of installed agents, log forwarders, and storage tools, the mechanisms you use to collect, transform, and route data should be able to evolve and adjust to your growth and meet the unique needs of your team.
Integration roundup: Monitoring your AI stack
Integrating AI, including large language models (LLMs), into your applications enables you to build powerful tools for data analysis, intelligent search, and text and image generation. There are a number of tools you can use to leverage AI and scale it according to your business needs, with specialized technologies such as vector databases, development platforms, and discrete GPUs being necessary to run many models. As a result, optimizing your system for AI often leads to upgrading your entire stack.
Enhance code reliability with Datadog Quality Gates
Maintaining the quality of your code becomes increasingly difficult as your organization grows. Engineering teams need to release code quickly while still finding a way to enforce best practices, catch security vulnerabilities, and prevent flaky tests. To address this challenge, Datadog is pleased to introduce Quality Gates, a feature that automatically halts code merges when they fail to satisfy your configured quality checks.
Store and analyze high-volume logs efficiently with Flex Logs
The volume of logs that organizations collect from all over their systems is growing exponentially. Sources range from distributed infrastructure to data pipelines and APIs, and different types of logs demand different treatment. As a result, logs have become increasingly difficult to manage. Organizations must reconcile conflicting needs for long-term retention, rapid access, and cost-effective storage.
DASH 2023: Guide to Datadog's newest announcements
This year at DASH, we announced new products and features that enable your teams to get complete visibility into their AI ecosystem, utilize LLM for efficient troubleshooting, take full control of petabytes of observability data, optimize cloud costs, and more. With Datadog’s new AI integrations, you can easily monitor every layer of your AI stack. And Bits AI, our new DevOps copilot, helps speed up the detection and resolution of issues across your environment.
Introducing Bits AI, your new DevOps copilot
Business-critical infrastructure and services generate massive volumes of observability data from many disparate sources. It can be challenging to synthesize all this data to gain actionable insights for detecting and remediating issues—particularly in the heat of incident response.
Leveraging Git for Cribl Stream Config: A Backup and Tracking Solution
Having your Cribl Stream instance connected to a remote git repo is a great way to have a backup of the cribl config. It also allows for easy tracking and viewing of all Cribl Stream config changes for improved accountability and auditing. Our Goal: Get Cribl configured with a remote Git repo and also configured with git signed commits. Git signed commits are a way of using cryptography to digitally add a signature to git commits.
Google and Goliath - An Ideal Match
The rise of ChromeOS has been a significant development in the world of technology, particularly in the enterprise world. As an IT professional, I have witnessed firsthand how businesses have shifted their approach towards technology to boost productivity and efficiency. ChromeOS has emerged as a cloud-based operating system that is gaining popularity due to its simplicity, affordability, and security features.
New in Grafana 10: Grafana Scenes for building dynamic dashboarding experiences
With Grafana 10, the latest major release of our data visualization platform, we wanted to explore new ways to empower our developer community. Case in point: Grafana Scenes, a new frontend library that enables developers to create dashboard-like experiences — such as querying and transformations, dynamic panel rendering, and time ranges — directly within their Grafana application plugins.
7 OpenTelemetry Metrics to Track for Better Visibility
In today’s rapidly evolving software landscape, ensuring observability is crucial for building robust and reliable applications. One of the critical components of observability is metrics, which provide valuable insights into the performance and behavior of our systems. OpenTelemetry, an open-source observability framework, offers a standardized approach to capturing, exporting, and analyzing metrics. This blog post explores seven OpenTelemetry metrics for tracking better visibility.
Anything But Tech Debt
Tech debt is usually one of the most fraught topics on engineering teams. Engineers often feel they aren’t allowed enough time to address tech debt. Product partners wonder why engineers spend so much time working on it—or at least talking about it. “The business” always seems to insinuate that engineers should do less of it, instead focusing on shipping value to customers.
BindPlane Agent Resiliency
Automatic log level detection reduces your cognitive load to identify anomalies at 3 am
Using UX and Observability to Track Application Health
Have you transitioned to GA4 Yet?
Stopping Agents and modules during a time interval
What is Garbage Collection in Java: Detailed Guide
The Garbage Collection (GC) feature in the Java Virtual Machine (JVM) is truly remarkable. It automatically identifies and cleans up unused Java objects without burdening developers with manual allocation and deallocation of memory. As an SRE or Java Administrator you need a strong understanding of the Java Garbage Collection mechanism to ensure optimal performance and stability of your Java applications.
3 Ways to Lower Costs and Improve Efficiency This Year and Every Year
The second half of 2023 is officially in full swing, and with that comes everyone’s favorite topic of conversation; end of year fiscal targets and annual budget reviews. For IT teams, the perennial ask will come down from above…. “we need to find $X, what can we cut, where can we find efficiencies and how much can your department save?”. You need to figure out how to save money and improve efficiency – and you don’t have much time to do it.
Revolutionizing call center management: The power of Full-Stack Observability with UCCE/PCCE
Full-stack observability with Cisco AppDynamics revolutionizes call center management, optimizing performance, improving customer experience and driving business success. Full-stack observability has revolutionized call center management by integrating Cisco AppDynamics into Cisco Unified Contact Center Enterprise (UCCE). Let’s explore the value of UCCE monitoring and its ability to deliver exceptional customer experiences.
How Technology Solutions Safeguard Your Domain from Content Thieves
Cloud Provider Uptime Monitoring: July 2023 Insights
Check our July 2023 health report on the top most popular cloud providers. We analyze the health of the cloud providers based on the number of outages and problems during the month. The source of the data is made available by the cloud providers themselves via their status page. We normalize it and use it to generate the report.
How to save on container costs efficiently using Kubernetes cost reporting in CloudSpend
Kubernetes reports in CloudSpend In the current era focused on cloud computing, it is essential for businesses to streamline costs. As containerization and Kubernetes become increasingly popular, efficiently managing costs related to Amazon Elastic Kubernetes Service (EKS) and Azure Kubernetes Service (AKS) is crucial for maintaining a successful infrastructure.
Cloud connectivity and interoperability
The post-pandemic world has transformed our work habits and the landscape of conducting business. Organizations now take the hybrid approach to work, wherein employees may work from an office, while travelling, or from a remote location. This fundamental shift has accelerated the pace of cloud adoption, as the cloud makes data access possible from anyplace, anytime. But the cloud brings with it a set of complexities that must be managed.
Using Grafana and Graphite to monitor server load
Since server outages can lead to a loss of customers, reputation, and other troubles and it is important to get information on the status of the server on time. MetricFire's Hosted Grafana and Graphite will help you monitor server load in a timely and efficient manner. Servers generate a large number of metrics and it is essential to not only track their values but also to observe their changes over time. There is also a possibility to correlate app statistics with server load metrics.
What Is APM and How Can It Help Your Services/Applications?
APM is one of those buzzwords that is slowly becoming a necessity. Most people are still unsure what APM means and how it can help their services. But what is it? What does it stand for? And how can it help your services or digital products? This blog will answer your questions—and more.
How we use trace-based alerts to reduce MTTR
On-call shifts are part of every developer’s job – we’ve all been there. It’s 3am, suddenly you get an alert for an issue occurring in production. The microservices landscape is complicated and finding the root cause of an issue is like looking for a needle in a haystack. How can you get to the root of what’s happening in the system so you can analyze and resolve the issue quickly and effectively?
Grafana Tempo 2.2 release: TraceQL structural operators are here!
Get excited about Grafana Tempo 2.2! Not only is this release on time, but it is also chock full of TraceQL features and performance improvements. I was honestly a little shocked by how much we have accomplished in the last three months when summarizing the changelog.
Mapping hostnames to locations with Icinga Director
Recently I came across the Maps module build and maintained by our community. The module displays host objects and annotations on openstreetmap using the JavaScript library leaflet.js. The module reads the coordinates for each host from custom variables and is able to group multiple hosts on the same location. There is already a guide on our blog that describes how you can use the module with human readable locations instead of numeric geolocations.
How to Tackle Spiraling Observability Costs
As today’s businesses increasingly rely on their digital services to drive revenue, the tolerance for software bugs, slow web experiences, crashed apps, and other digital service interruptions is next to zero. Developers and engineers bear the immense burden of quickly resolving production issues before they impact customer experience.
Optimize Equipment with Data-Driven Analytics
We want machines in good working order, making products of superior quality. This isn’t news. But what is newsworthy is that routine maintenance can still lead to more downtime than necessary. Not all maintenance programs are created equally. Keeping capital equipment running doesn’t exist inside a vacuum of chance. Outside the fraction of unavoidable catastrophes, there’s much power in the decision-making process.
Crafting Prompt Sandwiches for Generative AI
Large Language Models (LLMs) can give notoriously inconsistent responses when asked the same question multiple times. For example, if you ask for help writing an Elasticsearch query, sometimes the generated query may be wrapped by an API call, even though we didn’t ask for it. This sometimes subtle, other times dramatic variability adds complexity when integrating generative AI into analyst workflows that expect specifically-formatted responses, like queries.
Azure Distributed Transaction Performance Monitoring
Dive Deeper into your Trace and Logs Data with Query Builder - Community Call Aug 1
What is AWS Lambda, and How Does it Work with CloudWatch?
Kubernetes Troubleshooting Reimagined: Operators and Auto-Tracing
Introducing our free Hobby plan
Golang Monitoring using OpenTelemetry
OpManager celebrates Top Rated accolade from TrustRadius!
We believe that our customers’ satisfaction speaks volumes about the value we deliver. That’s why we’re absolutely thrilled to share the news: ManageEngine OpManager has been honored with the 2023 Top Rated Award in five categories by TrustRadius. TrustRadius is a trusted review site for business technology, supporting both buyers and vendors in making informed product decisions through unbiased and insightful reviews.
AIOps And Supercloud Adoption
Best Practices for SaaS and Network Incident Management
Computer and network systems have (obviously) become vital to business operations. Occasionally, there are SaaS or network incidents and these systems do not operate as needed. Enterprises want to minimize the potential damage and get their systems back online ASAP. Integrated incident management and a strong End User Experience Management (EUEM) platform that provides synthetic and real-user monitoring is a foundation for meeting that objective.
Best practices for tracing and debugging microservices
Tracing and debugging microservices is one of the biggest challenges this popular software development architecture comes with - probably the most difficult one. Due to the distributed architecture, it's not as straightforward as debugging traditional monolithic applications. Instead of using direct debugging methods, you'll need to rely on logging and monitoring tools, coding practices, specific databases, and other indirect solutions to successfully debug microservices.
3 Reasons to Prioritize Observability as part of Application Integration Strategy
Most companies in today's business landscape that deal with large amounts of data want to integrate their applications so that they can pass data between them seamlessly and easily. Being able to ensure that you can see exactly what is happening at every stage of the process is key, and this is where approaching the process with observability in mind can make a real difference. Deciding at the outset that observability is something that you want to be baked into the process means that you can plan and execute with that in mind.
Monitor gRPC calls with OpenTelemetry - explained with a Golang example
Implementing Distributed Tracing in a Golang application
Ensuring a reliable end-user experience with synthetic monitoring
Synthetic monitoring in Cloud Monitoring lets you test the availability, consistency, and performance of your web applications from the perspective of a real user.
Empowering AIOps With Zenoss Smart View: Unleashing the Power of Intelligent Diagnostics
Save money on Serverless: common costly mistakes and how to avoid them
When used properly, serverless technologies like AWS Lambda can lower the cost of running a system. This is because you only pay for these services when you’re using them, so you don’t waste any money. Serverless technologies also have other benefits. They can provide better security, built-in redundancy and scalability. The biggest plus is that they let you do more with less time and effort. You can focus on the things that directly add value to your business.
New Logs Explorer & Query Builder
Cisco completes Cisco AppDynamics and Cisco Secure Application IRAP assessment
Learn why IRAP recognition at the PROTECTED level for Cisco AppDynamics and Cisco Secure Application enables end users to rest assured their applications are secure. Cisco has completed an Infosec Registered Assessors Program (IRAP) assessment of Cisco AppDynamics and Cisco Secure Application at the PROTECTED level. This milestone represents a crucial step in reaffirming Cisco’s commitment to its Australian public sector customers, including its industry partners.
DynamoDB: Maximizing Scale and Performance
AWS DynamoDB is a fully managed NoSQL database provided by Amazon Web Services. It is a fast and flexible database service which has been built for scale.
Aggregating Millions of Groups Fast in Apache Arrow DataFusion
Grouped aggregations are a core part of any analytic tool, creating understandable summaries of huge data volumes. Apache Arrow DataFusion’s parallel aggregation capability is 2-3x faster in version 28.0.0 for queries with a large number (10,000 or more) of groups.
Are you ready for DORA?
Not to be confused with the popular children’s TV character, DORA is a new EU regulation for the financial sector, which stands for the Digital Operational Resilience Act. DORA became law on 16 January 2023 and will start to apply from 17 January 2025, so it’s crucial that senior executives in the financial sector, such as Chief Risk Officers and Chief Information Security Officers, understand its implications and prepare for compliance from day one.
Icinga for Windows v1.11.0 - It's finally here!
Today we are happy to announce that after many delays, re-writes, pushbacks and restructuring Icinga for Windows v1.11.0 is finally released! First, we would like to thank everyone for contributing feedback over the past month to track down issues and testing new integrations.
End-to-End Citrix Monitoring, Diagnosis and Reporting with eG Enterprise
Grafana Cloud Free: Actual stories about our 'actually useful' hosted free tier
It’s no secret that anyone can download our open source software and run it, because — once more with feeling — open source is in our DNA. But it can be hard to set up and configure a whole stack from scratch, which is why we offer Grafana Cloud as a fully managed observability platform.
Prometheus Monitoring 101
Prometheus is an increasingly popular tool in the world of SREs and operational monitoring. Based on ideas from Google’s internal monitoring service (Borgmon), and with native support from services like Docker and Kubernetes, Prometheus is designed for a cloud-based, containerized world. As a result, it’s quite different from existing services like Graphite. Starting out, it can be tricky to know where to begin with the official Prometheus docs and the wave of recent Prom content.
Connecting Prometheus and Grafana
Using Prometheus and Grafana together is a great combination of tools for monitoring an infrastructure. In this article, we will discuss how Prometheus can be connected with Grafana and what makes Prometheus different from the rest of the tools in the market. MetricFire's product, Hosted Graphite, runs Graphite (a Prometheus alternative) with Grafana dashboards for you so you can have the reliability and ease of use that is hard to get while doing it in-house.
AWS CloudWatch Custom Metrics vs Prometheus Custom Metrics
Understanding the state of your systems and their underlying infrastructure at all times is paramount for ensuring the stability and reliability of your services. Up-to-date information about the performance and health of your deployments not only helps your team react to issues in real time, but it also gives them the security to make changes with confidence and to safely forecast system failures or performance hiccups even before they occur.
Monitoring Webapp Performance with Sitespeed
In today's digital landscape, optimal web application performance is crucial for business success. Slow loading times, unresponsive pages, and inefficient code can drive away users and harm your reputation. This makes monitoring web app performance extremely important to prevent them and to provide a smooth user experience. Sitespeed, a powerful web performance monitoring framework, analyzes metrics like page load time, resource usage, and user interactions to identify performance bottlenecks.
The Uphill Battle of Consolidating Security Platforms
A recently conducted survey of 51 CISOs and other security leaders a series of questions about the current demand for cybersecurity solutions, spending intentions, security posture strategies, tool preferences, and vendor consolidation expectations. While the report highlights the trends around platform consolidation over the short run, 82% of respondents stated they expect to increase the number of vendors in the next 2-3 years.
Automatic Instrumentation for OpenTelemetry Go
The OpenTelemetry Go project now supports automatic instrumentation via eBPF! This is a big milestone for the project and makes it significantly easier to generate data from your Go apps: The automatic instrumentation agent is still in s/alpha/beta today, but it’s ready for you to try on your applications!
Pump the Brakes: Some Key Considerations in Your Journey to AIOps
July Product Updates for Sentry
During the past month of July, the Sentry dev team dropped new capabilities to help you better understand, prioritize, and respond to errors and performance problems. From new ways of sorting priority issues to helping you be more proactive in identifying problems earlier in the dev lifecycle, we’ve picked a handful of recent releases to dive into. Plus we’ll highlight a couple of new integrations with our friends at Slack and Atlassian.
3 Steps to Get DX NetOps Events in Slack and Google Chat
Network operations centers (NOCs) play a critical role in any organization’s operational and business continuity. To meet their vital charters, NOC teams must constantly strive to maintain uninterrupted network availability and to minimize the business impact of network issues. Within the NOC, effective collaboration is essential for quick troubleshooting and resolution of network issues.
5 Things to Look for in a SaaS Management Platform and Why
Quickstart network investigations with NPM's story-centric UX
Datadog Network Performance Monitoring (NPM) gives you visibility into all the communication that takes place between the network components in your environment, including hosts, processes, containers, clusters, zones, regions, and VPCs. As organizations scale, and as their networks grow in complexity, the massive volume of network data to be monitored can become overwhelming. Knowing precisely what network data to surface to resolve issues within these larger environments can be a challenge.
Announcing Easy Connect - The Fastest Path to Full Observability
Logz.io is excited to announce Easy Connect, which will enable our customers to go from zero to full observability in minutes. By automating service discovery and application instrumentation, Easy Connect provides nearly instant visibility into any component in your Kubernetes-based environment – from your infrastructure to your applications. Since applications have been monitored, collecting logs, metrics, and traces have often been siloed and complex.
Query InfluxDB 3.0 Using JDBC Driver for Tableau
Getting Started: InfluxDB 3.0 Python Client
Enable and use GKE Control plane logs
Why we generate & collect logs: About the usability & cost of modern logging systems
Logs and log management have been around far longer than monitoring and it is easy to forget just how useful and essential they can be for modern observability. Most of you will know us for VictoriaMetrics, our open source time series database and monitoring solution. Metrics are our “thing”; but as engineers, we’ve had our fair share of frustrations in the past caused by modern logging systems that tend to create further complexity, rather than removing it.
Kubernetes Troubleshooting with Operators and Auto-Tracing
Kubernetes has revolutionized the way we manage and deploy applications, but as with any system, troubleshooting can often be a daunting task. Even with the multitude of features and services provided by Kubernetes, when something goes awry, the complexity can feel like finding a needle in a haystack. This is where Kubernetes Operators and Auto-Tracing come into play, aiming to simplify the troubleshooting process.
How Novacy Shortened Troubleshooting Time by 90% with Helios
When I first met Uria Franko, the CTO of Novacy, I immediately knew we’d hit it off. He was looking for an observability solution for his team with a specific need around Celery, after they had been using logs but found they lacked the depth and granularity they needed. Luckily, our mission at Helios is to help organizations gain visibility and drill down into services through traces. So this was a perfect match.


