Operations | Monitoring | ITSM | DevOps | Cloud

The Future of InfluxDB OSS: More Open, Permissive with Complementary Closed Source

I was recently on the Changelog Podcast talking about Elastic’s recent change away from open source licensing. I’m at 1:02:45 to 1:24:03, but the whole thing is pretty interesting if you have time to listen. This is where #InfluxDB is headed. No more open core, we're going to a combination of cloud offering, or if on-premise, a complementary offering to the open source. It'll take us time to get there, but that's the vision. Commercial complements the open source rather than replace.

Ruby and Python clients for Elastic Enterprise Search now generally available

Back in our 7.10 release of the Elastic Stack, we announced the beta of our Ruby and Python clients for Elastic Enterprise Search. Now, with 7.11, both the Ruby and Python clients are generally available. We’ve also begun work on a PHP client. All client source code for both enterprise-search-ruby and enterprise-search-python is available on GitHub. Documentation on how to get started with each client is available on elastic.co.

Streamline project management with advanced analytics for Jira Software

Managing projects isn’t an easy task, particularly if you’re managing parallel projects with inter-team dependencies. Lack of visibility coupled with difficulty in obtaining the right metrics on time can make it nearly impossible for project teams to track issues, action items, and risks, often resulting in projects running behind schedule, overshooting budgets, or worse, getting stalled due to unforeseen problems.

Monitoring DigitalOcean Billing with InfluxDB

I’ve always had a good experience using DigitalOcean, a cloud infrastructure provider which offers developers cloud services that help deploy and scale applications that run simultaneously on multiple computers. I’ve used DigitalOcean a lot for my personal projects — for example, to host my personal blog, its stats, and a NextCloud instance, all running in Kubernetes.

InfluxDB C Client Library for Capturing Statistics

Currently, there is no official InfluxDB C language client library. Fortunately, I wanted to do exactly that for capturing Operating System performance statistics for AIX and Linux. This data capturing tool is called “njmon” and is open source on Sourceforge. So having worked out how and developing a small library of 12 functions for my use to make saving data simple, I thought I would share it. I hope it will prove useful for others.

Testing the new Elasticsearch cold tier of searchable snapshots at scale

The cold tier of searchable snapshots, previously beta in Elasticsearch 7.10, is now generally available in Elasticsearch 7.11. This new data tier reduces your cluster storage by up to 50% over the warm tier while maintaining the same level of reliability and redundancy as your hot and warm tiers.

A Partnership Between InfluxData and Ockam Brings Trust to Time Series Data

This article is a re-post of the article written by Matthew Gregory and published on the Ockam blog. Let’s investigate how to build applications with trusted time series data in a zero trust environment! To trust an application we need to trust the data that feeds into it. Increasingly, applications rely on time series data from outside the datacenter, at the edge, or in IoT. This means we need to think of trust and data in new ways.

Advanced Link Analysis: Part 1 - Solving the Challenge of Information Density

Link Analysis is a data analysis approach used to discover relationships and connections between data elements and entities. This is a very visual and interactive technique that can be done in the Splunk platform – and is almost always driven by a person, an analyst or investigator, to understand the data and discover necessary insights specific to the business problem at hand.

Monitoring InfluxDB 2.0 in Production and at Scale

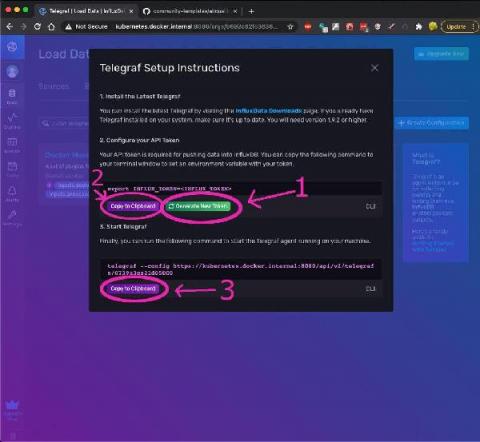
One of the great things about InfluxDB is that it is really easy to get up and running, and it doesn’t require much monitoring when you are dealing with datasets that fit well on your local dev machine. Once you start using InfluxDB in production and pushing orders of magnitude more data into the system, it’s critical to monitor how your instance is performing so that you can proactively respond to things like disk or network failures, memory saturation, and write or query loads.