Operations | Monitoring | ITSM | DevOps | Cloud

The latest News and Information on Log Management, Log Analytics and related technologies.

Manage Your Pino Logs with AppSignal

We're excited to announce that AppSignal now supports Pino logs, making managing and monitoring your logging data easier than ever. By sending Pino logs directly to AppSignal, you can consolidate all your data in one place, giving you a clear overview of your app's performance for faster troubleshooting. Importantly, AppSignal now also works with Fastify 5, making it a great choice for Fastify developers looking for an APM that integrates seamlessly with their stack.


Extended protections for cloud using CNCF open source security tools

In today's rapidly evolving cloud landscape, robust security measures are more critical than ever. At Elastic Security, we're excited to introduce our extended protections for cloud — a key component of our cloud detection and response (CDR) use case. This initiative seamlessly integrates open source security tools from the Cloud Native Computing Foundation (CNCF) ecosystem with Elastic Security's powerful analytics platform.

The Top 10 Prometheus Alternatives

Prometheus is an open-source monitoring solution, it offers efficient, scalable, and flexible monitoring practices and has emerged as a trusted tool for organizations seeking insights into their systems. It’s written in Go, gathers metrics data, and stores it in a time series database. Also, Prometheus employs a robust query language, PromQL, to manipulate and analyze collected time series data, offering versatile monitoring capabilities for various systems and services.

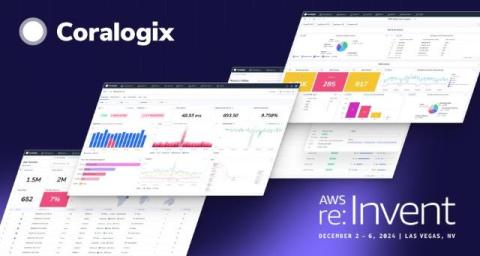
AWS re:Invent 2024: Discover the latest & greatest from Coralogix

As we gear up for AWS re:Invent this December, we’re excited to share some of the latest innovations that make our platform stand out. Coralogix continues to evolve with powerful new capabilities designed to simplify observability, improve performance monitoring, and deliver actionable insights across your systems. From advanced visualization tools to AI-powered troubleshooting, these updates reflect our commitment to empowering teams with smarter, faster ways to solve complex challenges.

The Ultimate Guide to AWS Logging: Tools, Types, and Techniques

AWS logs are fundamental for organizations to conduct performance analysis, troubleshooting, security monitoring, and adhere to compliance requirements. But if you’re using more than one AWS service you can quickly realize that your logs are expanding out of control across decentralized locations. Therefore it’s crucial that you can process and analyze all your AWS logs within a single centralized repository.

An Engineer's Guide to Making Sense of Log Data

In the webinar, the experts explained why a log management strategy is crucial if you want to accurately assess the health and compliance of your applications. Topics include: Cloud native technologies have made it harder to understand how systems are behaving. Logs are the answer, but they can be voluminous and complex in any environment. How do you make sense of them?

VictoriaMetrics Efficiently Simplifies Log Complexity with VictoriaLogs

Salt Lake City, Utah, 13th November 2024 – Today we’re delighted to announce the GA release of our innovative logging solution - VictoriaLogs. Our easy-to-use, open source log management solution combines a powerful query language for easy log searching with minimal resource requirements. It’s perfect for managing and analyzing large volumes of log data, especially in containerised environments such as Kubernetes.

Key Takeaways from the 2024 DORA Report

Google recently released its 2024 Cloud DORA (DevOps Research and Assessment) report, bringing together a decade’s worth of trends, insights, and best practices on what drives high performance in software delivery across industries of all sizes. This year’s findings take a closer look at how DevOps teams can achieve greater resilience and efficiency by adopting AI, improving team well-being, and building powerful internal platforms. ‍

Stop Guessing, Start Knowing: The Power of Integrated Logging and APM

‍ Let’s talk about something we’ve all experienced: a customer reports that their checkout process is “sometimes slow,” – or maybe you noticed an unexpected spike in response times. So, you dive into the logs, grep through thousands of lines, and try to match timestamps with your APM traces. Sound familiar? At Scout, we’ve seen countless engineering teams struggle with this disconnect between their logging and APM tools.