The latest News and Information on Log Management, Log Analytics and related technologies.
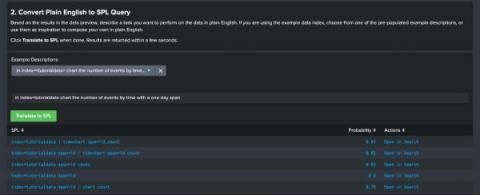
The Machine Learning team at Splunk has been hard at work over the last several months preparing for a few exciting launches at.conf22, held just a few weeks ago. Splunk customers want to leverage machine learning (ML) in their environments, but many aren’t sure how to use it, or even how to get started.
We announced Cribl Search in May, and customer reaction has been incredibly positive. We’ve heard for some time that organizations have data everywhere. They have data in their observability lakes, analytics tools, object stores, and at the edge. The big challenge facing enterprises is that existing search models require you to take all of this data that you don’t know is valuable or not, move it into one place, and then make decisions about whether this is valuable?
We are thrilled to announce that Mezmo has been recognized as one of the Top 20 Vendors for Managing IT Performance in 2022 by Digital Enterprise Journal (DEJ). This list was created in response to DEJ’s study, 24 Key Areas Shaping IT Performance Markets in 2022. DEJ analysts surveyed more than 3,300 organizations around a variety of topics to craft a comprehensive understanding of the state of these programs today.
Insights from the 2022 Results That Matter study Correlating data across multiple silos and applications to derive meaningful and actionable insights is an ongoing struggle. These challenges are only set to increase as high-speed connectivity becomes more ubiquitous and enables data-heavy, digital experiences.
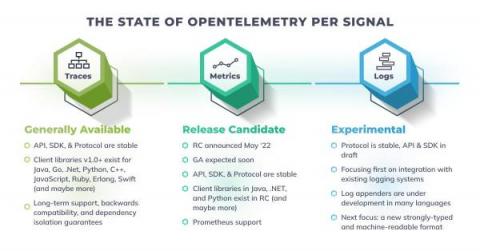
OpenTelemetry is one of the most fascinating and ambitious open source projects of this era. It’s currently the second most active project in the CNCF (the Cloud Native Computing Foundation), with only Kubernetes being more active. I was at KubeCon Europe last month, delivering a talk on OpenTelemetry and it was amazing to see the full house and the excitement and interest around the project.
Anomaly detection can be defined by data points or events that deviate away from its normal behavior. If you think of this in the context of time-series continuous datasets, the normal or expected value is going to be the baseline, and the limits around it represent the tolerance associated with the variance. If a new value deviates above or below these limits, then that data point can be considered anomalous.
Network performance monitoring (NPM) and application performance monitoring (APM) are both key pillars of an overall performance and reliability management strategy, especially when dealing with complex, distributed infrastructure across cloud-native environments. NPM and APM also complement each other, in the sense that NPM can serve as an additional source of truth and observability for application performance.
According to recent surveys and reports on the industry, Kubernetes and containers are more popular than ever. Containers and serverless functions are being mainstream and ubiquitous – with a more than 300% increase in container production usage in the past 5 years. This trend is especially true for large organizations, which are often using managed platforms and services.