|
By Anjali Udasi
Check out these straightforward tips to manage your metrics and logs better. You can keep your monitoring effective while cutting down on costs!
|
By Prathamesh Sonpatki
A comprehensive guide showing how to use PrometheusRemoteWriteExporter to send metrics from OpenTelemetry to Prometheus compatible backends.
|
By Prathamesh Sonpatki,
Get a clear understanding of log analytics—what it is, why it matters, and how it helps you keep your systems running efficiently by analyzing key data from your infrastructure.
|
By Anjali Udasi
Learn essential commands, examples, and best practices for using kubectl exec to troubleshoot and manage your Kubernetes applications.
|
By Prathamesh Sonpatki
Explore the logging spectrum from "Log Anything" chaos to "Log Everything" clarity. Learn structured logging best practices in Go using zap. Improve debugging, gain system insights, and boost your observability game.
|
By Anjali Udasi
Learn how to effectively monitor the OTEL Collector with best practices and implementation strategies for improved system performance.
|
By Anjali Udasi
Learn everything about Application Performance Monitoring (APM), from its definition to its crucial role in optimizing application performance.
|
By Prathamesh Sonpatki,
This guide walks you through setting up Docker monitoring using Prometheus and Grafana, helping you track container performance and resource usage with ease.
|
By Anjali Udasi
Synthetic monitoring empowers developers to stay ahead of potential problems by simulating real user actions. This guide breaks down how it works, its benefits, and how you can use it to keep your web applications and APIs performing at their best.
|
By Anjali Udasi
Explore practical methods for monitoring ephemeral storage metrics in Kubernetes to ensure efficient resource management and improve overall performance.
|
By Last9
Levitate is a high-cardinality monitoring tool and a telemetry data warehouse with support for metrics, events, logs, and traces. Prometheus and OpenTelemetry compatibility makes it easy to get started with a hassle-free monitoring journey, be it starting from scratch or even swapping out your existing monitoring tool. Used by engineering teams worldwide at companies like Replit, Disney+ Hotsar, Clevertap, Probo, Quickwork, Axio, and more.
|
By Last9
The most apt alert rules toolkit for your Prometheus setup. Connect your Prometheus setup. Discover components emitting metrics. Get recommendations of rules to be applied.
|
By Last9
Last9 Levitate’s integration with LaunchDarkly enables change intelligence with feature flag events. Visualize the feature flag events as Change Event annotations in Levitate to correlate system health.
|
By Last9
Last9 Levitate’s integration with LaunchDarkly enables change intelligence with feature flag events. Visualize the feature flag events as Change Event annotations in Levitate to correlate system health.
|
By Last9
Using template variables to insert dynamic values based on labels for use cases like detailed alert descriptions, routing links, etc.
|
By Last9
Are you using Prodvana.io for deployments? Send a change event to Levitate for every deployment from Prodvana.
|
By Last9
You have probably heard of OpenTelemetry in the context of traces. But did you know OpenTelemetry also supports metrics with a comprehensive, forward-looking data model and SDKs? When it comes to metrics, one thinks of Prometheus, but Otel metrics provide exciting ideas such as cumulative deltas, exponential histograms, and more! This talk will demystify everything about Otel Metrics, from the data model to APIs to how to get started. We will cover the differences between Otel Metrics and Prometheus and explain the reasons why people get excited about using Otel Metrics.
|
By Last9
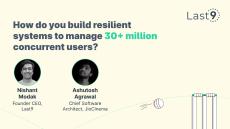
The Indian Premier League is a unique sporting event for a dozen reasons. But for engineers in India, it’s one of a kind. Very few companies can boast of managing 30+ million concurrent users. Every year, this number grows. Last year, we witnessed ~60 million concurrent users. And things get bigger and larger every year.
- October 2024 (11)
- September 2024 (24)
- August 2024 (11)
- July 2024 (4)
- June 2024 (9)
- May 2024 (2)
- April 2024 (2)
- March 2024 (3)
- February 2024 (2)
- January 2024 (4)
- December 2023 (6)
- November 2023 (11)
- October 2023 (24)
- September 2023 (5)
- August 2023 (8)
- July 2023 (13)
- June 2023 (10)
- May 2023 (11)
- April 2023 (3)
- March 2023 (4)
- February 2023 (1)
- January 2023 (2)
- December 2022 (1)
- November 2022 (1)
- February 2022 (1)
Last9 provides tools to improve Reliability in large-scale cloud-native environments.
Our open-standards-based tools provide visibility into the Rube Goldberg of micro-services. We take away the toil of managing a time series database by dramatically reducing your costs and improving developer productivity.
Levitate is our time series metrics & events warehouse designed for scale and high cardinality. Our warehousing capabilities provide necessary control levers to ensure cost-efficient data growth management, surpassing traditional storage solutions.
Start your observability journey today with Levitate. A Managed Time Series Data Warehouse that SREs trust.


