Operations | Monitoring | ITSM | DevOps | Cloud

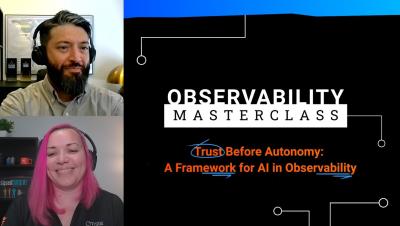
Observability Masterclass | Trust Before Autonomy: A Framework for AI in Observability

How to Prepare for Human-in-the-Loop AI in Observability AI is rapidly reshaping IT operations, but pushing forward blindly introduces massive risks. To scale automation safely, your teams need the right foundation in place. Join SolarWinds experts for a tactical session on how to strengthen data quality, eliminate tool fragmentation, and establish clear governance guardrails. Discover how to confidently transition from human-managed workflows to safe, guided AI autonomy.
Fin's CTO on Building Great Engineering Organizations in the AI Era

A few months ago, Darragh Curran, CTO at Fin (formerly Intercom) set a public goal to double engineering productivity and nearly tripled it instead. They did so by pulling a few levers: AI writing code at scale, building an AI-driven PR review system, leveraging observability as a trust mechanism, and with leadership becoming more hands-on through the transition.

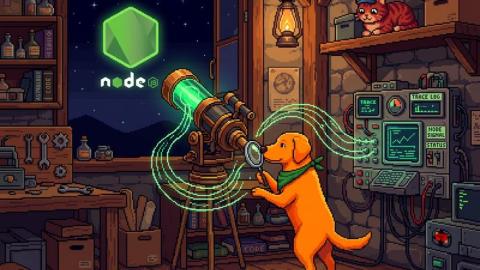
NestJS v12 Ships Native Observability: What It Means for Your APM

NestJS 12 dropped last week with ESM packages, Standard Schema validation, a rebuilt CLI, and a brand-new observability SDK. That last one is the most interesting part for anyone running NestJS in production with an APM tool. At Scout Monitoring, we instrument NestJS applications through our Node.js agent. A framework shipping its own observability layer changes the conversation for every APM vendor in the ecosystem, including us. Here is what you need to know.

Cribl On Your Coffee Break Episode 1

In this first episode (or at least the first REAL episode, yesterday’s “episode 0” doesn’t count) of Cribl on your coffee break, Leon does what we all do when we unwrap a shiny new data, telemetry, observability, or monitoring tool: He takes the shortest path to jamming some data into that thing and seeing what it looks like. Is it sophisticated? Nuanced? Well-thought-out? Hell no! But it scratches an itch. There will be time to do more real-world stuff tomorrow.

Introducing APEX: Adversarial Pattern Extraction and Correlation

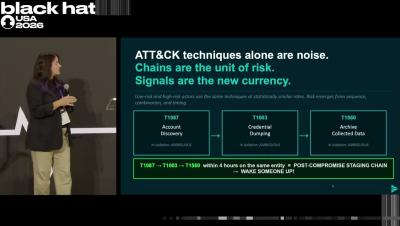
In this Black Hat talk, Nicole Beckwith introduces APEX (Adversarial Pattern Extraction and Correlation), a detection framework—not a Cribl product—that clusters TTP-based signals around entities to support behavioral detection. It is intended for security practitioners, SOC and detection teams, and threat hunters who want to learn how to use raw telemetry or OCSF data, TTP chaining, time windows, criticality, and cross-correlation to detect behavior beyond static indicators and rule-count coverage.

Your Observability Stack Found the Fire. Congratulations.

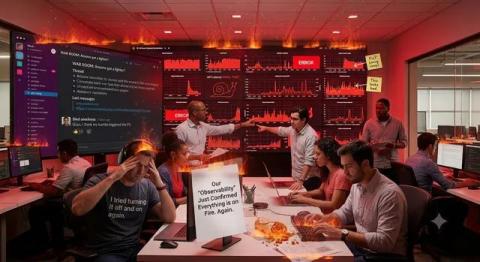
The dashboards are red, the alerts are firing, and Slack has officially become a war room. Someone has asked, “Anyone else seeing this?” and 14 people have immediately responded with screenshots. Welcome to another day in distributed systems. The recent GitHub outage is a great reminder of how complicated modern applications have become. Services talk to services, infrastructure scales up and down, retries multiply traffic, and dependencies behave in ways nobody expected.

How to measure and improve instrumentation quality for better full-stack observability

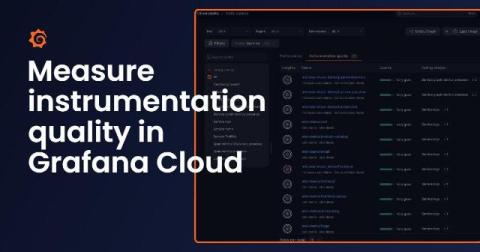
Modern engineering teams instrument everything, with metrics, logs, traces, and profiles flowing from hundreds of services at once. But full-stack observability isn’t really about collecting more telemetry; it's about having a single, unified picture of how your services connect to every layer beneath them, including their dependencies, the pods and nodes they run on, and the logs, traces, and profiles that explain their behavior.

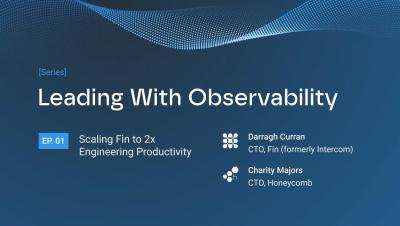
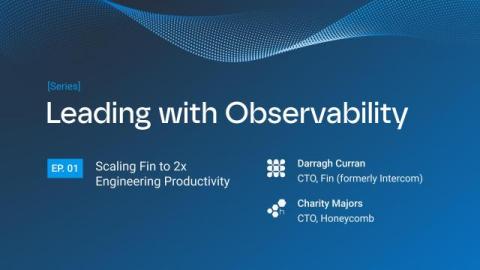
Leading With Observability: Scaling Fin to 2x Engineering Productivity

A few months ago, Darragh Curran, CTO at Fin (formerly Intercom) set a public goal to double productivity and nearly tripled it instead. They did so by pulling a few levers: AI writing code at scale, building an AI-driven PR review system, leveraging as a trust mechanism, and with leadership becoming more hands-on through the transition. Charity wanted to pick Darragh’s brain on the messy bits, not just the highlight reel, so she invited him to participate in our first episode of Leading With Observability.

Observability for AI-Generated Code: Bridging the New Governance Gap

We are witnessing the fastest expansion of the software development lifecycle in history. Generative AI tools have turned every developer into a hyper-productive builder, and in some cases, turned non-technical team members into creators of production-bound services. But this speed comes with a hidden cost. When the volume of code grows exponentially, the surface area for failure grows with it. The real challenge of modern software engineering is not Day 1 code generation; it is Day 2 operations.

Why AI Agent Orchestration Needs Runtime Context Between Agents

Every multi-agent system depends on one agent handing its output to the next, and nothing in the architecture confirms that the handoff carried what it should have. Orchestration adds a failure surface that single-agent architecture doesn’t have: a point between every two agents where one has to trust that the other passed along everything it needed, unverified.

AI Norms & Values, Part 1 of 3: How We Do Business at Honeycomb

It's been almost exactly one year since we issued our AI mandate here at Honeycomb, and we've been doing some reflection. When we issued our mandate, it's not like we hadn't been using AI. We were the first in the industry to bake a feature powered by AI into our product, way back in May of 2024. Many of us had been experimenting and using these tools in our spare time. But we believe that software is the killer app for AI.

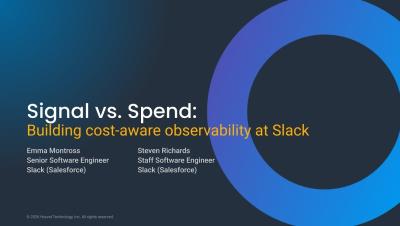
Signal vs. Spend: Building Cost-Aware Observability at Slack - O11yCon 2026

It started with a single log line taking up a massive amount of volume: 500 million emissions per hour. Pulling that thread led Emma and Steven into Slack's broader logging pipeline: 311 billion logs per day at 4.4M/sec peak, with no volume limits, no per-service attribution, and no feedback to the teams generating the noise.

Why AI Agent Architecture Needs a Runtime Context Layer

Every AI agent architecture diagram shows the same five layers: perception, memory, reasoning, action, and feedback. Each layer assumes the one before it worked correctly, and none of them can confirm that once the agent runs against live production data. Runtime context is the sixth layer most designs leave out, and it’s the one that decides whether any of the other five can be trusted.

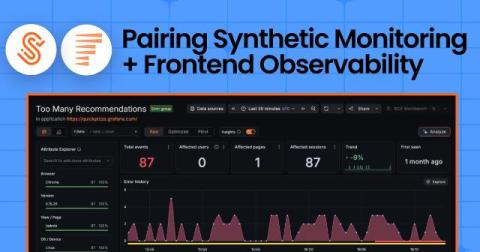
From failed check to real user impact: Pairing Synthetic Monitoring and Frontend Observability in Grafana Cloud

Say you get a support escalation about a page in the app that won’t load. But when you pull up your synthetic checks, they're all green: 100% uptime, probes are passing. Something's not adding up, but which one do you trust? If you’ve run Grafana Cloud Synthetic Monitoring, you’ve been on both sides of this. Sometimes it's the ticket: real users hit a wall on the path but your checks pass cleanly. Other times, it’s the inverse.

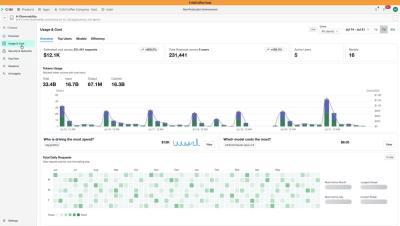
7 lessons for IT leaders on using observability to monitor AI applications

What it takes to prove AI value with LLM observability Over six months, the Elastic IT team ran internal AI applications that returned $2.5 million in operational time to the business.1 A conversational support assistant moved us from zero digital resolution, where anything complex became a ticket, to 30% of support interactions closing without one.

On Release Days We Wear Teal for release 4.19.1

In this episode, Leon explores some of the new features, functions, updates, and improvements in release 4.19.1, which includes private links, setting a region per workspace, choosing a release channel per workspace, and a look at Output Routers, an incredibly useful (but unfortunately under-loved) feature that’s been around for a hot minute.

How I Support Humans in the AI Era

When our company pushed everyone to start using AI tools, I thought about what it would mean for my team. As a remote company, we are already challenged by the lack of organic human connection. Every connection is planned and takes effort, and now, AI adds another layer. People now spend part of their day collaborating with a tool rather than with a person, which can take away from the time we spend learning from each other.

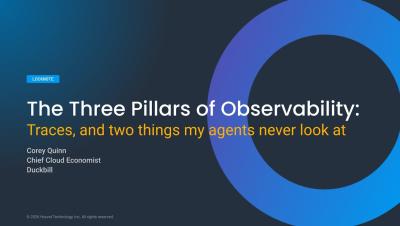
The Three Pillars of Observability: Traces, and Two Things My Agents Never Look At - O11yCon 2026

'The runbook lost. The trace is the documentation now.' In his O11yCon 2026 closing keynote, Corey Quinn of Duckbill Group makes the case that when your primary reader is an, not a person, are the only pillar built to survive.

Observability's Sixth Sense: Grounding Anomaly Detection in Reality

Summary: Machine learning-based anomaly detection improves observability by learning normal system behavior instead of relying only on static thresholds. This article explains how vmanomaly, its MCP server, purpose-built skills, and an LLM-powered UI copilot help engineers explore telemetry, investigate anomalies, build MetricsQL queries, select suitable models, apply business constraints, and validate configurations through natural language.

AI Model Drift: How to Keep Models Reliable

AI model drift is when an AI system's performance and accuracy degrades over time because the data, user behavior, or business environment has changed since the model was trained or evaluated. Even if latency, uptime, and infrastructure metrics remain healthy, model quality can quietly decline, leading to less accurate predictions, inconsistent responses, and reduced user trust.

Introducing AI BubbleUp

BubbleUp has always been the fastest way to figure out what a group of outliers have in common. Draw a box around a band of slow traces, a cluster of errors, or any set of events you're interested in, and BubbleUp compares that selection to the baseline across every dimension you've sent us. It's how Honeycomb users find the "unknown unknowns" that dashboards can’t show you.

DevOps and CI/CD Practices for Scaling Mobile App Backends in Fintech

Fintech mobile applications operate in an environment where performance, reliability, and security are equally important. A slow payment request, an API outage, or a failed deployment can affect thousands of transactions and quickly undermine customer trust. As a product grows, its backend must handle rising traffic without sacrificing stability.

Signal vs. Spend: Building Cost-Aware Observability at Slack - O11yCon 2026

It started with a single log line taking up a massive amount of volume: 500 million emissions per hour. Pulling that thread led Emma and Steven into Slack's broader logging pipeline: 311 billion logs per day at 4.4M/sec peak, with no volume limits, no per-service attribution, and no feedback to the teams generating the noise.

Building an AI Observability Agent: Lessons from the Trenches - Stripe at O11yCon 2026

Stripe shares lessons from building an incident investigation agent, from context-window blowups to why the final 5% still needs a human. In this O11yCon 2026 talk, they dig into what it takes to go from 'it works' to 'it works reliably,' including how pointing agents at like Honeycomb's speeds up on-call investigations.

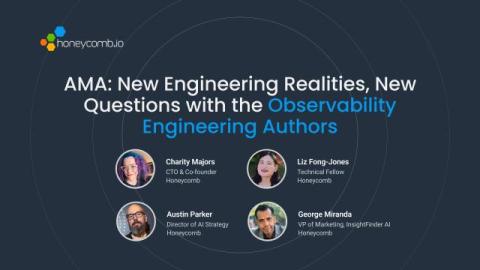
AMA Recap: More Answers From the Observability Engineering Authors

Last week, we sat down with the authors of Observability Engineering for a live AMA. We ended up getting so many questions (pre-submitted and live) that we couldn't get through them all. Charity, Liz, George, and Austin kindly stuck around afterward to answer more, ranging from low-hanging observability fruits and telemetry to AI and what software engineers can do that Claude can't. Missed the live session? Watch it on demand now.

Running LLM Workloads in Production: An Operations Playbook for Teams That Did Not Sign Up for This

Somewhere in the past two years, AI quietly became an operations problem. The proof of concept your product team shipped - a support-ticket summarizer, a natural-language search box, a code-review assistant - graduated into a production dependency, and now it pages you. The failure modes are unfamiliar: latency distributions with tails measured in tens of seconds, upstream providers that throttle without warning, costs that scale with user enthusiasm rather than infrastructure size, and outputs that can be wrong in ways a health check will never catch.

Spend More Time Talking to Humans

A few months ago, I noticed something happening. I would spend all day working with LLMs—prompting them, reviewing their work, and correcting them—and when I wasn’t working on my own code, I was reviewing LLM-generated code. By the end of the day, I was exhausted. This was a very unusual thing for me: I’ve been a software developer at startups for 30 years, and while sometimes I might have gotten stressed out, I had never been exhausted by the actual act of writing code.

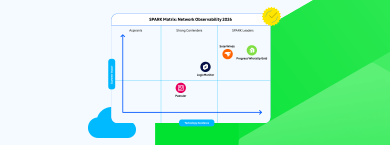
Progress WhatsUp Gold Recognized as a SPARK Matrix Leader in Network Observability

We’re proud to share that the Progress WhatsUp Gold solution has been recognized as a Leader in the QKS Group SPARK Matrix: Network Observability report, ahead of other vendors such as SolarWinds, Paessler PRTG and LogicMonitor to name a few. The recognition highlights the WhatsUp Gold network monitoring capabilities that help organizations gain deeper visibility into complex network environments while delivering impactful benefits for customers.