Operations | Monitoring | ITSM | DevOps | Cloud

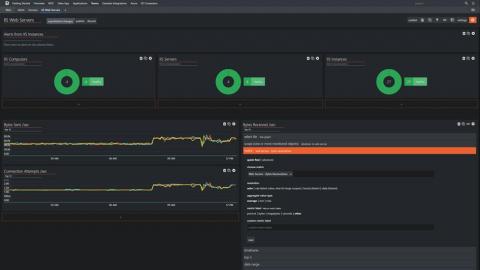
SquaredUp for SCOM - Quick Win Video Series - Part 7: Using a NOC Dashboard

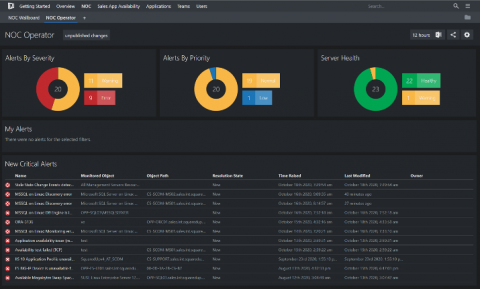
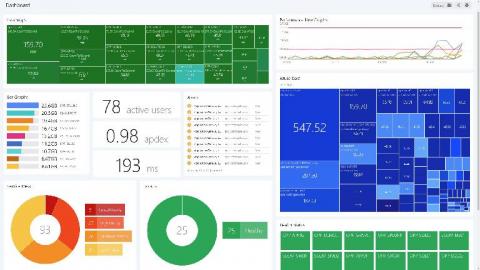
In this series we take you through some of the fundamentals of building and designing your own dashboards. We look at some of the tile types and visualizations that are available, show you how to run SCOM agent tasks from SquaredUp, and finish up with an example of using a SquaredUp dashboard to troubleshoot an issue. This video focuses on how to use a NOC dashboard. We’ll now use a NOC dashboard, and the drilldowns in SquaredUp, to help us resolve a problem in our environment.

SquaredUp version 4.7 is here Our third release this year!

Summer is in full swing, and the latest release of SquaredUp for SCOM and SquaredUp for Azure is now available. Welcome to version 4.7! This release is jam-packed with great functionality which our Product Engineering teams here at SquaredUp have been working hard on for the last few months. Here’s a quick round up of everything that’s been added and enhanced in version 4.7. There will be a series of blog posts covering the features in the coming weeks so stay tuned for more.

Visualizing VMInsights data in SquaredUp

Following the release of Azure Monitor for VMs in January 2020, some changes have been made to how its performance data is stored in Log Analytics. The most significant of these changes is that this data is now stored in the InsightsMetrics table rather than in the Perf table, as we discussed in our ‘What is Azure VM Insights?’ article.

What is Azure VM Insights?

Microsoft recently announced general availability of Azure VM Insights, aka Azure Monitor for VM. This service is basically a set of features that allow you to monitor your VMs in more detail, from collecting the telemetry from your VM to displaying it meaningfully – all with a single click. I am satisfied with Azure VM Insights for the most part, but I also have some mixed feelings about it. Read on to find out why.

Azure Monitor Agents: their different functions

In the Azure Monitor Learning Path, we talked about metrics and collecting data in a Log Analytics workspace to be operated on with KQL. As a part of it, we also talked about Monitoring Solutions and how they help you collect data into the workspace that is more focused for specific purposes. In that series, our main focus was on the Log Analytics Agent and I briefly talked about Diagnostics extension.

SCOMathon 2020 Can virtual events actually be better than face-to-face ones?

The short answer is “yes they can” but let me elaborate. In 2009 I joined the team behind Mobile World Congress, an event brand that hosts over 100k attendees in Barcelona, 75k in Shanghai and 22k in Los Angeles. I spent the next 9 years with the GSM Association, owner of Mobile World Congress, and Global Expansion Summit organizing over 50 large scale events across all 5 continents.

Aggregating and Visualizing Data with Kusto

Got the basics down and ready to move on to more advanced aspects of Kusto? You’ve come to the right place! Here you will learn how to use aggregation functions, visualize query results and put your data into context. If you’re just getting started with Kusto, check out our ‘Jumpstart Guide to Kusto’ before starting on this one. Let’s get into it!

6 steps we took to regain control of our Azure spend at SquaredUp

In this write-up of our special webinar, we'll give you an insider’s look into how we took control of our Azure costs, and how you can do the same. We’ll take you through how we identified the problems and implemented lasting solutions to keep things under control. You’ll get to hear from our key stakeholders involved - Finance, Management, IT, Engineering.

Azure Dashboards: SquaredUp vs. Azure Portal (Part 3 - Cost Management)

Previously on this Azure dashboards series, we covered making dashboards natively in the Azure portal vs. SquaredUp for Azure for VMInsights and AppInsights. In this third and final part we will be comparing our dashboard experiences when it comes to cloud cost management and visualization. We’ve already talked about the resource-level cost dashboards in the previous parts, our main goal in this one is to display costs on the subscription level. Alright, let’s jump straight into it!