Operations | Monitoring | ITSM | DevOps | Cloud

Tracing

The latest News and Information on Distributed Tracing and related technologies.

Implementing Jaeger for Distributed Tracing in Microservices

Earlier, applications were mostly monolithic, meaning that several programs were written in the same language and placed in the same web stack. However, it is no longer the case today. Today, every software is comprised of several small application programs coming together each providing a service of its own. These applications are what we call microservices.

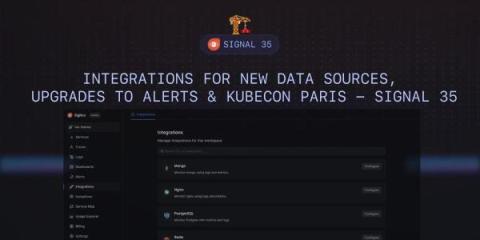
Integrations for new Data Sources, Upgrades to Alerts & Kubecon Paris - SigNal 35

Welcome to the 35th edition of our monthly product newsletter - SigNal 35! We have made significant advancements in enhancing our product. The integration feature we shipped will enable quick-start monitoring for popular technologies in SigNoz. Let’s see what humans of SigNoz were up to in the month of March 2024.

Observing Core Web Vitals with OpenTelemetry: Part Two

Core Web Vitals (CWV) are Google's preferred metrics for measuring the quality of the user experience for browser web apps. Currently, Core Web Vitals measure loading performance, interactivity, and visual stability. These are the main indicators of what a user’s experience will be while using a web page: Note: As of March 12th, INP has become a stable Core Web Vital, replacing First Input Delay (FID).

Announcing the Elastic OpenTelemetry SDK Distributions

Adopting OpenTelemetry native standards for instrumenting and observing applications If you develop applications, you may have heard about OpenTelemetry. At Elastic®, we are enthusiastic about OpenTelemetry as the future of standardized application instrumentation and observability.

How the Prometheus community is investing in OpenTelemetry

Goutham Veeramachaneni, a product manager at Grafana Labs, and Carrie Edwards, a senior software engineer at Grafana Labs, are both contributors to the Prometheus open source project. This post, which they wrote together, was originally published on the Prometheus.io blog in March 2024. The OpenTelemetry project is an observability framework and toolkit designed to create and manage telemetry data such as traces, metrics, and logs.

Choosing the Right Opentelemetry Backend: Key Considerations

With applications becoming increasingly distributed and complex, gaining insights into their behavior and performance is essential for maintaining reliability and delivering exceptional user experiences. OpenTelemetry has emerged as a powerful framework for instrumenting applications to collect, process, and export telemetry data.

Beyond the trace: Pinpointing performance culprits with continuous profiling and distributed tracing correlation

Observability goes beyond monitoring; it's about truly understanding your system. To achieve this comprehensive view, practitioners need a unified observability solution that natively combines insights from metrics, logs, traces, and crucially, continuous profiling. While metrics, logs, and traces offer valuable insights, they can't answer the all-important "why." Continuous profiling signals act as a magnifying glass, providing granular code visibility into the system's hidden complexities.

Unlock the Power of Observability with OpenTelemetry Logs Data Model

Your log records may be missing a key ingredient that unlocks the world of observability for your applications, infrastructure and services. If you're building a new application or enhancing an existing one, consider adopting the OpenTelemetry Logs Data Model's Log and Event Record Definition. Adopting this definition enriches your logs by adding additional data, making it easier to use them to correlate them with metrics and traces, in addition to XYZ.

Charting New Territory: OpenTelemetry Embraces Profiling

The topic of continuous profiling has been an ongoing discussion in the observability world for some time. I said back in 2021 that profiling was set to be the next major telemetry signal in observability, and in fact, since then there’s been growing interest in profiles. Startups and large observability vendors have gotten into this domain. A significant recent step was when the OpenTelemetry project decided to add profiles to its core signals and formalized the open unified specification for that.