Operations | Monitoring | ITSM | DevOps | Cloud

Tracing

The latest News and Information on Distributed Tracing and related technologies.

Comparing OpenTelemetry and Jaeger | Key Features

Jaeger and OpenTelemetry are essential technologies that greatly improve the observability of software applications. OpenTelemetry is a vendor-neutral platform that makes it easier to create and collect telemetry data, including logs, traces, and metrics. Its extensive backend integration adaptabilities allow it to fit into a wide range of infrastructures. However, Jaeger is an expert in distributed tracing within microservice environments.

What is the OpenTelemetry Transform Language (OTTL)?

The OpenTelemetry Transformation Language, or OTTL for short, offers a powerful way to manipulate telemetry data within the OpenTelemetry Collector. It can be leveraged in conjunction with OpenTelemetry processors (such as filter, routing, and transform), core components of the OpenTelemetry Collector. It caters to a range of tasks from simple alterations to complex changes.

How to instrument your Python application using OpenTelemetry

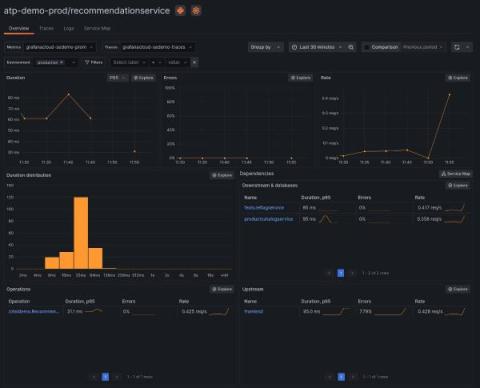
If you want to see if OpenTelemetry helps you become a better Python developer — or if you just want to know how to add OpenTelemetry to your Python service — you’ve come to the right place. In this blog, we’ll show you how to instrument your Python application using OpenTelemetry and how to visualize your OpenTelemetry data using Application Observability in Grafana Cloud. We’ll walk you through the following steps.

OpenTelemetry: 3 questions to ask before choosing an observability solution

As OpenTelemetry rises in popularity, more organizations are implementing, or planning to implement, the open source project to monitor their applications — and, meanwhile, more vendors are offering OpenTelemetry support. In fact, a quick Google search for “OpenTelemetry support” shows results ranging from legacy APM vendors to newer, cloud native solutions like Grafana Cloud.

OTel Explainer: Simplifying Observability in Modern IT Environments

In today's rapidly evolving landscape of distributed systems and microservices, understanding how applications behave in production environments has become increasingly complex. Traditional monitoring tools often fall short when it comes to providing comprehensive insights into the performance and behavior of these modern architectures.

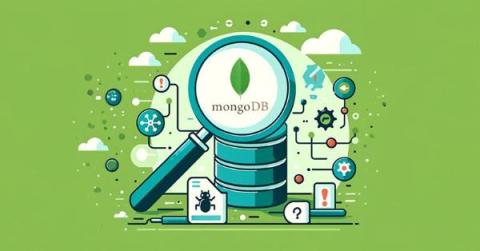
Debugging and Decoding MongoDB with OpenTelemetry

MongoDB’s flexibility and document-oriented nature have always stood out to me as its most compelling features, setting it apart from the strict schema constraints of traditional relational databases. This adaptability is a boon for application development, allowing for more dynamic data interactions that mirror real-world information complexities and freeing table schemas’ constraints.

Get Swept Off Your Feet by Cribl Stream 4.5: Converting Dimensional Metrics to the OpenTelemetry Protocol Format with the OTLP Metrics Function

In the dynamic world of observability and analytics, everyone’s looking for smarter, more efficient, and interoperable ways to handle their data. That’s where Cribl steps in, bringing you an exciting update to our product lineup. We’re thrilled to introduce the OTLP Metrics Function to Cribl Stream 4.5! This Function converts metrics into the OpenTelemetry Protocol (OTLP) format with ease!

Monitoring Kafka with OpenTelemetry including client side monitoring

In this video, you will see a demo of how to monitor Kafka with OpenTelemetry. We will instrument a NodeJS application using Kafka and get client side metrics like delay between producer emitting a message to consumer receiving it via distributed tracing. We will also get Kafka server metrics like consumer lag and plot it dashboards.