Operations | Monitoring | ITSM | DevOps | Cloud

The latest News and Information on Log Management, Log Analytics and related technologies.

A Complete Guide to Linux Log File Locations and Their Usage

Linux log files are text-based records that capture system events, application activities, and user actions. They're stored primarily in the /var/log directory and provide essential information for debugging issues, monitoring system health, and maintaining security. This guide covers the most important Linux log files and a few detailed techniques for reading and analyzing them.

Top 5 Open Source Log Management Tools (and How to Choose the Right One)

Managing logs at scale is no longer just about storing text—it’s about gaining insights fast, keeping systems healthy, and troubleshooting in real time. With cloud-native architectures becoming the norm, the pressure is on for modern teams to adopt log management tools that are fast, scalable, and easy to use. But with so many options, how do you choose the right one?

The One Where We Show You Copilot Editor

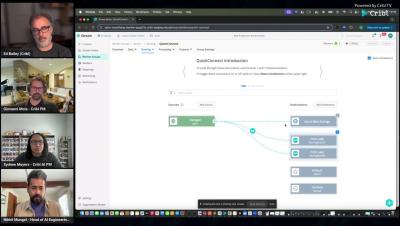
Copilot Editor is like an AI-powered Rosetta Stone for telemetry. It helps Cribl users take raw, messy telemetry data and turn it into standardized, analytics-ready formats. The most important piece? It puts YOU in control. Our human-in-the-loop design means that users have full control over and visibility into what’s happening with their critical data, preventing AI-induced mistakes. Watch this fun demo with the AI product team to show Copilot Editor's true value to the average Cribl user!

AI + Dark Mode: Introducing AI-Powered Insights and The Long Awaited Dark Mode

Join the live stream at 11 am ET, here. Launch Week’s Friday drop delivers two of the most-requested upgrades we’ve ever shipped: Together, they turn Bindplane into a cooler , and smarter , place to manage observability and SecOps telemetry. A full suite of extensive AI features will be rolling out over the coming weeks. This is just the beginning!

From Downtime to Uptime: Monitoring Tools and Techniques for Systems, Websites, APIs, and More

Recently, while visiting a friend in a local hospital, I found myself facing a frustrating distraction: trying to pay parking fees using USSD (a mobile text-based system for quick transactions). The service was either painfully slow or not working at all. I wasn’t alone. Other visitors were just as exasperated, and parking attendants stood idle, their handheld devices frozen in endless loading loops.

Top Features of Splunk Observability Cloud for Engineers

In this video we’ll walk you through a demonstration of Splunk Observability Cloud’s key capabilities. You’ll see how you can monitor Kubernetes cluster health in Infrastructure Monitoring, and alert on your services’ health using AutoDetect Detectors and Alerts. We’ll then take a look at traces and metrics in APM, and use Related Content to find correlated log entries of error traces. Then we’ll use AlwaysOn Profiling to troubleshoot long duration traces for our service.

Fluentd vs Logstash: In-Depth Comparison of Two Popular Log Collectors 2025

In modern observability stacks, log collection is a critical component. Among the most widely adopted logs collector are Fluentd and Logstash. Both tools are designed to collect, process, and forward logs to various destinations like Elasticsearch, Kafka, and cloud services. However, the differences between FluentD and Logstash lie significantly in their design, performance, plugin ecosystems, and user experiences.

Shift-Left Monitoring for GitHub and Vercel Workflows

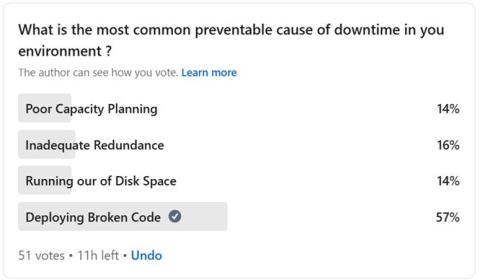
A recent LinkedIn poll by Peter Zaitsev asked: “What is the most common preventable cause of downtime in your environment?” Guess what most respondents said it was? Surprise, surprise – the top answer is Deploying Broken Code, with 57% of respondents selecting it. This reinforces how critical it is to catch issues before they hit production.

How to Monitor Frontend Memory Usage

First of all, by frontend memory usage I mean the amount of memory that a user’s browser needs when using your website or webapp. Secondly, do you have any idea how much browser memory your website or webapp requires? Or do you know if or how much the memory footprint of your website/webapp has changed over the last few months? Or after the recent changes or releases you made? I’m guessing you don’t. Yet, this is important to monitor to avoid a bad user experience.