Operations | Monitoring | ITSM | DevOps | Cloud

The latest News and Information on Monitoring for Websites, Applications, APIs, Infrastructure, and other technologies.

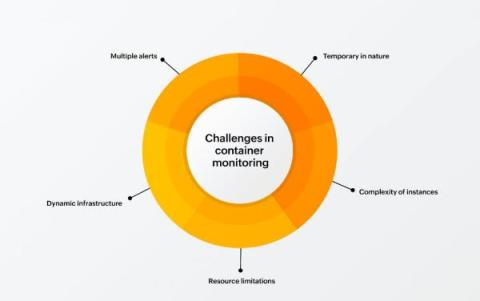
The challenges in container monitoring and how Applications Manager eliminates them

Containers are standard, executable units of software in which application code is packed with all the dependencies, libraries, and other necessary elements required for the code to run in any environment quickly and with ease. Containers package the application code with all the necessary dependencies required and can easily be distributed and deployed anywhere, eliminating the need for additional infrastructure requirements.

Leveraging Network Interception with Playwright for End-to-End Monitoring

If you're using Playwright, either on its own or for synthetic monitoring with Checkly, you might have heard about writing Playwright scripts in a user-first manner. This approach focuses on interacting with the UI as a user would, such as clicking buttons or submitting forms, and then waiting for the UI to reflect the changes. However, sometimes you need to intercept and analyze the network layer to verify that your UI is getting the right responses from its supporting API.

Troubleshooting Microsoft Teams Latency Issues

Welcome to our guide on troubleshooting Microsoft Teams latency issues! Whether you're a remote user striving to stay connected with your team or an IT professional responsible for maintaining a smooth and efficient virtual workspace, dealing with latency can be a frustrating experience. From delays in audio and video to sluggish file uploads and downloads, latency can significantly impact productivity and user satisfaction.

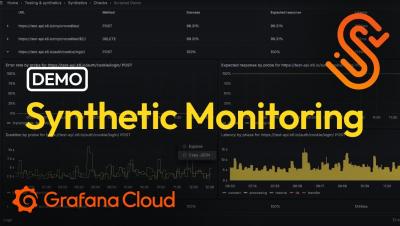
Proactively monitor user journeys with Grafana Cloud Synthetic Monitoring

Grafana Cloud Synthetic Monitoring proactively monitors the performance of your APIs and web applications from the user's perspective. Powered by Grafana k6, Synthetic Monitoring combines GUI-based and as-code monitoring to improve efficiency, collaboration, and application reliability. Watch this demo of how to use Synthetic Monitoring in Grafana Cloud.

Data Storage Costs Keeping You Up at Night? Meet Archived Metrics

We all have been there! Getting the largest metrics plan available, turning on real-time monitoring, and…. You know what happens next… BIG BILL! With the explosion of telemetry from microservices, containers, and cloud stacks, engineering teams often have to choose between data and budget. To help our Splunk champions, we are introducing Archive Metrics to make storing data up to ten times cheaper.

Master Class: Optimizing CX through 4 Pillars of Internet Resilience

User expectations are higher than ever, achieving faster Mean Time to Detect (MTTD) and Mean Time to Recover (MTTR) is non-negotiable. In this master class, we explore how the foundational elements of reachability, availability, performance, and reliability form the pillars of Internet Resilience, and how proactive IPM can contribute to early incident detection and resolution. Through real-world examples and practical insights, you'll gain a deeper understanding of how IPM can optimize your digital services and mitigate potential disruptions.

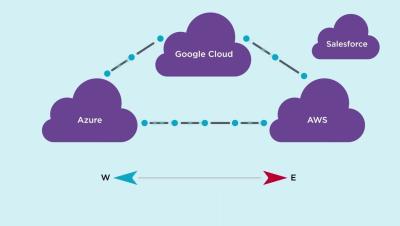
Gain Cloud Network Visibility

As more apps and services are moved to the cloud, network operations teams can lose visibility yet are still responsible for solving issues when they occur. There is no need to suffer from cloud blind spots. Active monitoring across end-to-end network paths can help clear the skies and network operations teams can regain visibility both to and through the cloud, including multi-cloud architectures.