Operations | Monitoring | ITSM | DevOps | Cloud

Bridging Alloy and OpenTelemetry: the OTel engine is now in Public Preview

Many Grafana Cloud customers love what Alloy offers them, but we're also seeing a growing base of users who feel the same way about the OpenTelemetry Collector. We want to make it easy for customers to make the decision that makes the most sense, regardless of their preference.
MongoDB's Node Driver 7.8.0 Patches Two Real Security Issues

If your Node app talks to MongoDB through the official mongodb driver, 7.8.0 is worth upgrading to before your next routine dependency pass. It’s a minor version by the number, but it carries two security fixes, and one of them changes how a feature you may already be using behaves.

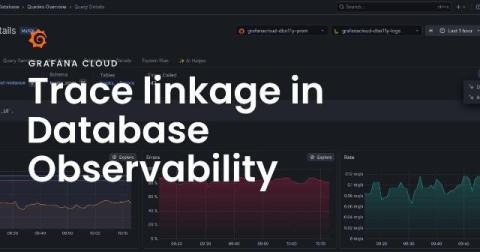
Trace linkage: connect the dots between your app traces and database queries

When an application request slows down, a trace can show a database call. Finding the database query behind it can be tedious, requiring you to switch between traces and database telemetry, as well as match timestamps or query text by hand. In Grafana Cloud, the Database Observability app already provides a window into all of your database telemetry, including query samples, performance history, and explain plan.

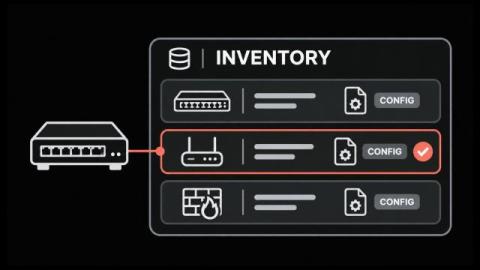
Network Inventory Management: How to Track Every Device and Config

How many devices are on your network right now? The usual answer is “check the spreadsheet”, and nobody is quite sure which copy is current. That's awkward during an outage and worse during an audit, or on the day a vendor advisory asks which switches run a vulnerable firmware build. Network inventory management retires that spreadsheet. In its place, you get a record that changes when the devices do, with hardware, addresses, VLANs and every router and switch config in one place.

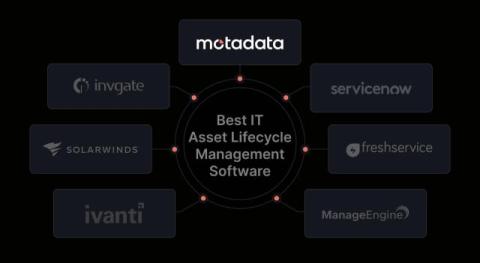
7 Best IT Asset Lifecycle Management Software in 2026

If your IT team struggles to track devices, software licenses, warranties, and contracts, managing assets can become difficult. IT asset lifecycle management software helps you track every asset from purchase to retirement. It gives your team a clear record of: However, tools differ in their discovery methods, lifecycle workflows, license tracking, deployment options, and pricing. In this guide, we compare 7 IT asset lifecycle management software tools based on their features, limitations, and pricing.

Pushing metric concurrency, cardinality, compute and retention limits with $1000 of infrastructure

We gave five metrics backends the same budget, the same week of data and the same ten queries, then ran those queries at rising concurrency. At one query at a time, the open source engines looked strong. Under concurrency, two of them stopped answering, and the rest slowed down by an order of magnitude.

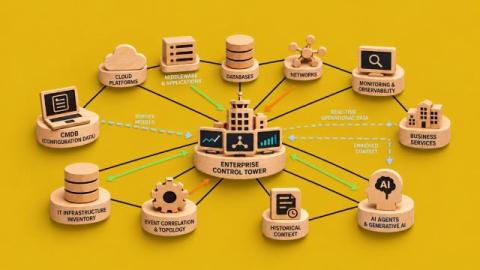
Why AI-Ready IT Operations Need More Than a Traditional CMDB Now?

Configuration Management Databases (CMDBs) have long played an important role in IT Service Management, providing a structured record of technology assets, their configurations and relationships. For enterprises managing complex IT environments, they remain a valuable foundation for understanding infrastructure and supporting operational processes.

Evaluate your AI agents with Fireworks AI models in Datadog Agent Observability

Teams that build agents on open models hosted on Fireworks AI, such as GPT-OSS, Kimi, GLM, Qwen, and MiniMax, need a reliable way to measure whether their LLM applications and agents are giving accurate, safe, and helpful answers efficiently. Datadog Agent Observability now supports Fireworks AI as a model provider, so you can get end-to-end visibility into your agents built on Fireworks AI, from traces and token usage to quality evaluations.

When Does Insight Become Guided Action?

AI can already tell operations teams what is wrong. The harder part is everything between knowing and doing. Skylar is closing that gap through guided action: recommendations grounded in live operational context, reviewed by the right owner, and connected to governed execution. In many post-incident reviews, the surprising moment is not when the team finally understood the problem. It is when they realize how long the organization waited after it already knew enough to act.

Honeycomb Team Agents: AI SRE Done Right

The best alert is the one that never fires. Picture an idyllic Tuesday afternoon: last night's release nudged checkout p99 up 41%, but an agent noticed. Nobody got paged, and your SLOs didn't start burning. Instead, the agent acted and already narrowed it down to one retry change. It filed a ticket for the Payments team and flagged the PR. By the time anyone would have noticed, the fix is in review. That's what SRE was always supposed to feel like.

Finding performance wins in our own traces with a coding agent

For the last few weeks I’ve used a coding agent to find and fix backend performance issues in Sentry, starting from the traces Sentry sends to itself. Most of the fixes only changed a line or two. But together, they removed hundreds of millions of queries a week, and some expensive lookups became hundreds or thousands of times faster (more details on that below).

Dissecting Rails Migrations: Anatomy, Rollbacks, and Errors (Rails 8.1)

A Rails migration is a timestamped Ruby class inheriting from ActiveRecord::Migration whose change method alters the database schema. bin/rails db:migrate runs each pending migration once, records its version in the schema_migrations table, and dumps the result to db/schema.rb. Rollbacks invert change; irreversible steps need up and down. On PostgreSQL and SQLite, each migration runs inside a transaction.

Instrumentation Hub in Grafana Cloud: start easier, stay in control

It's no secret that getting started with observability can be much harder than it should be. That's why, at ObservabilityCon 2025, we introduced Instrumentation Hub: a guided, scalable way to roll out observability coverage while still keeping you in control. Today, we’re excited to announce that Instrumentation Hub is now Generally Available in Grafana Cloud.

IBM MQ Alternatives: When ActiveMQ and Artemis Make Sense

What IBM MQ costs an organisation is a knowable figure. It comes off a renewal statement, an entitlement count or a licensing review, and finance can put a number against it down to the core. What replacing it would save is not knowable in the same way. There is no independent case study in the public record carrying real durations, team sizes and application counts, and every migration timeline in circulation comes from an organisation selling the migration.

The Jolokia Problem: Eight CVEs, One Door in Apache ActiveMQ

The Apache ActiveMQ Jolokia endpoint has been the route to remote code execution in three separate years. In 2023, it was reflection into the JVM. In 2024, a default configuration left it without a login. In 2026, it was the broker's own management operations, patched in March, exploited in April, and reopened three more times by summer.

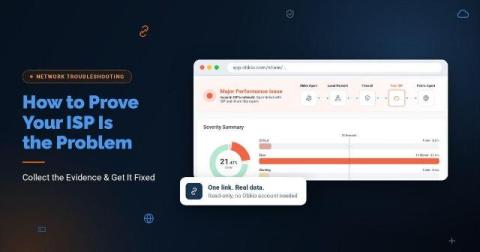
How to Prove Your ISP Is the Problem (With Data)

You call your ISP because calls keep dropping and the Internet crawls every afternoon. Support asks you to restart the modem. Then they test the line from their side, see nothing wrong, and tell you everything looks fine on their end. By the time a technician shows up, the problem is gone, and the ticket gets closed. The issue usually isn't that your ISP doesn't care. First-line support is trained to rule out the customer's network first, and most complaints arrive with nothing they can check.

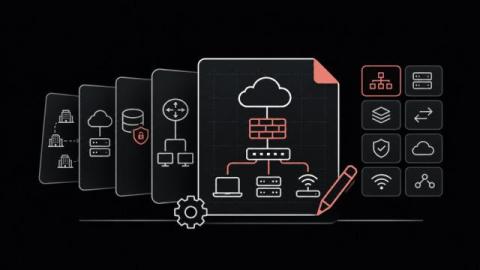
Network Diagram Examples: 8 Types and How to Draw Them

Most network diagrams we come across land in one of two piles: the one drawn for an audit years ago and never opened since, and the one so crowded that finding the firewall takes squinting. The network diagram examples below sit between those piles, 8 diagrams IT teams actually use, sorted into physical, logical, and cloud or WAN. For the full build process behind one map, see our guide to the network topology diagram.

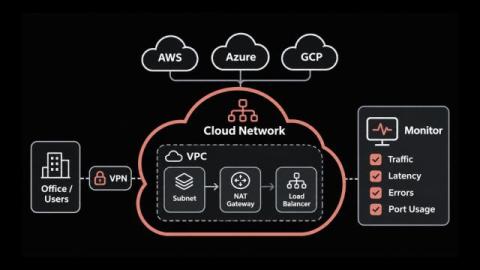
What Is Cloud Networking? Types, Benefits and How to Monitor It

Think about Outlook, Salesforce or the shared drive your staff open each morning, and at least one of them probably runs in AWS, Azure or Google Cloud. That puts a good share of your traffic on a cloud network nobody on your team has ever seen. You still own a lot of that path (the VPN link, the route tables, the security groups), and it breaks in ways an office network doesn't.

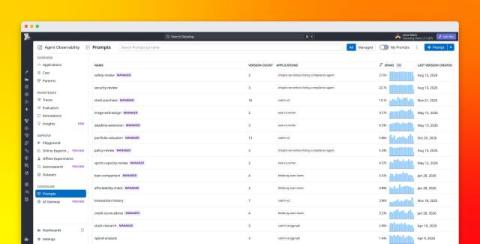
Manage and deploy LLM prompts with Datadog

Prompts are an important part of LLM application behavior, but teams often manage them alongside application code or across separate notebooks and configuration files. This can make prompt changes dependent on application releases and make it difficult to understand which version is running in each environment. When a change affects application quality, latency, or cost, teams also need a way to connect that behavior back to the prompt version that produced it.

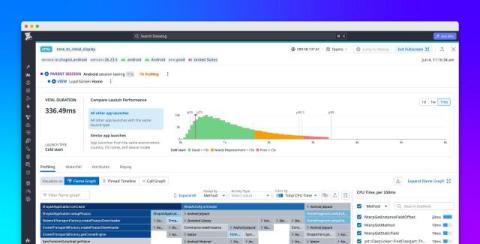
Diagnose frontend performance issues with RUM Profiling

When a mobile application takes too long to launch or becomes unresponsive, it can be difficult to find the cause. Datadog Real User Monitoring (RUM) helps developers detect these issues and understand which users are affected. But knowing that an application is slow doesn’t tell you which part of its code is responsible. Engineers often need to reproduce the problem locally, piecing together performance metrics and code execution information from separate tools.

Android profiling now uses Perfetto via ProfilingManager

Starting with Sentry Android SDK 8.51.0, profiling on Android 15+ devices is powered by Perfetto, through Android’s system ProfilingManager API. That means fewer legacy tracer crashes, lower CPU and memory overhead, and more representative profiles. You don’t need to change any configuration: if you already use continuous profiling, devices on Android 15 and newer pick up the new profiler as soon as you upgrade.

Grafana Assistant Demo: AI-Powered Root Cause Analysis and Remediation

See how Grafana Assistant uses AI to investigate incidents, identify root causes, and help remediate application problems. In this demo, Engineering Manager Ksenia Yadav and Staff Product Manager Maurice Rochau show how AI-powered observability supports the move toward autonomous operations, from detecting problems to generating code fixes and validating their impact in production. Explore how Grafana Assistant uses context from your telemetry, infrastructure, incidents, business data, and code to.

Full-Stack Observability with Grafana Cloud: From Business Impact to Root Cause

How do you trace a dropped conversion or a checkout failure to its technical root cause? See how full-stack observability in Grafana Cloud connects business impact to system performance across web and mobile clients, applications, infrastructure, and databases. In this session, Principal Software Engineer Jim Gehrett and Staff Product Manager Sarah Constant demonstrate how to start with a business problem and work backward through the technology stack to investigate its cause.

How Uber Optimizes Code at Scale with Grafana Cloud Continuous Profiling & Grafana Assistant

How does Uber use continuous profiling to improve performance and resource efficiency across several million CPU cores? In this Grafana Cloud case study, Senior Researcher Chris Zhang from Uber’s Frontier Tech Labs explains how the team uses Grafana Cloud Profiles and Grafana Assistant to identify expensive code and scale code optimization across its production systems.

What happened when we gave $10k worth of data to 5 observability platforms | Live Laugh Logs

We gave $10k worth of data to five different observability platforms. Which agent finds the true answer? In the first episode of our benchmarks series, Chris and Annie walk through how an agent performed on Coralogix, Datadog, New Relic, Dynatrace and Grafana Cloud across 10 injected incidents. They also explain why sampled data makes agents "hallucinate the gap". Subscribe to our channel for more benchmarks and insights into observability and AI.

Episode 19- What Gen Z Actually Thinks About AI

In Part 1 of this conversation, three early-career professionals at Digitate — Ryan Bascos, Renad Morrar, and Ritu Bhalodia — join The Intelligent Enterprise to share what it actually feels like to start a career in the age of AI: the tools they rely on, the concerns they carry, and what their generation sees that others might be missing.

Can driver-monitoring systems help prove fault in a rideshare crash?

Driver-monitoring systems are increasingly used by rideshare companies to capture data during every trip. These technologies gather detailed information that can become crucial evidence in resolving rideshare accidents. Understanding how this evidence is collected, preserved, and accessed is important for both passengers and legal professionals in places such as Paramus.

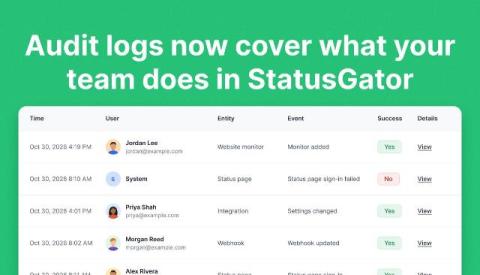
Audit logs now cover what your team does in StatusGator

StatusGator’s audit logs now track more of your team’s activity, including changes to monitors, incidents, scheduled maintenance, status pages, and integrations. Previously, audit logs focused on sign-ins and account security. With this update, organization admins can also see who changed a monitor’s component filters, rescheduled maintenance, resolved an incident, or updated a status page’s password.

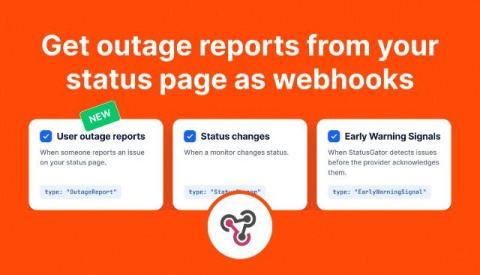
Get outage reports from your status page as webhooks

StatusGator webhooks now support user outage reports, so you can send reports from your status page to your own tools as soon as they’re confirmed. We’ve also added event settings to each webhook, letting you choose which notifications an endpoint receives. Use outage reports to create support tickets, alert your on-call team, or collect reports for analysis. Each payload includes the affected service, selected components, the reporter’s comment, and their approximate location.

The $6.3B Binance Hack: What Happened and What It Teaches Security Teams About Investigation

TL;DR On October 29, 2026, attackers drained about $6.3 billion in crypto assets from Binance’s hot wallets, the largest crypto theft on record. Binance says the incident may have started with a compromised laptop, but its investigation has since found additional points of breach, and the root cause is still being confirmed. For engineering and security teams, the lesson is about how quickly you can reconstruct what happened across many systems once something goes wrong. In this post.