
Operations | Monitoring | ITSM | DevOps | Cloud

The latest News and Information on Observabilty for complex systems and related technologies.

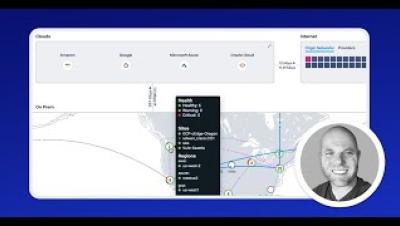
Demo: Kentik Network Observability for Hybrid Clouds

In this video, we demonstrate how Kentik provides comprehensive network observability for hybrid cloud environments, encompassing both on-premises and public cloud resources. We start with the Kentik map, showcasing active on-prem sites and cloud environments, then dive into specific examples of how to view and analyze traffic and connectivity. The demo covers how Kentik collects network telemetry from various sources, including AWS VPC flow logs, Azure NSG flow logs, and SNMP, to provide detailed insights into network performance.
How to achieve Observability for Microservices-based apps using Distributed Tracing?

Modern digital organizations have rapidly adopted microservices-based architecture for their applications. Microservices-based apps have components designed around business capabilities serving a specific purpose. It enables smaller engineering teams to own specific services that lead to increased productivity. But componentization also leads to complexity. Today’s modern internet-scale businesses have hundreds or thousands of microservices.

Native and eBPF-based Kubernetes Workload Profiling for Kubernetes Clusters

System observability is an essential part of identifying performance issues within your environment because it provides a comprehensive view of how your systems are operating at a glance. Typically, observability is achieved through the collection and analysis of metrics. These metrics, generated by your applications, are deliberately incorporated by developers into the source code to offer insights into the application’s internal processes.

Bringing ArchiMate Flow Diagrams to Life with End-to-End Observability

Aligning IT infrastructure with business processes is paramount in today's digital landscape. This article explores how organizations can elevate their architectural modeling by integrating ArchiMate's flow diagrams, which are initially manually created, with the dynamic, auto-discovered components from StackState's end-to-end observability.

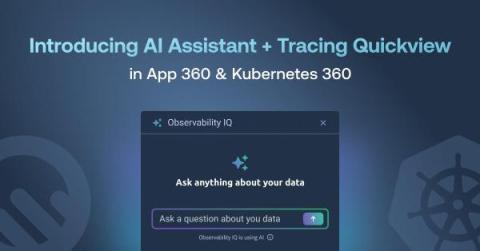
Logz.io Upgrades App 360, Kubernetes 360 with AI Assistant, New Tracing Quickview

At Logz.io, we believe the future of observability will center on the rapid advancement of automation, innovations around artificial intelligence, and streamlining processes that currently remain far too complex. This is no different than many other areas of technology, but the opportunities in observability are vast, and we see all of these areas connecting and driving improvements to the Logz.io Open 360 platform.

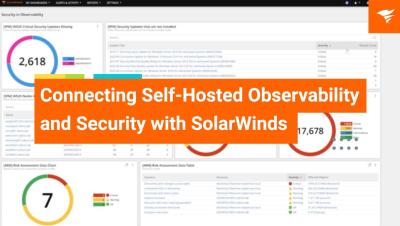
Connecting Self-Hosted Observability and Security with SolarWinds

Watch the full session at: slrwnds.com/TC24 The Integration Equation David Russell, Bryce Mata, and Chrystal Taylor Resolving an incident before end users are impacted is the new standard, but managing separate observability and incident management solutions is tempting fate. You are at risk of an issue slipping through the cracks. It's time to consolidate, streamline, and decomplexify your operations. Hybrid Cloud Observability combined with SolarWinds Observability and SolarWinds Service Desk make all of this much, much easier.

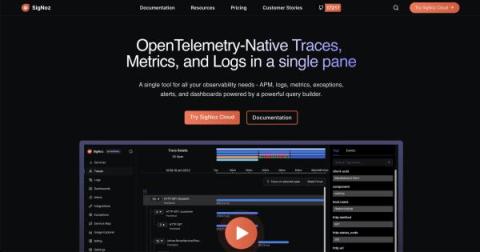
Deep dive into observability of Messaging Queues with OpenTelemetry

Working in the observability and monitoring space for the last few years, we have had multiple users complain about the lack of detailed monitoring for messaging queues and Kafka in particular. Especially with the coming of instrumentation standards like OpenTelemetry, we thought there must a better way to solve this. We dived deeper into the problem and were trying to understand what better can be done here to make understanding and remediating issues in messaging systems much easier.

Network observability in Kubernetes clusters for better security and faster troubleshooting

For DevOps and platform teams working with containers and Kubernetes, reducing downtime and improving security posture is crucial. A clear understanding of network topology, service interactions, and workload dependencies is required in cloud-native applications. This is essential for securing and optimizing the Kubernetes deployment and minimizing response time in the event of failure.

Why Metrics are the Most Critical Data Type in Observability

Editor’s Note: This is the fourth and final installment of a series of blog posts previewing our State of Observability 2024 survey report. In last week’s episode of this blog series, we looked at whether observability is replacing or enhancing existing IT monitoring tools. This week, we’ll look at why metrics are the most important observability data type to ITOps teams and what's holding back tracing.

Update on Cisco and Splunk Observability, Better Together

Eight weeks. When someone asks me about the synergies of Cisco + Splunk with regards to full-stack observability, I think about how much we’ve accomplished in just eight weeks. Eight weeks since the close of the acquisition, our teams have already come together to jointly develop, and will deliver, a new capability for enabling observability across the entire digital footprint for both Cisco and Splunk customers.