Operations | Monitoring | ITSM | DevOps | Cloud

Get observability in your pocket with the Grafana mobile app

When you’re on the go, your phone is often the only observability tool you have. And what you can do with it in the first few minutes matters. With the incredible innovation that has gone into mobile CPUs, GPUs and displays, a phone is a powerful device where you can immediately see what’s happening and start acting on it. And the Grafana mobile app now allows you to both see and act.
Best AI Observability Tools of 2026: Monitoring the AI You Build and the AI That Runs Your Ops

TL;DR “AI observability” now describes two different jobs. One is watching the LLM apps and AI agents your team ships: prompts, tool calls, token spend, and output quality. The other is putting AI agents to work on your production telemetry so incidents are already being investigated by the time an engineer logs in. Most engineering orgs in 2026 need both, and very few tools cover the two well.

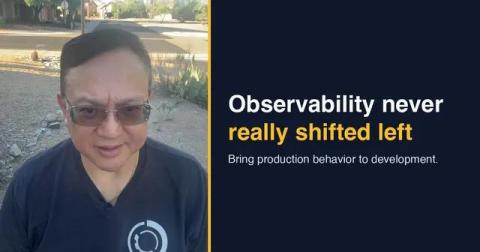
Observability Never Really Shifted Left

We made software development faster. Now we need to make validation faster, too. For the last decade we have shifted development left. Testing, security, performance, and CI/CD all moved closer to the developer. Observability mostly did not. It still starts after deployment (we covered the incident side of this in Your Observability Stack Found the Fire), which means the people writing the code rarely have meaningful production behavior to observe while they build.

Honeycomb Adds Another AWS Competency: Resilience Technology

We're excited to share that Honeycomb has achieved yet another Amazon Web Services (AWS) Competency—the Resilience Technology Competency—which recognizes our ability to help customers detect, investigate, and recover from failures in production systems running on AWS. While receiving the competency designation is a fantastic recognition of the capabilities of the Honeycomb platform (we also received one in Financial Services earlier this year), it's ultimately not the point.

Putting Amazon ECS on the map

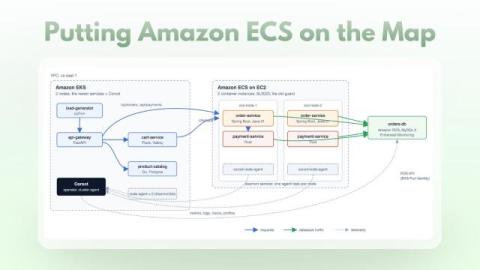
Say "ECS" and most people picture serverless containers: no nodes to manage, and nothing underneath you are allowed to touch. For an eBPF-based agent that is a dead end. There is no host to run on, no privileged containers, no kernel to attach to. But ECS is not always serverless. With the EC2 launch type you bring the nodes and ECS brings the scheduler: task definitions, services, rolling deployments, daemons, placement.

The Root Cause Agent: Bring an agentic approach to observability

For years, engineering teams have faced the same challenge during incidents: the systems generating alerts are becoming more complex, but the investigation that follows is still largely manual. Monitors are good at telling us that something is wrong. The harder question is why. When an alert fires, an engineer still has to work out where to look, which signals matter, what hypothesis to test, and how the evidence across logs and metrics fits together.

The Business Side of Observability: Ramazan Karadavut on Customer Value and SolarWinds

In this episode of SolarWinds World Tour Conversations, we sit down with Ramazan Karadavut, Founder & Senior Architect at Consolit, to discuss his 20-year journey with SolarWinds and the power of end-to-end IT management. We explore real-world enterprise use cases, including monitoring large-scale banking networks across 10,000+ branches, and thousands of ATMs. We will also explore why moving beyond basic alerting into inventory management, change management, and investment reporting is essential for complex environments.

Observability is a data problem

TL;DR Metrics, logs, and traces each have a different shape, so each needs a different backend. Aiven for Metrics handles metrics and alerting, Aiven for OpenSearch handles keyword search across logs, and Aiven for ClickHouse handles analysis of high-volume, high-cardinality events. All three are upstream open source engines on the same Aiven platform, so you can start with one and add the others as your needs change.

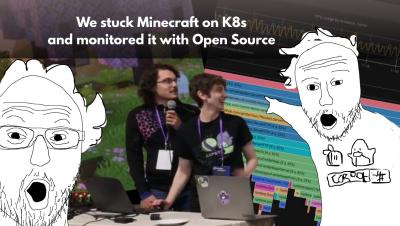
We Stuck Minecraft on a Kubernetes Cluster and Observed it with Open Source

Why did we do this? Not important: jump to 1:31 to see the Pis. TL;DR: We stuck Minecraft on kubernetes running on 4 Raspberry Pis in a 3D-Printed case, and monitored it with open source observability. Huge thanks to Percona DBA Ivan Zaitsev for putting the demo together for Percona University, Montevideo. Coroot automatically collects and visualizes all your telemetry data: logs, metrics, traces, profiles, and a complete map of your services. With the complete context of eBPF, it can diagnose the exact cause of an incident in seconds, and show you the exact commands to fix it.

OpenTelemetry Collector Configuration for LLM Observability

Your LLM application emits telemetry unlike anything else in your stack. Model calls, tool invocations, retrieval steps, and token usage arrive as spans whose attributes carry entire prompts and completions. That data is bulky, it's full of user content you may not be allowed to export, and depending on which instrumentation each service uses, the same fact can arrive under different attribute names.

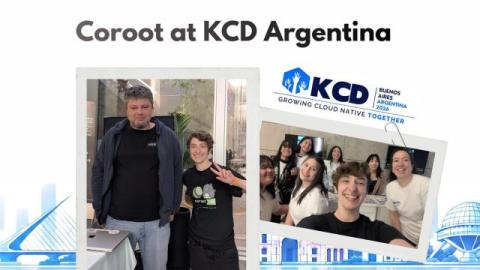
Coroot at KCD Argentina

Kubernetes Community Days (KCD) Argentina brought together the vibrant technology communities of Buenos Aires for in-depth technical talks, SRE workshops, and an amazing opportunity to connect with fellow experts in cloud technology. Coroot had a great time participating, and we extend our thanks to all the SREs, DBAs, and DevOps engineers who stopped by the booth to discuss their observability experience.

Beyond Traditional Observability: Turning Technical Insight into Operational Intelligence

Observability has become a central part of modern IT operations and for good reason. Metrics, logs and traces give technical teams detailed evidence about how applications, infrastructure and services are behaving. Such evidence helps them investigate performance degradation, identify abnormal behavior and understand what changed around the time an issue occurred.

Observability vs Monitoring: Why Does IT Still Find Out After the Business Does?

✓ operational truth IT finds out late because traditional monitoring is built to detect what goes wrong, not what has quietly stopped happening. Closing that gap requires observability that validates business journeys end to end, detects missing activity, checks its own coverage, and predicts degradation before a threshold is ever crossed.

How Honeycomb Private Cloud Drinks From the Fire Hose

Back in July, I wrote about how the Tenant team (the team behind Honeycomb Private Cloud (HPC)) has embraced the code review bottleneck to focus more of its work. One of the other challenges we have is that we're downstream of almost all the other teams at Honeycomb, meaning that we have to package up everyone's code and services, and how it gets provisioned! This is something impossible to handle through code review since there are so many engineers on other teams, and so few of us.

The Year-2 Price Cliff: What Your Observability Stack Really Costs Over 3 Years

I’m not the one whose phone lights up at 3 a.m. when production breaks. But I’ve spent years working alongside the engineers who are, and I’ve noticed that observability migrations happen for two reasons. Either engineering needed one, or, far more often, a quote landed that looked too good to refuse. The engineers rarely regret the first kind. The second kind they tell me about in year two, usually with a renewal notice in hand.

Dr. Cat Hicks on the Psychology of Software Teams

What happens when a software engineer who has put their entire identity into being the resident expert of an obscure technology or language with ten years of experience and who knows the codebase like the back of their hand now has to compete with AI? Psychologically speaking, according to Dr. Cat Hicks, author of The Psychology of Software Teams and founder of Catharsis, that's called identity threat, and it's a surefire way to feel unsafe. We were honored Dr.