Operations | Monitoring | ITSM | DevOps | Cloud

Add observability to cart: How online retailer ASOS reduces MTTR with Grafana Cloud

Like the fit your friend got on ASOS? There’s a good chance Grafana Cloud had something to do with that. Each year, more than 20 million customers come to the UK-based online retailer to fill their digital carts, and they expect a seamless online experience as they shop and check out. ASOS can consistently provide that with the help of Grafana Cloud. “There are alerts set up for many of our customer-facing journeys,” said Dylan Morley, Lead Principal Engineer at ASOS.

The Log Monitoring Guide for Sweet Insights

Logs are more than just records. With proper log monitoring, they become the honey that sweetens observability. Observability is your ability to understand and optimize your system’s behavior. Turning raw logs into actionable insights requires the right tools, practices, and insights. This blog post is a guide on log monitoring key concepts and best practices for sweetening your observability.

Supercharging FerretDB Performance with Coroot: A Success Story

At Coroot, we’re passionate about providing developers with the tools they need to build and maintain high-performing applications. Recently, we had the opportunity to help a team using FerretDB, the open-source document database offering MongoDB compatibility with a PostgreSQL backend, significantly improve their monitoring and performance. This is their story.

Splunk AppDynamics 24.10 Accelerates Deployment And MTTR

Splunk AppDynamics, now part of the Splunk Observability portfolio, provides critical observability for traditional 3-tier/n-tier applications and helps IT Operations teams quickly discover root causes of issues before end-users even notice. AppDynamics complements Splunk Observability Cloud, which is optimized for observing cloud-native applications by DevOps and engineering teams.

Reducing Downtime: How Unified Observability Tracks Authentication Bottlenecks

The user experience demands a seamless and secure method while logging in. According to a 2023 report by Statista, 66% of users report ditching a website or application due to lagging or authentication issues. Typical users expect the login to be fast and secure, regardless of Single Sign-On (SSO) or Multi-Factor Authentication (MFA).

Diving into .NET 9.0, Blazor, and Observability with Coralogix

So, there I was, a newbie to.NET 9.0, Blazor, and Coralogix, standing on the precipice of observability in a world of production bugs and development mysteries. As an Agile enthusiast, I’m well versed in all things “observability” and how it’s a game-changer for root cause analysis, especially in today’s rapid, iterative development cycles. Observability is like getting X-ray vision into your application to understand what’s truly happening based on system outputs.

Troubleshooting CORS Errors in Offsite API Calls

You may have wrestled with a web application attempting to call an offsite web service, such as an OpenTelemetry Collector, and gotten an odd error with the word CORS in it. Something like: Or, maybe you got a generic thrown error from your fetch statement that states Error: Failed to fetch …and you wondered, “What’s the problem, and how can I fix it?” These kinds of errors are called CORS errors, and they can be a bit confusing.

Observability to AIOps: Transforming Anomaly Detection for Modern Enterprises

As businesses increasingly digitize operations, IT systems are evolving into complex, distributed ecosystems. Applications run across multi-cloud environments, microservices power critical processes, and data flows in real time across countless touchpoints. While this transformation drives agility and scalability, it introduces significant challenges: hidden anomalies that can disrupt operations, frustrate users, and damage revenue.

Black box and white box monitoring, and why modern IT observability needs both

Monitoring is essential for enhancing the reliability, performance, and user experience of all software systems. IT operations can employ two key monitoring strategies to assess system health: black box and white box monitoring. This blog discusses both approaches and highlights how ManageEngine Site24x7, an AI-based IT observability platform, can assist organizations in adopting white box monitoring to improve IT operations.

Complete Python Logging Guide: Best Practices & Implementation

Python's logging system provides powerful tools for application monitoring, debugging, and maintenance. This comprehensive guide covers everything from basic setup to advanced implementation strategies, helping you build robust logging solutions for your Python applications.

AI Strategies for Software Engineering Career Growth

Space.com sums up the Big Bang as our universe starting “with an infinitely hot and dense single point that inflated and stretched—first at unimaginable speeds, and then at a more measurable rate to the still-expanding cosmos that we know today,” and that’s kind of how I like to think about November 2022 for junior developers.

Enhance Network Observability with SystemEDGE for DX NetOps

In the increasingly complex network infrastructure stack, achieving complete visibility across every layer is no longer optional—it’s necessary. Network operations teams seek solutions that offer seamless observability across diverse infrastructures while minimizing operational costs. Enter SystemEDGE, a robust monitoring tool designed to amplify observability within the DX NetOps ecosystem.

How to Control Observability Costs with Grafana Cloud | Demo | Adaptive Telemetry | Loki | Profiling

In this video, Grafana Labs demonstrates how Grafana Cloud addresses the challenges of rising observability costs faced by organizations worldwide. As observability costs grow and logging architectures become increasingly resource-intensive, teams are forced to make difficult decisions about coverage, often leaving critical blind spots. Grafana Cloud offers a cost-effective, end-to-end observability solution that eliminates the need for compromise on efficiency or performance.

Measure What Matters

Have you ever had an alert go off that you immediately ignore? It’s a nuisance alert—not actionable—but you keep it around just in case. Or maybe you’ve looked at a trace waterfall and wondered what exactly happened during a gap that just doesn’t drill down deep enough to explain what’s going on. Do you know the feeling where you have just enough information to monitor what’s going on in your systems, but not quite enough to put your mind at ease?

Top 10 Kubernetes Alternatives to Consider in 2025

Organizations exploring Kubernetes alternatives often face a critical decision when choosing the right container orchestration solution. While Kubernetes has established itself as the industry standard, companies are increasingly seeking alternatives that better align with their deployment needs, team expertise, and operational requirements. This comprehensive guide examines the top alternatives to Kubernetes, helping you make an informed decision for your 2025 container strategy.

2025 observability predictions and trends from Grafana Labs

From AI to eBPF, 2024 reshaped the observability landscape. As we peer into 2025, Grafana Labs’ experts predict another year of innovation that will redefine how teams understand and optimize their systems, from profiling to platform engineering. Their insights align with what the community is saying, according to early responses from our third annual Observability Survey. Do you agree or disagree with the trends our team believes will transform the world of observability next year?

From Gartner IOCS 2024 Conference: AI, Observability Data, and Telemetry Pipelines

Last week, I attended one of the last conferences of the year with team Mezmo: the Gartner IT Infrastructure, Operations & Cloud Strategies Conference in Las Vegas. Not surprisingly, there were over 20 sessions covering observability and how it is getting increasingly critical in the new complex distributed computing environment. Of course, there were many sessions, including all keynotes that addressed the advent and impact of AI on IT operations and observability.

The Next Generation of AI-Powered Observability

AI is changing our world, and its impact on observability is no different. This article discusses some of the components of a good observability platform, how AI is well-positioned to revolutionize observability, and how Lumigo Copilot Beta will provide substantial value to customers and partners.

AI Log Analysis - Shaping the Future of Observability

As digital applications and infrastructures grow increasingly complex, managing and understanding log data has become increasingly vital in achieving practical observability, enabling organizations to detect, diagnose, and prevent issues across their systems. However, traditional log analysis methods often struggle with the volume and complexities of modern log data in cloud-native environments.

Our team's learnings from Kubecon: Use Exemplars, Configuring OTel, and OTTL cookbook

A few weeks ago, members of Mezmo were at Kubecon and attended several sessions. You can see a post with my recap and session highlights. Today, though, I’m going to discuss three sessions that my colleagues found interesting for our peers in Observability.

Scaling Observability on a Budget with Cribl for State, Local, and Education

Over the past year, I’ve noticed some interesting trends in my work with state and local governments. Across my conversations with organizations in this space, there’s a common thread: teams are getting creative about maximizing their limited resources. With budgets either flat or shrinking and operational demands increasing, these teams face tough choices. They’re being asked to maintain or improve services while working with the same, or in some cases, fewer resources than before.

Reduce MTTD+MTTR and Improve User Experience with Observability - Customer Brown Bag - Dec 12, 2024

Please join us as Technical Account Engineer, Duncan McKendrick, teaches how Sumo Logic's observability platform empowers teams to minimize Mean Time to Detect (MTTD) and Mean Time to Resolve (MTTR) while enhancing the overall user experience. Learn how to leverage real-time insights, streamline incident response, and ensure optimal application performance through actionable data.

Observability in the Age of AI

This post was written by Charity Majors and Phillip Carter. In May of 2023, we released the Honeycomb Query Assistant, an LLM-backed feature that lets engineers use natural language to generate and execute queries against their telemetry data. Instead of having to master a domain-specific query language, you can simply type in things like “slow endpoints by status code” and the Query Assistant will generate a relevant Honeycomb query for you to iterate on.

What is Performance Engineering?

Performance engineering transforms how organizations build and optimize software systems. System delays and performance issues directly impact revenue, user satisfaction, and business success. This guide covers performance engineering fundamentals, implementation approaches, and advanced strategies for building high-performing systems.

What Is Full Stack Observability? Best Observability Solutions

Full stack observability (FSO) includes the ability to measure and monitor all layers of business infrastructure, security, and applications, from the underlying hardware and network performance to the user-facing software. As businesses shift from traditional, monolithic systems to more complex environments involving on-premises (on-prem) and cloud infrastructure, there comes a critical need for holistic observability.

What is O11y? Guide to Modern Observability

Distributed architectures with microservices, cloud-native components, and service meshes make traditional monitoring methods inadequate for system analysis. O11y (observability) implements advanced telemetry frameworks for deep system introspection through metrics, traces, and logs collection. This programmatic approach enables real-time debugging, performance optimization, and architectural decisions across distributed environments.

The Hidden Costs of Hybrid IT: How to Close the Observability Gap

Hybrid IT environments are more complex than ever, and 76% of organizations struggle with ongoing cloud operational management. Why? Because most monitoring tools force you to compromise—leaving critical gaps in your observability strategy. The consequences? Slow issue resolution, missed SLAs, and a damaged customer experience that hits your bottom line. SolarWinds is here to help. Learn how we’re laser-focused on closing the hybrid observability gap and empowering you to maximize performance, minimize downtime, and protect your future growth.

What Is DevOps Observability and Why Is It Critical for Modern Organizations?

Observability refers to the ability of the DevOps team to track, monitor, and measure the state of their pipeline and operations. Without observability, you are working in the dark, unaware of what is working. With the growing complexity of modern IT systems, DevOps observability is no longer optional. Gartner estimates that by 2026, 50% of enterprises implementing distributed data architectures will have adopted data observability tools, up from less than 20% in 2024.

Understanding Develocity Build Data with Honeycomb

This post was written by David Chang, Staff Software Engineer at Pinterest, and originally posted on the Pinterest engineering blog on Medium. Develocity, formerly known as Gradle Enterprise, is a powerful tool that speeds up local and CI build time, helps troubleshoot your builds, and analyzes your data. At Pinterest, we have a dedicated team, Mobile Builds, and we ensure that developers can build fast and often. This enables developers to be more productive by getting faster feedback on their code.

Is Your Telemetry Data Strategy Ready for the Next Decade?

What worked for the last 10 years won’t work for the next 10. IT and Security teams face three big challenges with telemetry data: Volume: Telemetry data is growing at a 28% CAGR, while budgets remain flat. Compliance requirements demand retaining massive datasets, straining both storage and costs. Variety: Logs, metrics, traces, configs—telemetry data comes in all shapes and sizes, making it difficult for traditional analytics tools to handle. Your tech needs to manage this complexity seamlessly.

Common Pitfalls to Avoid in Observability Practices

In modern IT systems, most businesses adopt new tools and technologies to stay ahead of competitors. These new technologies are resulting in the proliferation of distributed IT systems. For instance, some enterprises implement cloud computing, edge computing, or microservices architecture, contributing to complex distributed systems across organizations.

Top 8 Docker Alternatives to Consider in 2025

Containerization platforms have evolved beyond Docker's initial implementation, offering specialized solutions for diverse enterprise requirements. Modern container runtimes focus on enhanced security models, optimized resource utilization, and seamless integration with cloud-native architectures. This analysis examines key alternatives that address Docker's technical limitations and provide advanced features for production workloads.

The Complete Podman vs Docker Analysis: Features, Performance & Security

Choosing the right container engine for your infrastructure stack is a critical architectural decision. While both Podman and Docker implement OCI (Open Container Initiative) standards, their fundamental approaches to container management and runtime architecture create distinct operational characteristics.

Introducing Warm Tier: Cost-Efficient Log Storage to Simplify Observability

These days, one of the most important decisions that organizations can make as it relates to their observability strategy is: “How much data do we want to retain in Hot storage to ensure we have everything needed for real time analysis — without running up associated costs?”

The Future of Kubernetes Observability

The Kubernetes ecosystem is undergoing a significant transformation, and the trends emerging at KubeCon highlight just how dynamic this space has become. Traditional Application Performance Monitoring (APM) providers are rapidly shifting focus to Kubernetes Performance Monitoring (KPM), reflecting the growing need for specialized observability in increasingly complex environments.

OpenTelemetry - Complete Guide to the Open-Source Observability Framework

In cloud-native environments, observability is key to ensuring the health, performance, and stability of distributed systems. Observability helps developers and operations teams understand how their systems behave in real time, helping diagnose issues, optimize performance, and meet service-level agreements.

How to elevate your IT strategy starting today: SolarWinds Observability Self-Hosted

Discover the power of SolarWinds Observability Self-Hosted, the ultimate solution for full-stack visibility across your hybrid IT environment. From network to infrastructure, apps, databases, and security, gain a centralized view to detect and resolve issues faster than ever before. What you'll learn in this video.

Kentik Bytes: Enhancing Azure Observability with Kentik

Kentik offers exceptional visibility into Azure public cloud environments, allowing users to easily filter and explore cloud telemetry. The platform provides detailed insights into network resources, including traffic metrics and peering information. Users can focus on specific applications and visualize data in a wide variety of formats, including Sankey diagrams. Additionally, you can adjust time frames, create alerts, and share reports for better traffic management.

Duolingo: Speaking the Language of Observability with Honeycomb

In the world of digital language learning, Duolingo stands out as a beacon of innovation and user engagement. With millions of users worldwide, their platform is designed not only to teach languages, but also to create a fun and engaging learning experience. Running on the robust AWS cloud infrastructure, Duolingo manages vast amounts of data and user interactions daily. As the company experienced rapid growth, Duolingo remained steadfast in their commitment to delivering a high-quality user experience.

Lightrun Unveils Game-Changing Visual Studio Extension and Dynamic Traces at AWS ReInvent 2024

As we kick off the AWS re:Invent 2024 conference, we’re thrilled to introduce two major developer observability and live debugging advancements that bring even greater power and flexibility to developers and engineering teams everywhere. These new product capabilities — the Lightrun Visual Studio Extension and Lightrun Dynamic Traces — are designed to elevate customers’ observability workflows and streamline their development processes directly within their IDE.

How to Fix "Upstream Connect Error" in 7 Different Contexts

The error "upstream connect error or disconnect/reset before headers. reset reason: connection failure" has become a challenge for DevOps teams. This critical error, occurring when services fail to establish or maintain connections with their upstream dependencies, can significantly impact system reliability and user experience.

SolarWinds Observability SaaS: Visibility across cloud-native, on-prem, and hybrid IT stacks.

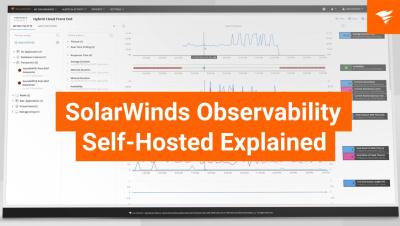
Ready to transform your IT operations? SolarWinds Observability unifies your entire tech stack—network, infrastructure, apps, databases, and user experience—into one seamless platform. Gain business-level insights, analytics, and automation to optimize performance and ensure availability. Monitor everything: from cloud infrastructure to network devices, all on a single dashboard. With health scores, dynamic dependency maps, and detailed log analysis, pinpointing issues has never been easier.

The future is now, introducing Dynamic Observability from AI innovations built on logs

A year ago, I shared my thoughts at re:Invent, explaining why I joined Sumo Logic as CEO and laid out the importance of logs as a key differentiator. A year later, the atomic level of logs is even more paramount. It’s not just because Sumo Logic is years ahead in technology when it comes to ingesting and analyzing structured and unstructured logs.

From ELK Stack to easy - Elastic Observability on Elastic Cloud Serverless

Announcing the general availability of Elastic Observability on Elastic Cloud Serverless — a fully managed observability solution As organizations scale, an observability solution that can handle the complexity of distributed cloud environments and provide real-time insights often feels like an insurmountable challenge often due to data- and cost-related compromises.