Operations | Monitoring | ITSM | DevOps | Cloud



Running Postgres in Docker
So you want to spin up a Postgres database on your local machine, but you don't fancy having to install and manage everything manually? Running Postgres inside Docker is a great way to simplify the situation. It lets you: In this article I will explain how to do this step by step.
Dashboard Fridays: Sample VMware dashboard

Three Ways to Run Prometheus
Prometheus is an open source and free to use metrics collection and storage solution. It's used extensively in the industry for monitoring many different technologies. In this article I will show you how to get Prometheus up and running as a binary, a container running in Docker, and inside Kubernetes.
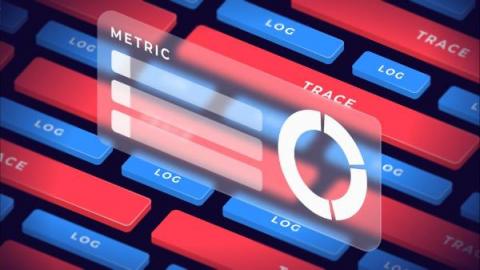
Metrics vs. Logs vs. Traces (vs. Profiles)
In software observability, we often talk about three signal types - metrics, logs, and distributed traces. More recently I've been hearing about profiles as another signal type. In this article I will explain the different observability signals and when to use them in a clear and concise way.
Instrumenting Node.js code with Prometheus custom metrics
Automatic instrumentation is great, but to get the most out of your monitoring you often need to instrument your code. In this article I am going to explain how to instrument a Node.js express app with custom metrics using the Prometheus prom-client package. Although this article specifically addresses Node.js and express, my hope is that the general concepts are applicable to other languages too.