Operations | Monitoring | ITSM | DevOps | Cloud

Tracing

The latest News and Information on Distributed Tracing and related technologies.

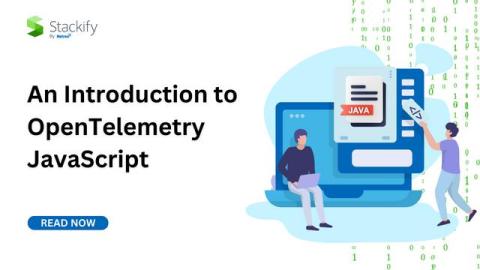
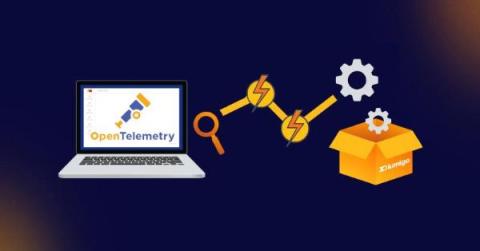
An Introduction to OpenTelemetry JavaScript

Monitoring and observing application performance is a cornerstone for maintaining robust and efficient systems in the ever-evolving development landscape. One key player in this domain is OpenTelemetry. This post provides a comprehensive tutorial and unpacks what OpenTelemetry is, its applications and integration into the JavaScript ecosystem.

How to export Azure Monitor Metrics using OpenTelemetry to SigNoz

Using OpenTelemetry Collector, you can collect metrics from Azure monitor and export them to any backend of your choice. Azure Monitor is a powerful service within the Microsoft Azure ecosystem that provides extensive metrics and logging capabilities. Yet the siloed nature of data in such tools can obscure the bigger picture, hindering a holistic view of system health. In this tutorial, we cover: If you want to jump straight into implementation, start with this Prerequisites section.

Kubernetes Events Monitoring with OpenTelemetry | Complete Tutorial

Events in Kubernetes are objects that provide insights into the state changes within the Kubernetes cluster. Kubernetes events monitoring is critical to provide real-time insights into the operational state of a Kubernetes cluster. It enables administrators to quickly identify and respond to issues, optimize resource allocation, and ensure the smooth and efficient functioning of their containerized applications.

OpenTelemetry ECS Tutorial - Monitor AWS ECS metrics [Step-By-Step Guide]

OpenTelemetry can be used to monitor ECS clusters. In this tutorial, you will install OpenTelemetry Collector to collect ECS metrics and then send the collected data to SigNoz for monitoring and visualization. In this tutorial, we cover: If you want to jump straight into implementation, start with this Pre-requisites section.

Webinar Recap: Saving the Holidays with Quix and InfluxDB: The Open Telemetry Anomaly Detection Story

Just in time for your holiday viewing! Learn how to solve real-time time series processing challenges with Quix—the stream processing framework using Kafka and Python—and purpose-built time series database InfluxDB.

2024 Unveiled: Catchpoint's Predictions for APM, ITOM, OTel & Beyond

As the holiday season rolls in, it’s not just about festive cheer and resolutions; it’s also time for industry leaders to cast their predictions for the new year. This year, Catchpoint’s thought leaders have stepped up with their hottest takes for 2024. Catchpoint experts are envisioning a transformative shift in the monitoring technologies, a heightened focus on performance as a key metric, and an integrated strategy for managing digital performance management.

Top 11 Kubernetes Monitoring Tools[Includes Free & Open-Source] in 2024

Are you looking for Kubernetes monitoring tools? Then you have come to the right place. Kubernetes has grown to become the container orchestration platform of choice. It simplifies managing your containerized workloads. You get the power of automating deployments, scaling resources, and keeping your applications running smoothly. But with great power comes added responsibility. And like any complex system, Kubernetes needs monitoring.

The Power of Distributed Tracing in Shifting Observability Left

This is the second post in a 3-part series about shifting Observability left. If you have not had a chance to read the first, you can find it here. In today’s complex microservices deployments, gaining visibility into deployments is vital for optimal system performance and scalability. This has become even more important as the tech industry has moved toward microservice architecture reliance. Navigating through logs has become increasingly complex as requirements have grown.

Three Pillars of Observability [And Beyond]

Observability is often defined in the context of three pillars: logs, metrics, and traces. Modern-day cloud-native applications are complex and dynamic. To avoid surprises and performance issues, you need a robust observability stack. But is observability limited to collecting logs, metrics, and traces? How is observability evolving to make our systems more observable? In this tutorial, we cover.