Operations | Monitoring | ITSM | DevOps | Cloud
Tracing
The latest News and Information on Distributed Tracing and related technologies.
The Power of Distributed Tracing in Shifting Observability Left
This is the second post in a 3-part series about shifting Observability left. If you have not had a chance to read the first, you can find it here. In today’s complex microservices deployments, gaining visibility into deployments is vital for optimal system performance and scalability. This has become even more important as the tech industry has moved toward microservice architecture reliance. Navigating through logs has become increasingly complex as requirements have grown.
Three Pillars of Observability [And Beyond]
Cool Retrace Feature - Email and share your Dashboards
OpenTelemetry best practices: A user's guide to getting started with OpenTelemetry
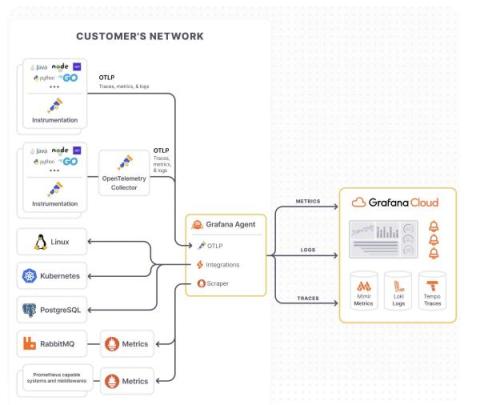
If you’ve landed on this blog, you’re likely either considering starting your OpenTelemetry journey or you are well on your way. As OpenTelemetry adoption has grown, not only within the observability community but also internally at Grafana Labs and among our users, we frequently get requests around how to best implement an OpenTelemetry strategy.
A Bright New Era in Developer Troubleshooting with Lumigo and OpenTelemetry
At Lumigo, building developer-first tools has always been at the forefront of our approach to troubleshooting and debugging. As developers ourselves, we have experienced firsthand the frustration and intricacies of sifting through logs looking for answers. We’ve also felt the pressure of the clock ticking, with production issues waiting to be resolved and the need for timely answers to surfaced application issues.
OpenTelemetry Overview
Monitoring distributed systems means collecting data from various sources, including servers, containers, and applications. In large organizations, this data distribution makes it harder to get a single view of the performance of their entire system. OpenTelemetry helps you streamline your full-stack observability efforts by giving you a single, universal format for collecting and sending telemetry data. Thus, OpenTelemetry makes improving performance and troubleshooting issues easier for teams.
Lumigo Releases 1-Click OpenTelemetry for Microservices Troubleshooting
Lumigo is excited to announce its microservice troubleshooting platform now provides developers and DevOps with the power of OpenTelemetry (OTel) with a single click. Lumigo has long been the leading troubleshooting platform for serverless, but now, users can harness its best-in-class debugging and observability platform for all microservices-based environments.


