Operations | Monitoring | ITSM | DevOps | Cloud

The latest News and Information on Application Performance Monitoring and related technologies.

The Personalization Paradox: When Tailored UX Turns "Creepy"

“Stop watching me.” That’s an actual message a user typed into a search bar, captured during session monitoring. They weren’t talking to customer support. They were talking to the algorithm. It sounds absurd until you realize how common this is. When users believe a human is behind your personalization system, attributing consciousness to your automated algorithms, everything changes. Their behavior becomes erratic. Your conversions tank. And nobody talks about it.

Introducing Cost Meter - Proactive Observability Cost Control with Per-Hour Granularity

The irony isn't lost on us - observability platforms are built to be proactive about system health, yet when it comes to managing observability costs themselves, teams are forced to be reactive. Today, that changes with Cost Meter, now live in our platform. Cost Meter transforms observability spend management from a monthly billing surprise into a proactive, data-driven process with hourly aggregated metrics that give you complete visibility into your telemetry ingestion patterns.

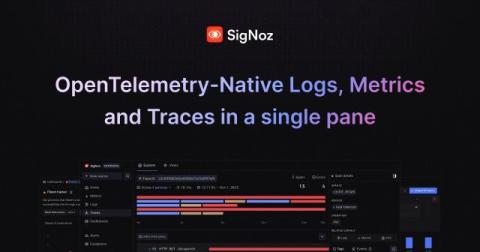
Understanding OpenTelemetry Spans in Detail

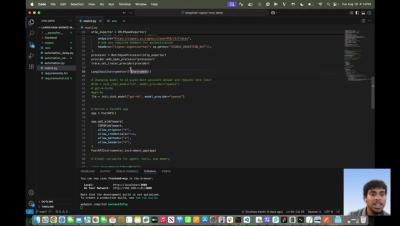
Debugging errors in distributed systems can be a challenging task, as it involves tracing the flow of operations across numerous microservices. This complexity often leads to difficulties in pinpointing the root cause of performance issues or errors. OpenTelemetry provides instrumentation libraries in most programming languages for tracing.