Operations | Monitoring | ITSM | DevOps | Cloud

The latest News and Information on Monitoring for Websites, Applications, APIs, Infrastructure, and other technologies.

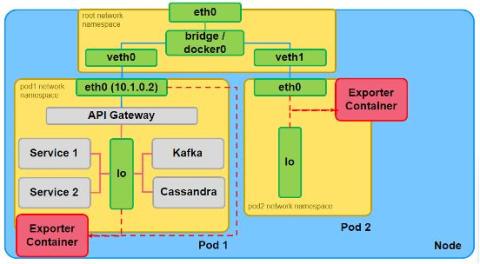
Troubleshoot streaming data pipelines directly from APM with Datadog Data Streams Monitoring

When monitoring applications with streaming data pipelines, there are additional complexities to consider that are not present in traditional batch-processing systems. Whether you’re using streaming data pipelines to power a digital trading platform, capture sensor data from an IoT device, or recommend news articles to users, it can be challenging to identify the root cause of delays when you’re dealing with distributed systems, real-time data, and the dynamic nature of events.

Accelerating Detection to Resolution: A Case Study in Internet Resilience

Today, any revenue-generating website is like a house of cards, poised to collapse with multiple points of failure. The modern service delivery chain relies on intricate multi-step transactions and third-party API integrations, making the system more complex and interconnected. A single point of failure in the architectural diagram above can lead to slowdowns and outages with tangible consequences on your bottom line.

Sending Go Application Logs to Loggly

If you’ve been building web apps long enough, you’ve certainly read through your fair share of logs. One of the more painful parts of going through web app logs is getting them all to the same place. It’s only then you can review your logs and troubleshoot your applications. In this article, we’ll build a simple Go web app to send logs to SolarWinds® Loggly®.

RabbitMQ monitoring with OpenTelemetry

More about SigNoz: SigNoz - Monitor your applications and troubleshoot problems in your deployed applications, an open-source alternative to DataDog, New Relic, etc. Backed by Y Combinator. SigNoz helps developers monitor applications and troubleshoot problems in their deployed applications. SigNoz uses distributed tracing to gain visibility into your software stack. If you need any clarification or find something missing, feel free to raise a GitHub issue with the label documentation or reach out to us at the community slack channel.

Getting started with Application Observability for Java

Links: Description: Get started with instrumenting Java applications with Grafana Cloud to observe them, detect anomalies, and find root causes. In this video, Grafana Developer Advocate Leandro Melendez outlines how to quickly get started with Application Observability for Java based on these three easy steps: Download the Grafana instrumentation agent Instrument an application and send telemetry data to the Grafana Cloud OTLP Endpoint Observe the service in Application Observability.