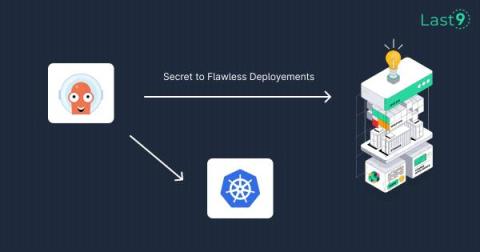
Real-Time Canary Deployment Tracking with Argo CD & Levitate Change Events
Use Levitate's powerful domain events to track success of canary rollouts via ArgoCD.


The latest News and Information on Monitoring for Websites, Applications, APIs, Infrastructure, and other technologies.
For many developers and engineers, Kubernetes is the de facto choice for container orchestration. That’s primarily because of its efficiency in handling and scaling container workloads. However, the complexity of managing nodes in a Kubernetes cluster can cause recurring headaches for even the most experienced and skilled IT teams. This is where `kubectl cordon` comes into play.
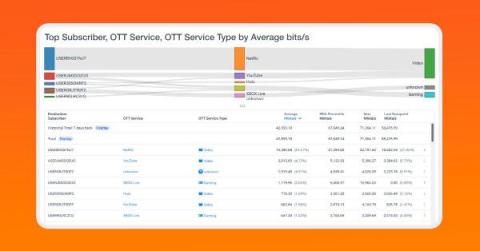
Broadband subscriber behavior analysis is the process of collecting and analyzing data on how broadband subscribers use the internet. This data can be used to gain insights into subscriber needs and preferences, as well as to identify potential problems with the broadband service.
In this year’s report, we see how organizations are using containers not just to solve their day-to-day infrastructure needs. Rather, customers are exploring the next technology frontier of containers by building next-generation applications, enhancing developer productivity, and optimizing costs.
This article covers the benefits and instructions for deploying Service Watch Desktop for end-user devices and Desktop Virtualization platforms such as Azure Virtual Desktop, Windows 365, or Amazon Workspaces. The use of Virtual Desktop Infrastructure (VDI) is on the rise because of remote work, and increased need for security, and outsourcing. The rise of these environments brings the need to proactively monitor and troubleshoot remote virtual desktops - there are lots more moving parts, for sure.
According to a study by Zippia, 70% of the organizations already have a digital transformation policy in place or are currently working on one. This implies the growing significance of modernization in IT. With new-age techniques such as SD-WAN, organizations can deliver an enhanced end-user experience, ensure reliable QoS, enhance their network security, optimize their network performance, and reduce their overhead costs.